Collect custom metrics for a Linux VM with the InfluxData Telegraf agent
Caution
This article references CentOS, a Linux distribution that is nearing End Of Life (EOL) status. Please consider your use and planning accordingly. For more information, see the CentOS End Of Life guidance.
This article explains how to deploy and configure the InfluxData Telegraf agent on a Linux virtual machine to send metrics to Azure Monitor.
Note
InfluxData Telegraf is an open source agent and not officially supported by Azure Monitor. For issues with the Telegraf connector, please refer to the Telegraf GitHub page here: InfluxData
InfluxData Telegraf agent
Telegraf is a plug-in-driven agent that enables the collection of metrics from over 150 different sources. Depending on what workloads run on your VM, you can configure the agent to use specialized input plug-ins to collect metrics. Examples are MySQL, NGINX, and Apache. By using output plug-ins, the agent can then write to destinations that you choose. The Telegraf agent has integrated directly with the Azure Monitor custom metrics REST API. It supports an Azure Monitor output plug-in. Using this plug-in, the agent can collect workload-specific metrics on your Linux VM and submit them as custom metrics to Azure Monitor.

Connect to the VM
Create an SSH connection to the VM where you want to install Telegraf. Select the Connect button on the overview page for your virtual machine.

In the Connect to virtual machine page, keep the default options to connect by DNS name over port 22. In Login using VM local account, a connection command is shown. Select the button to copy the command. The following example shows what the SSH connection command looks like:
ssh azureuser@XXXX.XX.XXX
Paste the SSH connection command into a shell, such as Azure Cloud Shell or Bash on Ubuntu on Windows, or use an SSH client of your choice to create the connection.
Install and configure Telegraf
To install the Telegraf Debian package onto the VM, run the following commands from your SSH session:
Add the repository:
# download the package to the VM
curl -s https://repos.influxdata.com/influxdb.key | sudo apt-key add -
source /etc/lsb-release
sudo echo "deb https://repos.influxdata.com/${DISTRIB_ID,,} ${DISTRIB_CODENAME} stable" | sudo tee /etc/apt/sources.list.d/influxdb.list
sudo curl -fsSL https://repos.influxdata.com/influxdata-archive_compat.key | sudo apt-key --keyring /etc/apt/trusted.gpg.d/influxdata-archive_compat.gpg add
Install the package:
   sudo apt-get update
   sudo apt-get install telegraf
Telegraf's configuration file defines Telegraf's operations. By default, an example configuration file is installed at the path /etc/telegraf/telegraf.conf. The example configuration file lists all possible input and output plug-ins. However, we'll create a custom configuration file and have the agent use it by running the following commands:
# generate the new Telegraf config file in the current directory
telegraf --input-filter cpu:mem --output-filter azure_monitor config > azm-telegraf.conf

# replace the example config with the new generated config
sudo cp azm-telegraf.conf /etc/telegraf/telegraf.conf
Note
The preceding code enables only two input plug-ins: cpu and mem. You can add more input plug-ins, depending on the workload that runs on your machine. Examples are Docker, MySQL, and NGINX. For a full list of input plug-ins, see the Additional configuration section.
Finally, to have the agent start using the new configuration, we force the agent to stop and start by running the following commands:
# stop the telegraf agent on the VM
sudo systemctl stop telegraf
# start and enable the telegraf agent on the VM to ensure it picks up the latest configuration
sudo systemctl enable --now telegraf
Now the agent collects metrics from each of the input plug-ins specified and emits them to Azure Monitor.
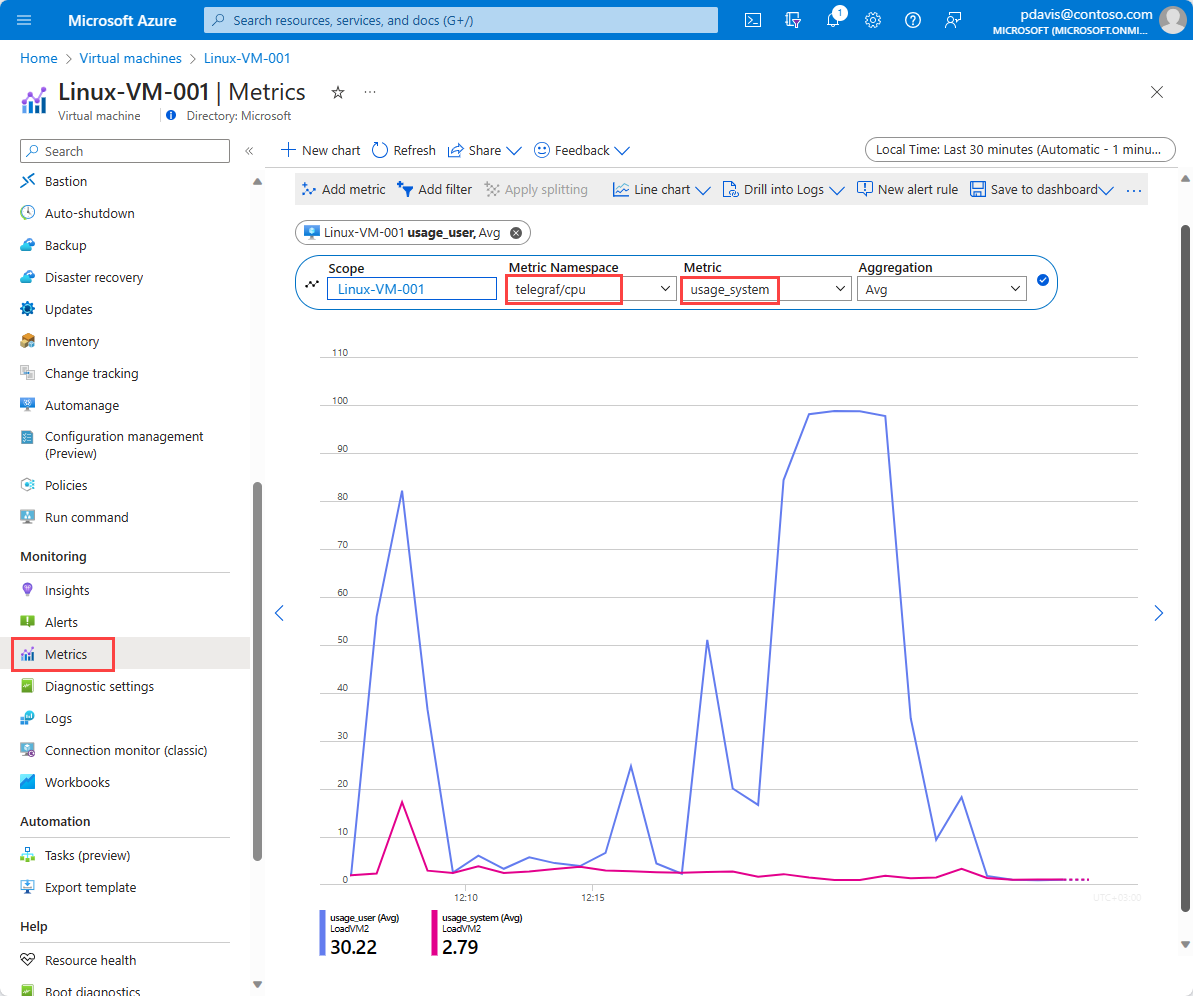
Plot your Telegraf metrics in the Azure portal
Open the Azure portal.
Navigate to the new Monitor tab. Then select Metrics.
Select your VM in the resource selector.
Select the Telegraf/CPU namespace, and select the usage_system metric. You can choose to filter by the dimensions on this metric or split on them.

Additional configuration
The preceding walkthrough provides information on how to configure the Telegraf agent to collect metrics from a few basic input plug-ins. The Telegraf agent has support for over 150 input plug-ins, with some supporting additional configuration options. InfluxData has published a list of supported plugins and instructions on how to configure them.
Additionally, in this walkthrough, you used the Telegraf agent to emit metrics about the VM the agent is deployed on. The Telegraf agent can also be used as a collector and forwarder of metrics for other resources. To learn how to configure the agent to emit metrics for other Azure resources, see Azure Monitor Custom Metric Output for Telegraf.
Clean up resources
When they're no longer needed, you can delete the resource group, virtual machine, and all related resources. To do so, select the resource group for the virtual machine and select Delete. Then confirm the name of the resource group to delete.
Next steps
- Learn more about custom metrics.
Feedback
Coming soon: Throughout 2024 we will be phasing out GitHub Issues as the feedback mechanism for content and replacing it with a new feedback system. For more information see: https://aka.ms/ContentUserFeedback.
Submit and view feedback for