Application Monitoring for Azure App Service and Java
Monitoring of your Java web applications running on Azure App Services doesn't require any modifications to the code. This article walks you through enabling Azure Monitor Application Insights monitoring and provides preliminary guidance for automating the process for large-scale deployments.
Note
With Spring Boot Native Image applications, use the Azure Monitor OpenTelemetry Distro / Application Insights in Spring Boot native image Java application project instead of the Application Insights Java agent solution described below.
Enable Application Insights
The recommended way to enable application monitoring for Java applications running on Azure App Services is through Azure portal. Turning on application monitoring in Azure portal will automatically instrument your application with Application Insights, and doesn't require any code changes. You can apply extra configurations, and then based on your specific scenario you add your own custom telemetry if needed.
Autoinstrumentation through Azure portal
You can turn on monitoring for your Java apps running in Azure App Service just with one selection, no code change required. The integration adds Application Insights Java 3.x and auto-collects telemetry.
For a complete list of supported autoinstrumentation scenarios, see Supported environments, languages, and resource providers.
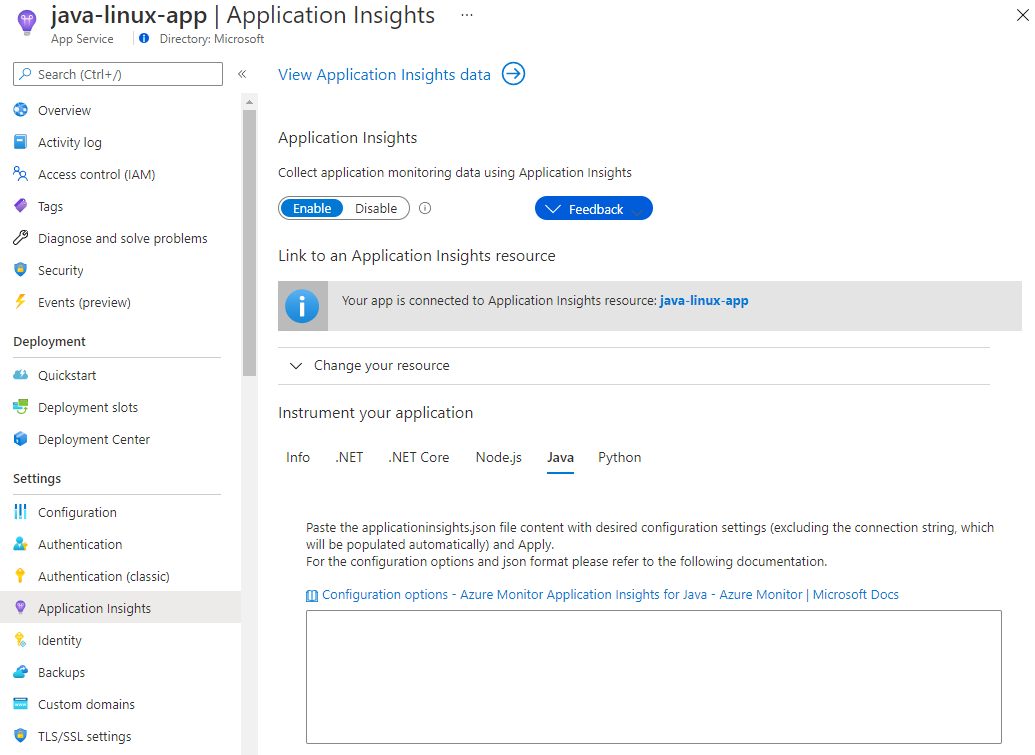
Select Application Insights in the Azure control panel for your app service, then select Enable.
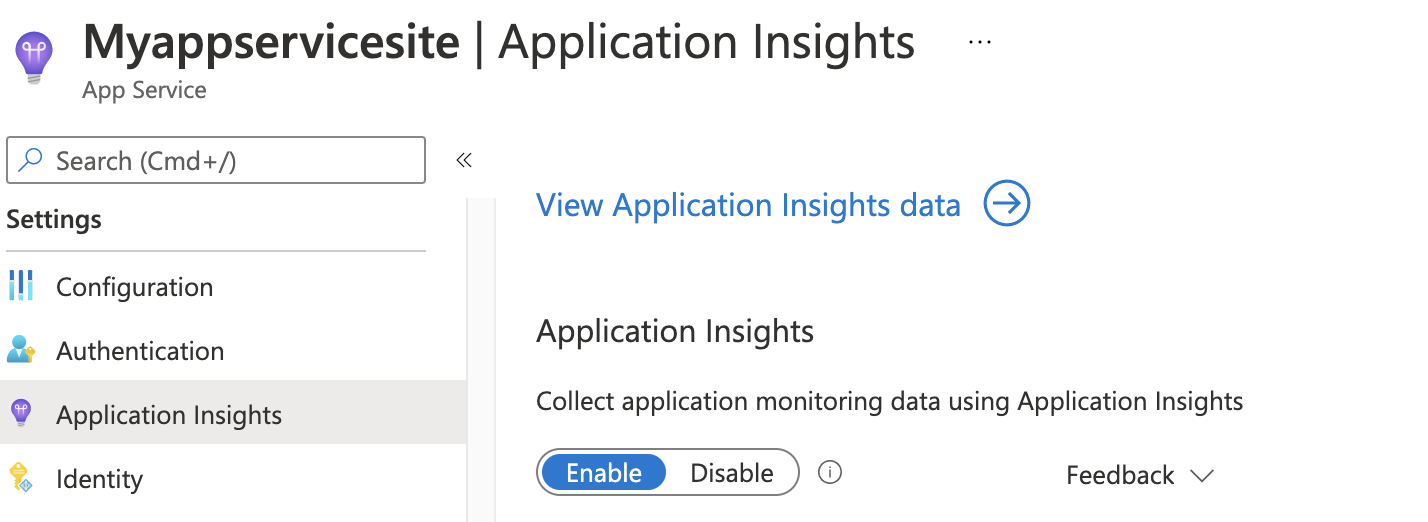
Choose to create a new resource, or select an existing Application Insights resource for this application.
Note
When you select OK to create the new resource you will be prompted to Apply monitoring settings. Selecting Continue will link your new Application Insights resource to your app service, doing so will also trigger a restart of your app service.
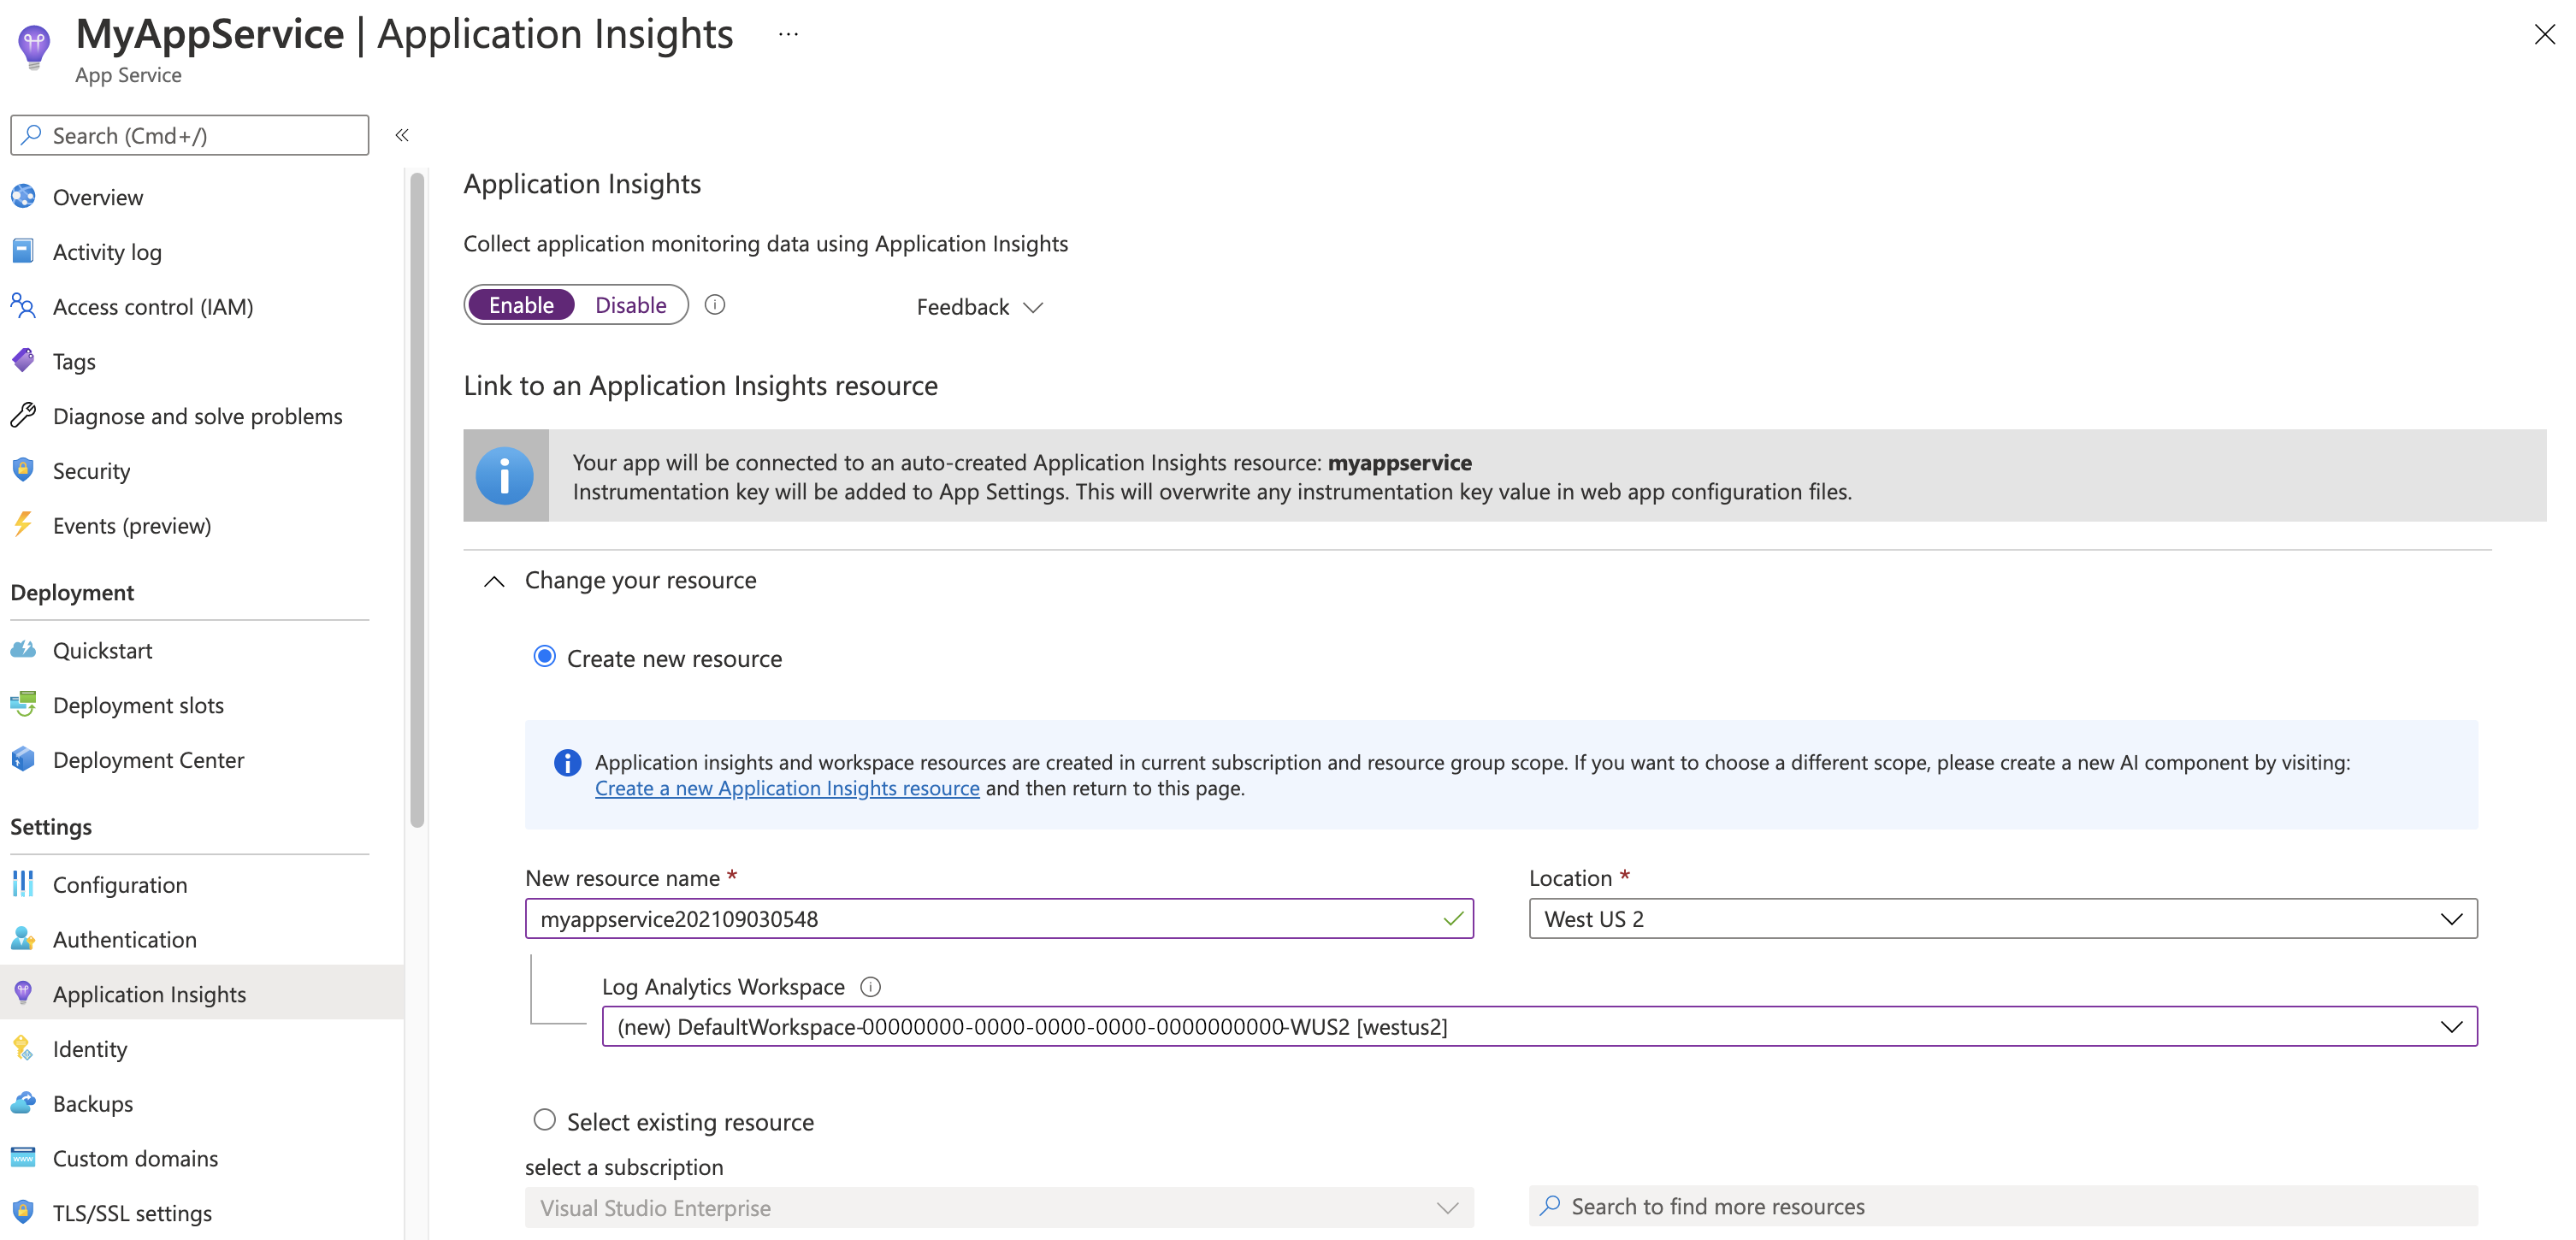
This last step is optional. After specifying which resource to use, you can configure the Java agent. If you don't configure the Java agent, default configurations apply.
The full set of configurations is available, you just need to paste a valid json file. Exclude the connection string and any configurations that are in preview - you're able to add the items that are currently in preview as they become generally available.
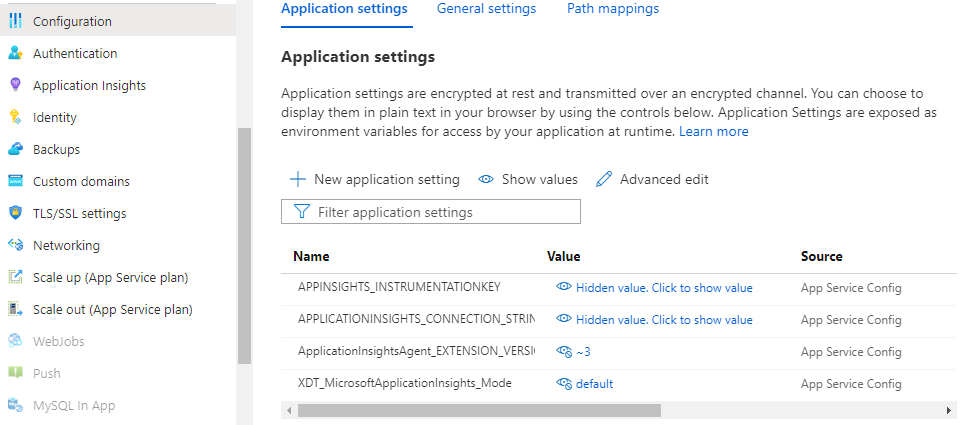
Once you modify the configurations through Azure portal, APPLICATIONINSIGHTS_CONFIGURATION_FILE environment variable are automatically populated and appear in App Service settings panel. This variable contains the full json content that you've pasted in Azure portal configuration text box for your Java app.
Enable client-side monitoring
To enable client-side monitoring for your Java application, you need to manually add the client-side JavaScript SDK to your application.
Automate monitoring
In order to enable telemetry collection with Application Insights, only the following Application settings need to be set:
Application settings definitions
| App setting name | Definition | Value |
|---|---|---|
| ApplicationInsightsAgent_EXTENSION_VERSION | Main extension, which controls runtime monitoring. | ~2 in Windows or ~3 in Linux. |
| XDT_MicrosoftApplicationInsights_Java | Flag to control if Java agent is included. | 0 or 1 (only applicable in Windows). |
Note
Profiler and snapshot debugger are not available for Java applications
App Service application settings with Azure Resource Manager
Application settings for Azure App Service can be managed and configured with Azure Resource Manager templates. You can use this method when you deploy new App Service resources with Resource Manager automation or modify the settings of existing resources.
The basic structure of the application settings JSON for an App Service resource:
      "resources": [
        {
          "name": "appsettings",
          "type": "config",
          "apiVersion": "2015-08-01",
          "dependsOn": [
            "[resourceId('Microsoft.Web/sites', variables('webSiteName'))]"
          ],
          "tags": {
            "displayName": "Application Insights Settings"
          },
          "properties": {
            "key1": "value1",
            "key2": "value2"
          }
        }
      ]
For an example of a Resource Manager template with application settings configured for Application Insights, this template can be helpful. Specifically, see the section that starts on line 238.
Automate the creation of an Application Insights resource and link to your newly created App Service resource
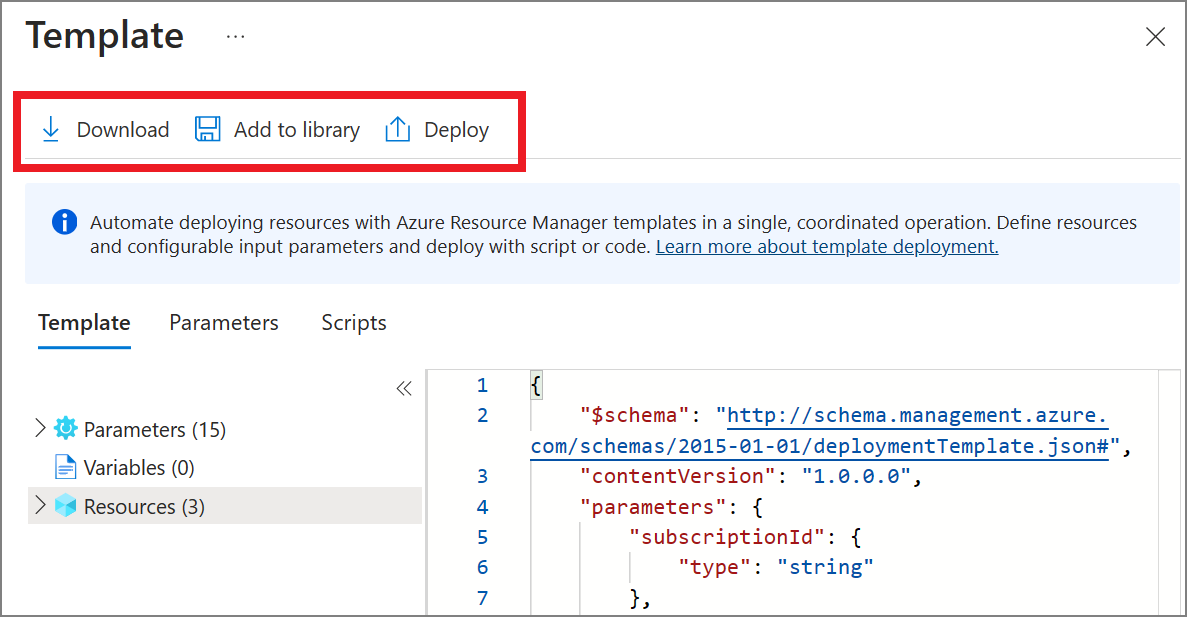
To create a Resource Manager template with the default Application Insights settings, begin the process as if you were going to create a new web app with Application Insights enabled.
Create a new App Service resource with your desired web app information. Enable Application Insights on the Monitoring tab.
Select Review + create. Then select Download a template for automation.
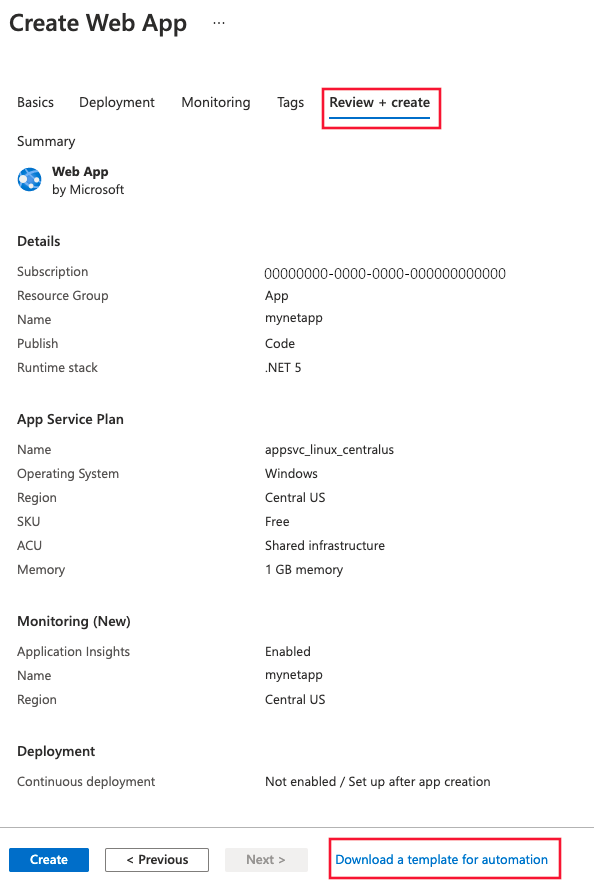
This option generates the latest Resource Manager template with all required settings configured.


In the following sample, replace all instances of AppMonitoredSite with your site name:
Note
If using Windows, set ApplicationInsightsAgent_EXTENSION_VERSION to ~2. If using Linux, set ApplicationInsightsAgent_EXTENSION_VERSION to ~3.
{
    "resources": [
        {
            "name": "[parameters('name')]",
            "type": "Microsoft.Web/sites",
            "properties": {
                "siteConfig": {
                    "appSettings": [
                        {
                            "name": "APPINSIGHTS_INSTRUMENTATIONKEY",
                            "value": "[reference('microsoft.insights/components/AppMonitoredSite', '2015-05-01').InstrumentationKey]"
                        },
                        {
                            "name": "APPLICATIONINSIGHTS_CONNECTION_STRING",
                            "value": "[reference('microsoft.insights/components/AppMonitoredSite', '2015-05-01').ConnectionString]"
                        },
                        {
                            "name": "ApplicationInsightsAgent_EXTENSION_VERSION",
                            "value": "~2"
                        }
                    ]
                },
                "name": "[parameters('name')]",
                "serverFarmId": "[concat('/subscriptions/', parameters('subscriptionId'),'/resourcegroups/', parameters('serverFarmResourceGroup'), '/providers/Microsoft.Web/serverfarms/', parameters('hostingPlanName'))]",
                "hostingEnvironment": "[parameters('hostingEnvironment')]"
            },
            "dependsOn": [
                "[concat('Microsoft.Web/serverfarms/', parameters('hostingPlanName'))]",
                "microsoft.insights/components/AppMonitoredSite"
            ],
            "apiVersion": "2016-03-01",
            "location": "[parameters('location')]"
        },
        {
            "apiVersion": "2016-09-01",
            "name": "[parameters('hostingPlanName')]",
            "type": "Microsoft.Web/serverfarms",
            "location": "[parameters('location')]",
            "properties": {
                "name": "[parameters('hostingPlanName')]",
                "workerSizeId": "[parameters('workerSize')]",
                "numberOfWorkers": "1",
                "hostingEnvironment": "[parameters('hostingEnvironment')]"
            },
            "sku": {
                "Tier": "[parameters('sku')]",
                "Name": "[parameters('skuCode')]"
            }
        },
        {
            "apiVersion": "2015-05-01",
            "name": "AppMonitoredSite",
            "type": "microsoft.insights/components",
            "location": "West US 2",
            "properties": {
                "ApplicationId": "[parameters('name')]",
                "Request_Source": "IbizaWebAppExtensionCreate"
            }
        }
    ],
    "parameters": {
        "name": {
            "type": "string"
        },
        "hostingPlanName": {
            "type": "string"
        },
        "hostingEnvironment": {
            "type": "string"
        },
        "location": {
            "type": "string"
        },
        "sku": {
            "type": "string"
        },
        "skuCode": {
            "type": "string"
        },
        "workerSize": {
            "type": "string"
        },
        "serverFarmResourceGroup": {
            "type": "string"
        },
        "subscriptionId": {
            "type": "string"
        }
    },
    "$schema": "https://schema.management.azure.com/schemas/2014-04-01-preview/deploymentTemplate.json#",
    "contentVersion": "1.0.0.0"
}
Enable through PowerShell
To enable the application monitoring through PowerShell, only the underlying application settings must be changed. The following sample enables application monitoring for a website called AppMonitoredSite in the resource group AppMonitoredRG. It configures data to be sent to the 012345678-abcd-ef01-2345-6789abcd instrumentation key.
Note
We recommend that you use the Azure Az PowerShell module to interact with Azure. See Install Azure PowerShell to get started. To learn how to migrate to the Az PowerShell module, see Migrate Azure PowerShell from AzureRM to Az.
Note
If using Windows, set ApplicationInsightsAgent_EXTENSION_VERSION to ~2. If using Linux, set ApplicationInsightsAgent_EXTENSION_VERSION to ~3.
$app = Get-AzWebApp -ResourceGroupName "AppMonitoredRG" -Name "AppMonitoredSite" -ErrorAction Stop
$newAppSettings = @{} # case-insensitive hash map
$app.SiteConfig.AppSettings | %{$newAppSettings[$_.Name] = $_.Value} # preserve non Application Insights application settings.
$newAppSettings["APPINSIGHTS_INSTRUMENTATIONKEY"] = "012345678-abcd-ef01-2345-6789abcd"; # set the Application Insights instrumentation key
$newAppSettings["APPLICATIONINSIGHTS_CONNECTION_STRING"] = "InstrumentationKey=012345678-abcd-ef01-2345-6789abcd"; # set the Application Insights connection string
$newAppSettings["ApplicationInsightsAgent_EXTENSION_VERSION"] = "~2"; # enable the ApplicationInsightsAgent
$app = Set-AzWebApp -AppSettings $newAppSettings -ResourceGroupName $app.ResourceGroup -Name $app.Name -ErrorAction Stop
Troubleshooting
Use our step-by-step guide to troubleshoot Java-based applications running on Azure App Services.
Check that
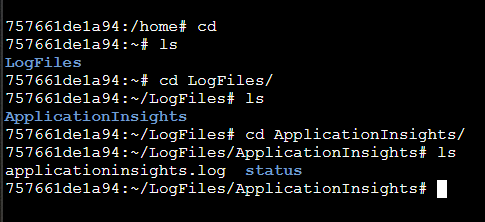
ApplicationInsightsAgent_EXTENSION_VERSIONapp setting is set to a value of "~2" on Windows, "~3" on LinuxExamine the log file to see that the agent has started successfully: browse to `https://yoursitename.scm.azurewebsites.net/, under SSH change to the root directory, the log file is located under LogFiles/ApplicationInsights.
After enabling application monitoring for your Java app, you can validate that the agent is working by looking at the live metrics - even before you deploy and app to App Service you'll see some requests from the environment. Remember that the full set of telemetry is only available when you have your app deployed and running.
Set APPLICATIONINSIGHTS_SELF_DIAGNOSTICS_LEVEL environment variable to 'debug' if you don't see any errors and there's no telemetry
What's the difference between standard metrics from Application Insights vs. Azure App Service metrics?
Application Insights collects telemetry for the requests that made it to the application. If the failure occurs in WebApps/WebServer, and the request didn't reach the user application, Application Insights doesn't have any telemetry about it.
The duration for serverresponsetime calculated by Application Insights doesn't necessarily match the server response time observed by Web Apps. This behavior is because Application Insights only counts the duration when the request actually reaches the user application. If the request is stuck or queued in WebServer, the waiting time is included in the Web Apps metrics but not in Application Insights metrics.
Test connectivity between your application host and the ingestion service
Application Insights SDKs and agents send telemetry to get ingested as REST calls to our ingestion endpoints. You can test connectivity from your web server or application host machine to the ingestion service endpoints by using raw REST clients from PowerShell or curl commands. See Troubleshoot missing application telemetry in Azure Monitor Application Insights.
Manually deploy the latest Application Insights Java version
The Application Insights Java version is updated automatically as part of App Services updates.
If you encounter an issue that's fixed in the latest version of Application Insights Java, you can update it manually.
To manually update, follow these steps:
Upload the Java agent jar file to App Service
a. First, get the latest version of Azure CLI by following the instructions here.
b. Next, get the latest version of the Application Insights Java agent by following the instructions here.
c. Then, deploy the Java agent jar file to App Service using the following command:
az webapp deploy --src-path applicationinsights-agent-{VERSION_NUMBER}.jar --target-path java/applicationinsights-agent-{VERSION_NUMBER}.jar --type static --resource-group {YOUR_RESOURCE_GROUP} --name {YOUR_APP_SVC_NAME}. Alternatively, you can use this guide to deploy the agent through the Maven plugin.Disable Application Insights via the Application Insights tab in the Azure portal.
Once the agent jar file is uploaded, go to App Service configurations. If you need to use Startup Command for Linux, please include jvm arguments:
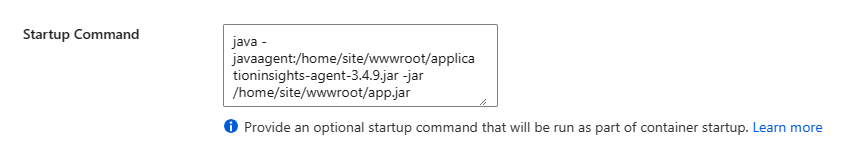
Startup Command doesn't honor
JAVA_OPTSfor JavaSE orCATALINA_OPTSfor Tomcat.If you don't use Startup Command, create a new environment variable,
JAVA_OPTSfor JavaSE orCATALINA_OPTSfor Tomcat, with the value-javaagent:{PATH_TO_THE_AGENT_JAR}/applicationinsights-agent-{VERSION_NUMBER}.jar.Restart the app to apply the changes.
Note
If you set the JAVA_OPTS for JavaSE or CATALINA_OPTS for Tomcat environment variable, you will have to disable Application Insights in the portal. Alternatively, if you prefer to enable Application Insights from the portal, make sure that you don't set the JAVA_OPTS for JavaSE or CATALINA_OPTS for Tomcat variable in App Service configurations settings.
Release notes
For the latest updates and bug fixes, consult the release notes.
Next steps
- Monitor Azure Functions with Application Insights.
- Enable Azure diagnostics to be sent to Application Insights.
- Monitor service health metrics to make sure your service is available and responsive.
- Receive alert notifications whenever operational events happen or metrics cross a threshold.
- Use Application Insights for JavaScript apps and web pages to get client telemetry from the browsers that visit a web page.
- Availability overview
Feedback
Coming soon: Throughout 2024 we will be phasing out GitHub Issues as the feedback mechanism for content and replacing it with a new feedback system. For more information see: https://aka.ms/ContentUserFeedback.
Submit and view feedback for