Custom metric collection in .NET and .NET Core
The Azure Monitor Application Insights .NET and .NET Core SDKs have two different methods of collecting custom metrics: TrackMetric() and GetMetric(). The key difference between these two methods is local aggregation. The TrackMetric() method lacks pre-aggregation. The GetMetric() method has pre-aggregation. We recommend that you use aggregation, so TrackMetric() is no longer the preferred method of collecting custom metrics. This article walks you through using the GetMetric() method and some of the rationale behind how it works.
Note
The following documentation relies on the Application Insights classic API. The long-term plan for Application Insights is to collect data using OpenTelemetry. For more information, see Enable Azure Monitor OpenTelemetry for .NET, Node.js, Python and Java applications.
Pre-aggregating vs. non-pre-aggregating API
The TrackMetric() method sends raw telemetry denoting a metric. It's inefficient to send a single telemetry item for each value. The TrackMetric() method is also inefficient in terms of performance because every TrackMetric(item) goes through the full SDK pipeline of telemetry initializers and processors.
Unlike TrackMetric(), GetMetric() handles local pre-aggregation for you and then only submits an aggregated summary metric at a fixed interval of one minute. If you need to closely monitor some custom metric at the second or even millisecond level, you can do so while only incurring the storage and network traffic cost of only monitoring every minute. This behavior also greatly reduces the risk of throttling occurring because the total number of telemetry items that need to be sent for an aggregated metric are greatly reduced.
In Application Insights, custom metrics collected via TrackMetric() and GetMetric() aren't subject to sampling. Sampling important metrics can lead to scenarios where alerting you might have built around those metrics could become unreliable. By never sampling your custom metrics, you can generally be confident that when your alert thresholds are breached, an alert fires. Because custom metrics aren't sampled, there are some potential concerns.
Trend tracking in a metric every second, or at an even more granular interval, can result in:
- Increased data storage costs. There's a cost associated with how much data you send to Azure Monitor. The more data you send, the greater the overall cost of monitoring.
- Increased network traffic or performance overhead. In some scenarios, this overhead could have both a monetary and application performance cost.
- Risk of ingestion throttling. Azure Monitor drops ("throttles") data points when your app sends a high rate of telemetry in a short time interval.
Throttling is a concern because it can lead to missed alerts. The condition to trigger an alert could occur locally and then be dropped at the ingestion endpoint because of too much data being sent. We don't recommend using TrackMetric() for .NET and .NET Core unless you've implemented your own local aggregation logic. If you're trying to track every instance an event occurs over a given time period, you might find that TrackEvent() is a better fit. Keep in mind that unlike custom metrics, custom events are subject to sampling. You can still use TrackMetric() even without writing your own local pre-aggregation. But if you do so, be aware of the pitfalls.
In summary, we recommend GetMetric() because it does pre-aggregation, it accumulates values from all the Track() calls, and sends a summary/aggregate once every minute. The GetMetric() method can significantly reduce the cost and performance overhead by sending fewer data points while still collecting all relevant information.
Note
Only the .NET and .NET Core SDKs have a GetMetric() method. If you're using Java, see Sending custom metrics using micrometer. For JavaScript and Node.js, you would still use TrackMetric(), but keep in mind the caveats that were outlined in the previous section. For Python, you can use OpenCensus.stats to send custom metrics, but the metrics implementation is different.
Get started with GetMetric
For our examples, we're going to use a basic .NET Core 3.1 worker service application. If you want to replicate the test environment used with these examples, follow steps 1-6 in the Monitoring worker service article. These steps add Application Insights to a basic worker service project template. The concepts apply to any general application where the SDK can be used, including web apps and console apps.
Send metrics
Replace the contents of your worker.cs file with the following code:
using System;
using System.Threading;
using System.Threading.Tasks;
using Microsoft.Extensions.Hosting;
using Microsoft.Extensions.Logging;
using Microsoft.ApplicationInsights;

namespace WorkerService3
{
    public class Worker : BackgroundService
    {
        private readonly ILogger<Worker> _logger;
        private TelemetryClient _telemetryClient;

        public Worker(ILogger<Worker> logger, TelemetryClient tc)
        {
            _logger = logger;
            _telemetryClient = tc;
        }

        protected override async Task ExecuteAsync(CancellationToken stoppingToken)
        {   // The following line demonstrates usages of GetMetric API.
            // Here "computersSold", a custom metric name, is being tracked with a value of 42 every second.
            while (!stoppingToken.IsCancellationRequested)
            {
                _telemetryClient.GetMetric("ComputersSold").TrackValue(42);

                _logger.LogInformation("Worker running at: {time}", DateTimeOffset.Now);
                await Task.Delay(1000, stoppingToken);
            }
        }
    }
}
When you run the sample code, you see the while loop repeatedly executing with no telemetry being sent in the Visual Studio output window. A single telemetry item is sent by around the 60-second mark, which in our test looks like:
Application Insights Telemetry: {"name":"Microsoft.ApplicationInsights.Dev.00000000-0000-0000-0000-000000000000.Metric", "time":"2019-12-28T00:54:19.0000000Z",
"ikey":"00000000-0000-0000-0000-000000000000",
"tags":{"ai.application.ver":"1.0.0.0",
"ai.cloud.roleInstance":"Test-Computer-Name",
"ai.internal.sdkVersion":"m-agg2c:2.12.0-21496",
"ai.internal.nodeName":"Test-Computer-Name"},
"data":{"baseType":"MetricData",
"baseData":{"ver":2,"metrics":[{"name":"ComputersSold",
"kind":"Aggregation",
"value":1722,
"count":41,
"min":42,
"max":42,
"stdDev":0}],
"properties":{"_MS.AggregationIntervalMs":"42000",
"DeveloperMode":"true"}}}}
This single telemetry item represents an aggregate of 41 distinct metric measurements. Because we were sending the same value over and over again, we have a standard deviation (stDev) of 0 with identical maximum (max) and minimum (min) values. The value property represents a sum of all the individual values that were aggregated.
Note
The GetMetric method doesn't support tracking the last value (for example, gauge) or tracking histograms or distributions.
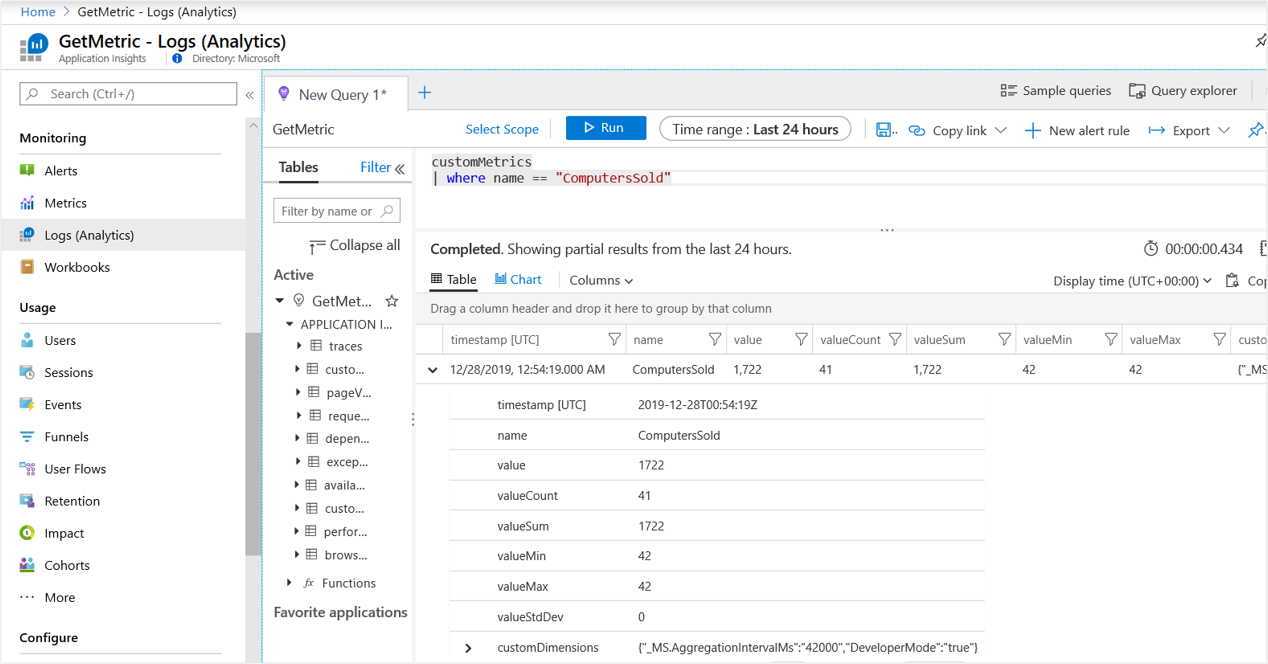
If we examine our Application Insights resource in the Logs (Analytics) experience, the individual telemetry item would look like the following screenshot.
Note
While the raw telemetry item didn't contain an explicit sum property/field once ingested, we create one for you. In this case, both the value and valueSum property represent the same thing.
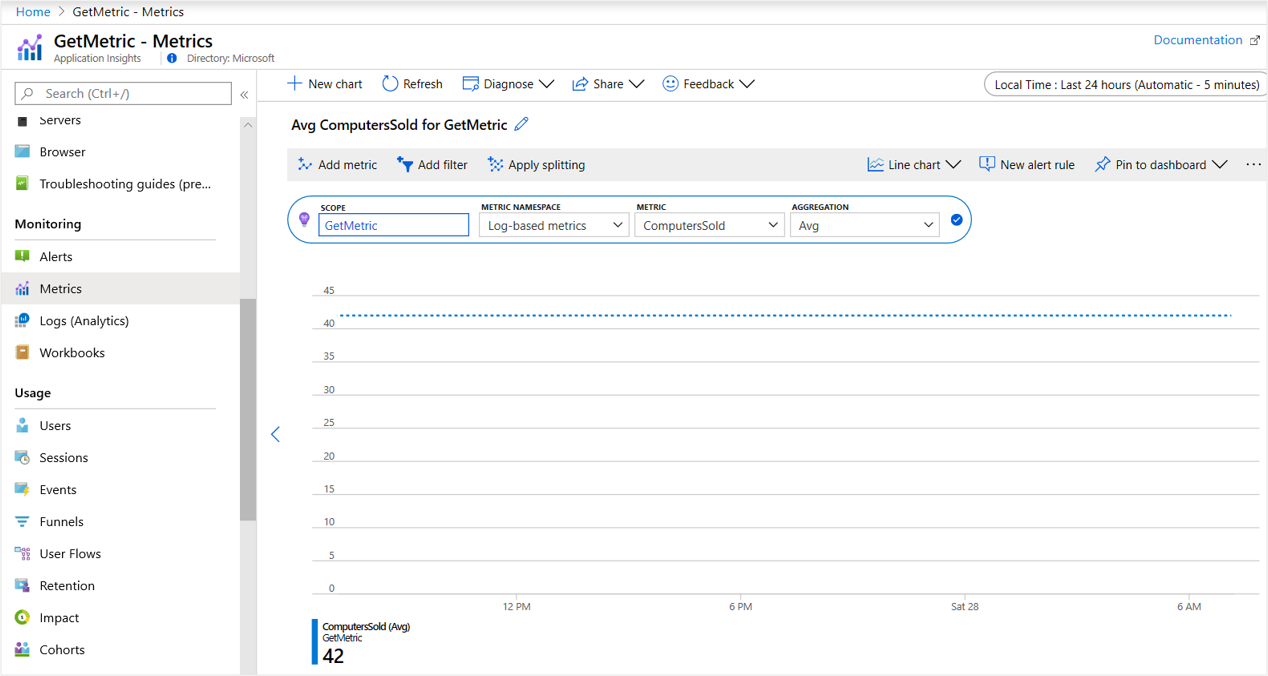
You can also access your custom metric telemetry in the Metrics section of the portal as both a log-based and custom metric. The following screenshot is an example of a log-based metric.
Cache metric reference for high-throughput usage
Metric values might be observed frequently in some cases. For example, a high-throughput service that processes 500 requests per second might want to emit 20 telemetry metrics for each request. The result means tracking 10,000 values per second. In such high-throughput scenarios, users might need to help the SDK by avoiding some lookups.
For example, the preceding example performed a lookup for a handle for the metric ComputersSold and then tracked an observed value of 42. Instead, the handle might be cached for multiple track invocations:
//...

        protected override async Task ExecuteAsync(CancellationToken stoppingToken)
        {
            // This is where the cache is stored to handle faster lookup
            Metric computersSold = _telemetryClient.GetMetric("ComputersSold");
            while (!stoppingToken.IsCancellationRequested)
            {

                computersSold.TrackValue(42);

                computersSold.TrackValue(142);

                _logger.LogInformation("Worker running at: {time}", DateTimeOffset.Now);
                await Task.Delay(50, stoppingToken);
            }
        }
In addition to caching the metric handle, the preceding example also reduced Task.Delay to 50 milliseconds so that the loop would execute more frequently. The result is 772 TrackValue() invocations.
Multidimensional metrics
The examples in the previous section show zero-dimensional metrics. Metrics can also be multidimensional. We currently support up to 10 dimensions.
Here's an example of how to create a one-dimensional metric:
//...

        protected override async Task ExecuteAsync(CancellationToken stoppingToken)
        {
            // This is an example of a metric with a single dimension.
            // FormFactor is the name of the dimension.
            Metric computersSold= _telemetryClient.GetMetric("ComputersSold", "FormFactor");

            while (!stoppingToken.IsCancellationRequested)
            {
                // The number of arguments (dimension values)
                // must match the number of dimensions specified while GetMetric.
                // Laptop, Tablet, etc are values for the dimension "FormFactor"
                computersSold.TrackValue(42, "Laptop");
                computersSold.TrackValue(20, "Tablet");
                computersSold.TrackValue(126, "Desktop");


                _logger.LogInformation("Worker running at: {time}", DateTimeOffset.Now);
                await Task.Delay(50, stoppingToken);
            }
        }
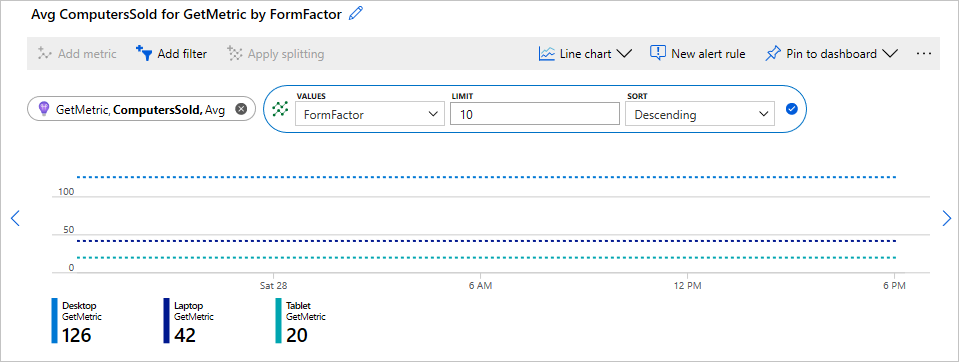
Running the sample code for at least 60 seconds results in three distinct telemetry items being sent to Azure. Each item represents the aggregation of one of the three form factors. As before, you can further examine in the Logs (Analytics) view.
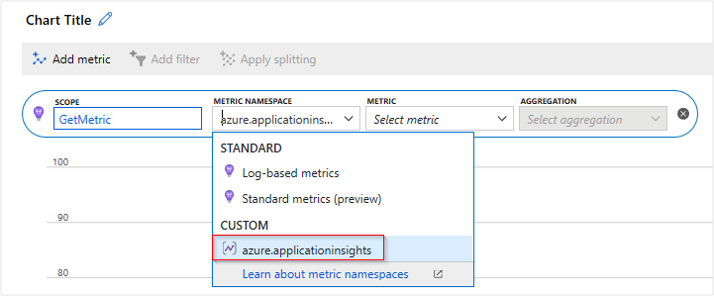
In the metrics explorer:
Notice that you can't split the metric by your new custom dimension or view your custom dimension with the metrics view.
By default, multidimensional metrics within the metric explorer aren't turned on in Application Insights resources.
Enable multidimensional metrics
To enable multidimensional metrics for an Application Insights resource, select Usage and estimated costs > Custom Metrics > Enable alerting on custom metric dimensions > OK. For more information, see Custom metrics dimensions and pre-aggregation.
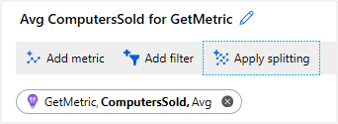
After you've made that change and sent new multidimensional telemetry, you can select Apply splitting.
Note
Only newly sent metrics after the feature was turned on in the portal will have dimensions stored.
View your metric aggregations for each FormFactor dimension.
Use MetricIdentifier when there are more than three dimensions
Currently, 10 dimensions are supported. More than three dimensions requires the use of MetricIdentifier:
// Add "using Microsoft.ApplicationInsights.Metrics;" to use MetricIdentifier
// MetricIdentifier id = new MetricIdentifier("[metricNamespace]","[metricId],"[dim1]","[dim2]","[dim3]","[dim4]","[dim5]");
MetricIdentifier id = new MetricIdentifier("CustomMetricNamespace","ComputerSold", "FormFactor", "GraphicsCard", "MemorySpeed", "BatteryCapacity", "StorageCapacity");
Metric computersSold  = _telemetryClient.GetMetric(id);
computersSold.TrackValue(110,"Laptop", "Nvidia", "DDR4", "39Wh", "1TB");
Custom metric configuration
If you want to alter the metric configuration, you must make alterations in the place where the metric is initialized.
Special dimension names
Metrics don't use the telemetry context of the TelemetryClient used to access them. Using special dimension names available as constants in the MetricDimensionNames class is the best workaround for this limitation.
Metric aggregates sent by the following Special Operation Request Size metric won't have Context.Operation.Name set to Special Operation. The TrackMetric() method or any other TrackXXX() method will have OperationName set correctly to Special Operation.
        //...
        TelemetryClient specialClient;
        private static int GetCurrentRequestSize()
        {
            // Do stuff
            return 1100;
        }
        int requestSize = GetCurrentRequestSize()

        protected override async Task ExecuteAsync(CancellationToken stoppingToken)
        {
            while (!stoppingToken.IsCancellationRequested)
            {
                //...
                specialClient.Context.Operation.Name = "Special Operation";
                specialClient.GetMetric("Special Operation Request Size").TrackValue(requestSize);
                //...
            }

        }
In this circumstance, use the special dimension names listed in the MetricDimensionNames class to specify the TelemetryContext values.
For example, when the metric aggregate resulting from the next statement is sent to the Application Insights cloud endpoint, its Context.Operation.Name data field will be set to Special Operation:
_telemetryClient.GetMetric("Request Size", MetricDimensionNames.TelemetryContext.Operation.Name).TrackValue(requestSize, "Special Operation");
The values of this special dimension will be copied into TelemetryContext and won't be used as a normal dimension. If you want to also keep an operation dimension for normal metric exploration, you need to create a separate dimension for that purpose:
_telemetryClient.GetMetric("Request Size", "Operation Name", MetricDimensionNames.TelemetryContext.Operation.Name).TrackValue(requestSize, "Special Operation", "Special Operation");
Dimension and time-series capping
To prevent the telemetry subsystem from accidentally using up your resources, you can control the maximum number of data series per metric. The default limits are no more than 1,000 total data series per metric, and no more than 100 different values per dimension.
Important
Use low cardinal values for dimensions to avoid throttling.
In the context of dimension and time series capping, we use Metric.TrackValue(..) to make sure that the limits are observed. If the limits are already reached, Metric.TrackValue(..) returns False and the value won't be tracked. Otherwise, it returns True. This behavior is useful if the data for a metric originates from user input.
The MetricConfiguration constructor takes some options on how to manage different series within the respective metric and an object of a class implementing IMetricSeriesConfiguration that specifies aggregation behavior for each individual series of the metric:
var metConfig = new MetricConfiguration(seriesCountLimit: 100, valuesPerDimensionLimit:2,
                new MetricSeriesConfigurationForMeasurement(restrictToUInt32Values: false));

Metric computersSold = _telemetryClient.GetMetric("ComputersSold", "Dimension1", "Dimension2", metConfig);

// Start tracking.
computersSold.TrackValue(100, "Dim1Value1", "Dim2Value1");
computersSold.TrackValue(100, "Dim1Value1", "Dim2Value2");

// The following call gives 3rd unique value for dimension2, which is above the limit of 2.
computersSold.TrackValue(100, "Dim1Value1", "Dim2Value3");
// The above call does not track the metric, and returns false.
seriesCountLimitis the maximum number of data time series a metric can contain. When this limit is reached, calls toTrackValue()that would normally result in a new series returnfalse.valuesPerDimensionLimitlimits the number of distinct values per dimension in a similar manner.restrictToUInt32Valuesdetermines whether or not only non-negative integer values should be tracked.
Here's an example of how to send a message to know if cap limits are exceeded:
if (! computersSold.TrackValue(100, "Dim1Value1", "Dim2Value3"))
{
// Add "using Microsoft.ApplicationInsights.DataContract;" to use SeverityLevel.Error
_telemetryClient.TrackTrace("Metric value not tracked as value of one of the dimension exceeded the cap. Revisit the dimensions to ensure they are within the limits",
SeverityLevel.Error);
}
Next steps
- Metrics - Get - REST API
- Application Insights API for custom events and metrics
- Learn more about monitoring worker service applications.
- Use log-based and pre-aggregated metrics.
- Analyze metrics with metrics explorer.
- Learn how to enable Application Insights for ASP.NET Core applications.
- Learn how to enable Application Insights for ASP.NET applications.
Feedback
Coming soon: Throughout 2024 we will be phasing out GitHub Issues as the feedback mechanism for content and replacing it with a new feedback system. For more information see: https://aka.ms/ContentUserFeedback.
Submit and view feedback for
