Enable Azure Monitor OpenTelemetry for .NET, Node.js, and Python applications (preview)
Article
34 minutes to read
The Azure Monitor OpenTelemetry Exporter is a component that sends traces, and metrics (and eventually all application telemetry) to Azure Monitor Application Insights. To learn more about OpenTelemetry concepts, see the OpenTelemetry overview or OpenTelemetry FAQ.
This article describes how to enable and configure the OpenTelemetry-based Azure Monitor Preview offerings. After you finish the instructions in this article, you'll be able to send OpenTelemetry traces and metrics to Azure Monitor Application Insights.
Important
The Azure Monitor OpenTelemetry-based Offerings for .NET, Node.js, and Python applications are currently in preview.
See the Supplemental Terms of Use for Microsoft Azure Previews for legal terms that apply to Azure features that are in beta, preview, or otherwise not yet released into general availability.
Status supports statuscode(unset,ok,error) and status-description. "Status Description" is ignored by Azure Monitor Exporters.
If you require a full-feature experience, use the existing Application Insights ASP.NET, or ASP.NET Core SDK until the OpenTelemetry-based offering matures.
Consider whether this preview is right for you. It enables distributed tracing, metrics and excludes:
If you get an error like "There are no versions available for the package Azure.Monitor.OpenTelemetry.Exporter," it's probably because the setting of NuGet package sources is missing. Try to specify the source with the -s option:
# Install the latest package with the NuGet package source specified.
dotnet add package --prerelease Azure.Monitor.OpenTelemetry.Exporter -s https://api.nuget.org/v3/index.json
The following code demonstrates how to enable OpenTelemetry in a C# console application by setting up OpenTelemetry TracerProvider. This code must be in the application startup. For ASP.NET Core, it's done typically in the ConfigureServices method of the application Startup class. For ASP.NET applications, it's done typically in Global.asax.cs.
using System.Diagnostics;
using Azure.Monitor.OpenTelemetry.Exporter;
using OpenTelemetry;
using OpenTelemetry.Trace;
public class Program
{
private static readonly ActivitySource MyActivitySource = new ActivitySource(
"OTel.AzureMonitor.Demo");
public static void Main()
{
using var tracerProvider = Sdk.CreateTracerProviderBuilder()
.AddSource("OTel.AzureMonitor.Demo")
.AddAzureMonitorTraceExporter(o =>
{
o.ConnectionString = "<Your Connection String>";
})
.Build();
using (var activity = MyActivitySource.StartActivity("TestActivity"))
{
activity?.SetTag("CustomTag1", "Value1");
activity?.SetTag("CustomTag2", "Value2");
}
System.Console.WriteLine("Press Enter key to exit.");
System.Console.ReadLine();
}
}
Note
The Activity and ActivitySource classes from the System.Diagnostics namespace represent the OpenTelemetry concepts of Span and Tracer, respectively. You create ActivitySource directly by using its constructor instead of by using TracerProvider. Each ActivitySource class must be explicitly connected to TracerProvider by using AddSource(). That's because parts of the OpenTelemetry tracing API are incorporated directly into the .NET runtime. To learn more, see Introduction to OpenTelemetry .NET Tracing API.
The following code demonstrates how to enable OpenTelemetry in a simple JavaScript application:
const { AzureMonitorTraceExporter } = require("@azure/monitor-opentelemetry-exporter");
const { BatchSpanProcessor } = require("@opentelemetry/sdk-trace-base");
const { NodeTracerProvider } = require("@opentelemetry/sdk-trace-node");
const { context, trace } = require("@opentelemetry/api")
const provider = new NodeTracerProvider();
provider.register();
// Create an exporter instance.
const exporter = new AzureMonitorTraceExporter({
connectionString: "<Your Connection String>"
});
// Add the exporter to the provider.
provider.addSpanProcessor(
new BatchSpanProcessor(exporter)
);
// Create a tracer.
const tracer = trace.getTracer("example-basic-tracer-node");
// Create a span. A span must be closed.
const parentSpan = tracer.startSpan("main");
for (let i = 0; i < 10; i += 1) {
doWork(parentSpan);
}
// Be sure to end the span.
parentSpan.end();
function doWork(parent) {
// Start another span. In this example, the main method already started a
// span, so that will be the parent span, and this will be a child span.
const ctx = trace.setSpan(context.active(), parent);
// Set attributes to the span.
// Check the SpanOptions interface for more options that can be set into the span creation
const spanOptions = {
attributes: {
"key": "value"
}
};
const span = tracer.startSpan("doWork", spanOptions, ctx);
// Simulate some random work.
for (let i = 0; i <= Math.floor(Math.random() * 40000000); i += 1) {
// empty
}
// Annotate our span to capture metadata about our operation.
span.addEvent("invoking doWork");
// Mark the end of span execution.
span.end();
}
The following code demonstrates how to enable OpenTelemetry in a simple TypeScript application:
import { AzureMonitorTraceExporter } from "@azure/monitor-opentelemetry-exporter";
import { BatchSpanProcessor} from "@opentelemetry/sdk-trace-base";
import { NodeTracerProvider } from "@opentelemetry/sdk-trace-node";
import { Context, context, Span, SpanOptions, trace, Tracer } from "@opentelemetry/api";
const provider = new NodeTracerProvider();
provider.register();
// Create an exporter instance.
const exporter = new AzureMonitorTraceExporter({
connectionString: "<Your Connection String>"
});
// Add the exporter to the provider.
provider.addSpanProcessor(
new BatchSpanProcessor(exporter)
);
// Create a tracer.
const tracer: Tracer = trace.getTracer("example-basic-tracer-node");
// Create a span. A span must be closed.
const parentSpan: Span = tracer.startSpan("main");
for (let i = 0; i < 10; i += 1) {
doWork(parentSpan);
}
// Be sure to end the span.
parentSpan.end();
function doWork(parent: Span) {
// Start another span. In this example, the main method already started a
// span, so that will be the parent span, and this will be a child span.
const ctx: Context = trace.setSpan(context.active(), parent);
// Set attributes to the span.
// Check the SpanOptions interface for more options that can be set into the span creation
const options: SpanOptions = {
attributes: {
"key": "value"
}
};
// Create a span and attach the span options and parent span context.
const span: Span = tracer.startSpan("doWork", options, ctx);
// Simulate some random work.
for (let i = 0; i <= Math.floor(Math.random() * 40000000); i += 1) {
// empty
}
// Annotate our span to capture metadata about our operation.
span.addEvent("invoking doWork");
// Mark the end of span execution.
span.end();
}
The following code demonstrates how to enable OpenTelemetry in a simple Python application:
import os
from opentelemetry import trace
from opentelemetry.sdk.trace import TracerProvider
from opentelemetry.sdk.trace.export import BatchSpanProcessor
from azure.monitor.opentelemetry.exporter import AzureMonitorTraceExporter
exporter = AzureMonitorTraceExporter(connection_string="<Your Connection String>")
trace.set_tracer_provider(TracerProvider())
tracer = trace.get_tracer(__name__)
span_processor = BatchSpanProcessor(exporter)
trace.get_tracer_provider().add_span_processor(span_processor)
with tracer.start_as_current_span("hello"):
print("Hello, World!")
Replace the placeholder <Your Connection String> in the preceding code with the connection string from your Application Insights resource.
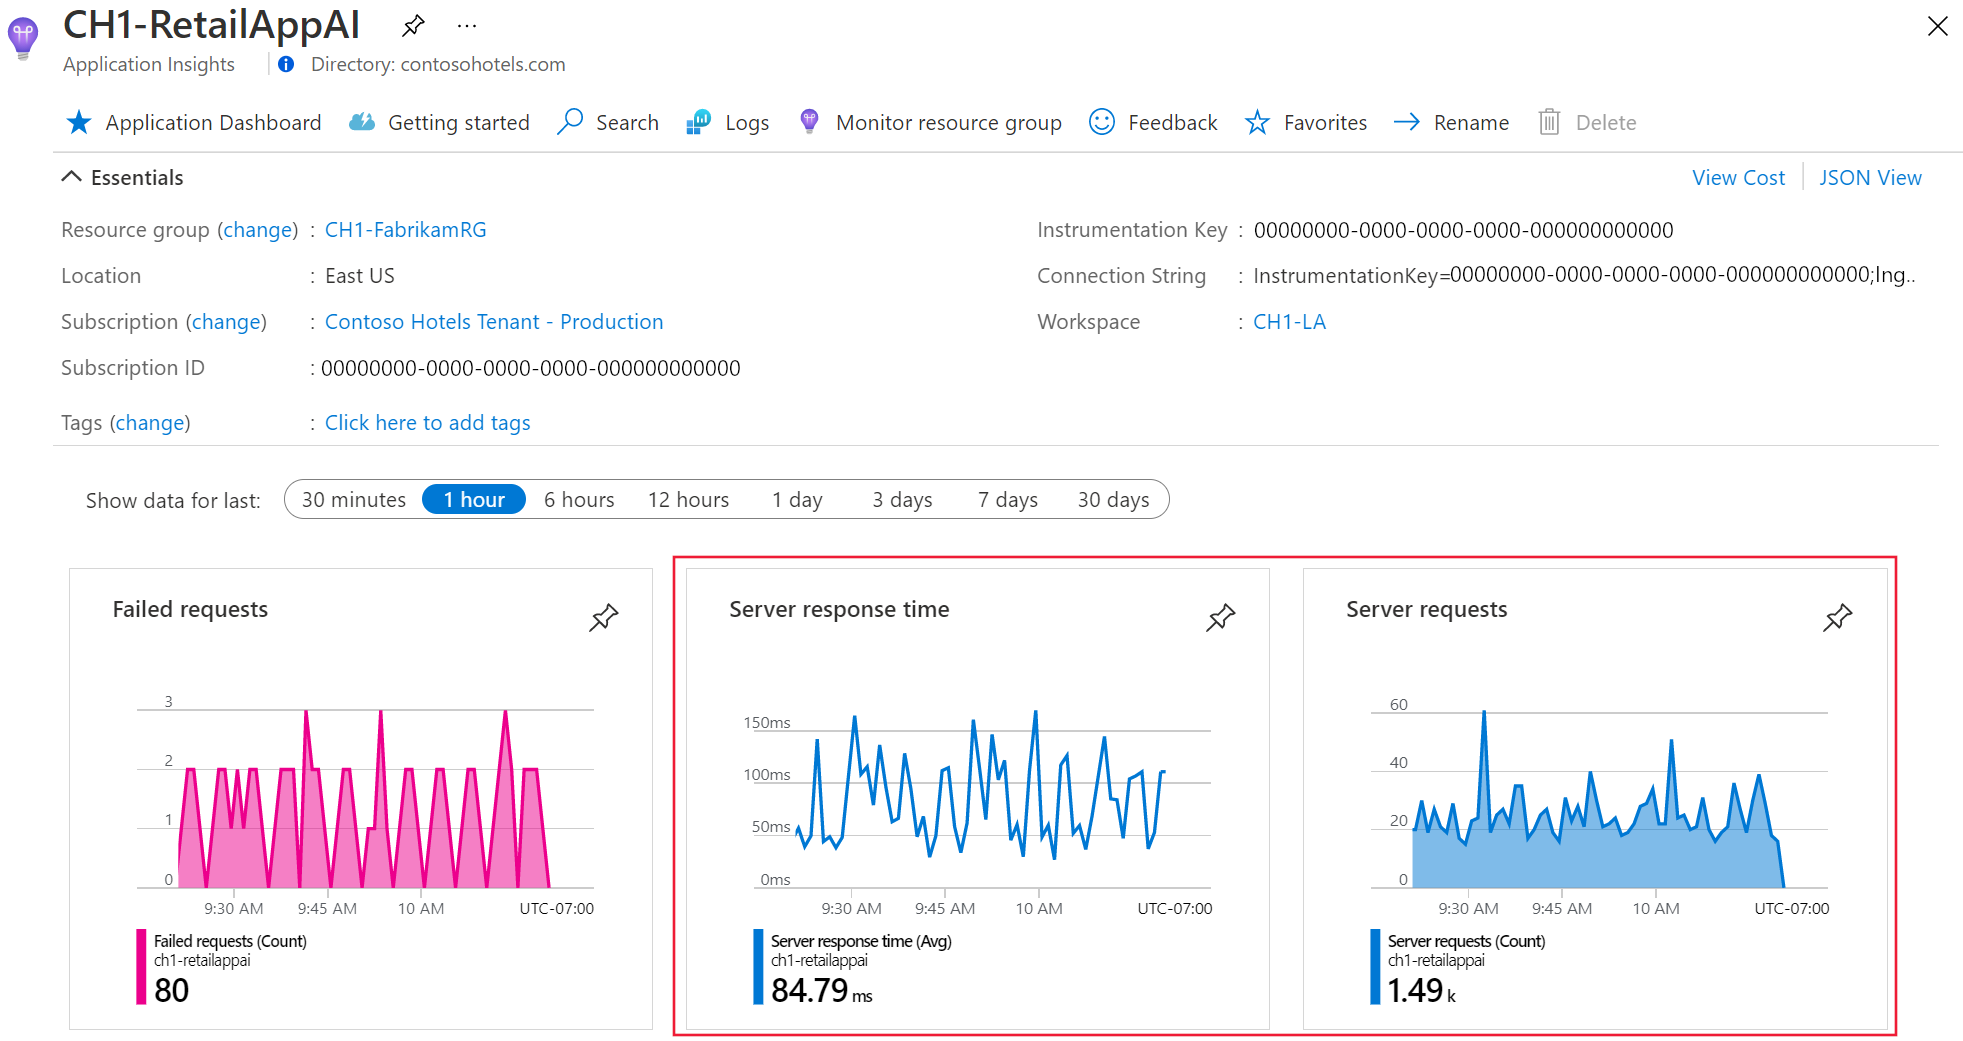
Confirm data is flowing
Run your application and open your Application Insights Resource tab in the Azure portal. It might take a few minutes for data to show up in the portal.
Note
If you can't run the application or you aren't getting data as expected, see Troubleshooting.
Important
If you have two or more services that emit telemetry to the same Application Insights resource, you're required to set Cloud Role Names to represent them properly on the Application Map.
As part of using Application Insights instrumentation, we collect and send diagnostic data to Microsoft. This data helps us run and improve Application Insights. You may disable nonessential data collection. To learn more, see Statsbeat in Azure Application Insights.
Set the Cloud Role Name and the Cloud Role Instance
You might set the Cloud Role Name and the Cloud Role Instance via Resource attributes. This step updates Cloud Role Name and Cloud Role Instance from their default values to something that makes sense to your team. They'll appear on the Application Map as the name underneath a node. Cloud Role Name uses service.namespace and service.name attributes, although it falls back to service.name if service.namespace isn't set. Cloud Role Instance uses the service.instance.id attribute value.
// Setting role name and role instance
var resourceAttributes = new Dictionary<string, object> {
{ "service.name", "my-service" },
{ "service.namespace", "my-namespace" },
{ "service.instance.id", "my-instance" }};
var resourceBuilder = ResourceBuilder.CreateDefault().AddAttributes(resourceAttributes);
// Done setting role name and role instance
// Set ResourceBuilder on the provider.
var tracerProvider = Sdk.CreateTracerProviderBuilder()
.SetResourceBuilder(resourceBuilder)
.AddSource("OTel.AzureMonitor.Demo")
.AddAzureMonitorTraceExporter(o =>
{
o.ConnectionString = "<Your Connection String>";
})
.Build();
...
const { Resource } = require("@opentelemetry/resources");
const { SemanticResourceAttributes } = require("@opentelemetry/semantic-conventions");
const { NodeTracerProvider } = require("@opentelemetry/sdk-trace-node");
const { MeterProvider } = require("@opentelemetry/sdk-metrics")
// ----------------------------------------
// Setting role name and role instance
// ----------------------------------------
const testResource = new Resource({
[SemanticResourceAttributes.SERVICE_NAME]: "my-helloworld-service",
[SemanticResourceAttributes.SERVICE_NAMESPACE]: "my-namespace",
[SemanticResourceAttributes.SERVICE_INSTANCE_ID]: "my-instance",
});
// ----------------------------------------
// Done setting role name and role instance
// ----------------------------------------
const tracerProvider = new NodeTracerProvider({
resource: testResource
});
const meterProvider = new MeterProvider({
resource: testResource
});
import { Resource } from "@opentelemetry/resources";
import { SemanticResourceAttributes } from "@opentelemetry/semantic-conventions";
import { NodeTracerConfig, NodeTracerProvider } from "@opentelemetry/sdk-trace-node";
import { MeterProvider, MeterProviderOptions } from "@opentelemetry/sdk-metrics";
// ----------------------------------------
// Setting role name and role instance
// ----------------------------------------
const testResource = new Resource({
[SemanticResourceAttributes.SERVICE_NAME]: "my-helloworld-service",
[SemanticResourceAttributes.SERVICE_NAMESPACE]: "my-namespace",
[SemanticResourceAttributes.SERVICE_INSTANCE_ID]: "my-instance",
});
const tracerProviderConfig: NodeTracerConfig = {
resource: testResource
};
const meterProviderConfig: MeterProviderOptions = {
resource: testResource
};
// ----------------------------------------
// Done setting role name and role instance
// ----------------------------------------
const tracerProvider = new NodeTracerProvider(tracerProviderConfig);
const meterProvider = new MeterProvider(meterProviderConfig);
...
...
from opentelemetry.sdk.resources import SERVICE_NAME, SERVICE_NAMESPACE, SERVICE_INSTANCE_ID, Resource
trace.set_tracer_provider(
TracerProvider(
resource=Resource.create(
{
SERVICE_NAME: "my-helloworld-service",
# ----------------------------------------
# Setting role name and role instance
# ----------------------------------------
SERVICE_NAMESPACE: "my-namespace",
SERVICE_INSTANCE_ID: "my-instance",
# ----------------------------------------------
# Done setting role name and role instance
# ----------------------------------------------
}
)
)
)
...
You may want to enable sampling to reduce your data ingestion volume, which reduces your cost. Azure Monitor provides a custom fixed-rate sampler that populates events with a "sampling ratio", which Application Insights converts to "ItemCount". The fixed-rate sampler ensures accurate experiences and event counts. The sampler is designed to preserve your traces across services, and it's interoperable with older Application Insights SDKs. The sampler expects a sample rate of between 0 and 1 inclusive. A rate of 0.1 means approximately 10% of your traces will be sent. For more information, see Learn More about sampling.
const { BasicTracerProvider, SimpleSpanProcessor } = require("@opentelemetry/sdk-trace-base");
const { ApplicationInsightsSampler, AzureMonitorTraceExporter } = require("@azure/monitor-opentelemetry-exporter");
// Sampler expects a sample rate of between 0 and 1 inclusive
// A rate of 0.1 means approximately 10% of your traces are sent
const aiSampler = new ApplicationInsightsSampler(0.75);
const provider = new BasicTracerProvider({
sampler: aiSampler
});
const exporter = new AzureMonitorTraceExporter({
connectionString: "<Your Connection String>"
});
provider.addSpanProcessor(new SimpleSpanProcessor(exporter));
provider.register();
import { BasicTracerProvider, SimpleSpanProcessor } from "@opentelemetry/sdk-trace-base";
import { ApplicationInsightsSampler, AzureMonitorTraceExporter } from "@azure/monitor-opentelemetry-exporter";
// Sampler expects a sample rate of between 0 and 1 inclusive
// A rate of 0.1 means approximately 10% of your traces are sent
const aiSampler = new ApplicationInsightsSampler(0.75);
const provider = new BasicTracerProvider({
sampler: aiSampler
});
const exporter = new AzureMonitorTraceExporter({
connectionString: "<Your Connection String>"
});
provider.addSpanProcessor(new SimpleSpanProcessor(exporter));
provider.register();
In this example, we utilize the ApplicationInsightsSampler, which offers compatibility with Application Insights SDKs.
from opentelemetry import trace
from opentelemetry.sdk.trace import TracerProvider
from opentelemetry.sdk.trace.export import BatchSpanProcessor
from azure.monitor.opentelemetry.exporter import (
ApplicationInsightsSampler,
AzureMonitorTraceExporter,
)
# Sampler expects a sample rate of between 0 and 1 inclusive
# 0.1 means approximately 10% of your traces are sent
sampler = ApplicationInsightsSampler(0.1)
trace.set_tracer_provider(TracerProvider(sampler=sampler))
tracer = trace.get_tracer(__name__)
exporter = AzureMonitorTraceExporter(connection_string="<your-connection-string>")
span_processor = BatchSpanProcessor(exporter)
trace.get_tracer_provider().add_span_processor(span_processor)
for i in range(100):
# Approximately 90% of these spans should be sampled out
with tracer.start_as_current_span("hello"):
print("Hello, World!")
Tip
If you're not sure where to set the sampling rate, start at 5% (i.e., 0.05 sampling ratio) and adjust the rate based on the accuracy of the operations shown in the failures and performance panes. A higher rate generally results in higher accuracy. However, ANY sampling will affect accuracy so we recommend alerting on OpenTelemetry metrics, which are unaffected by sampling.
Instrumentation libraries
The following libraries are validated to work with the preview release.
Warning
Instrumentation libraries are based on experimental OpenTelemetry specifications. Microsoft's preview support commitment is to ensure that the following libraries emit data to Azure Monitor Application Insights, but it's possible that breaking changes or experimental mapping will block some data elements.
The OpenTelemetry-based offerings currently emit all metrics as Custom Metrics in Metrics Explorer. Whatever you set as the meter name becomes the metrics namespace.
Modify telemetry
This section explains how to modify telemetry.
Add span attributes
To add span attributes, use either of the following two ways:
These attributes might include adding a custom property to your telemetry. You might also use attributes to set optional fields in the Application Insights schema, like Client IP.
Tip
The advantage of using options provided by instrumentation libraries, when they're available, is that the entire context is available. As a result, users can select to add or filter more attributes. For example, the enrich option in the HttpClient instrumentation library gives users access to the httpRequestMessage itself. They can select anything from it and store it as an attribute.
Add a custom property to a Trace
Any attributes you add to spans are exported as custom properties. They populate the customDimensions field in the requests or the dependencies tables in Application Insights.
Add the processor shown here before the Azure Monitor Exporter.
using var tracerProvider = Sdk.CreateTracerProviderBuilder()
.AddSource("OTel.AzureMonitor.Demo")
.AddProcessor(new ActivityEnrichingProcessor())
.AddAzureMonitorTraceExporter(o =>
{
o.ConnectionString = "<Your Connection String>"
})
.Build();
Add ActivityEnrichingProcessor.cs to your project with the following code:
using System.Diagnostics;
using OpenTelemetry;
using OpenTelemetry.Trace;
public class ActivityEnrichingProcessor : BaseProcessor<Activity>
{
public override void OnEnd(Activity activity)
{
// The updated activity will be available to all processors which are called after this processor.
activity.DisplayName = "Updated-" + activity.DisplayName;
activity.SetTag("CustomDimension1", "Value1");
activity.SetTag("CustomDimension2", "Value2");
}
}
Use a custom processor:
Tip
Add the processor shown here before the Azure Monitor Exporter.
...
from opentelemetry.sdk.trace import TracerProvider
from opentelemetry.sdk.trace.export import BatchSpanProcessor
trace.set_tracer_provider(TracerProvider())
span_processor = BatchSpanProcessor(exporter)
span_enrich_processor = SpanEnrichingProcessor()
trace.get_tracer_provider().add_span_processor(span_enrich_processor)
trace.get_tracer_provider().add_span_processor(span_processor)
...
Add SpanEnrichingProcessor.py to your project with the following code:
from opentelemetry.sdk.trace import SpanProcessor
class SpanEnrichingProcessor(SpanProcessor):
def on_end(self, span):
span._name = "Updated-" + span.name
span._attributes["CustomDimension1"] = "Value1"
span._attributes["CustomDimension2"] = "Value2"
Set the user IP
You can populate the client_IP field for requests by setting the http.client_ip attribute on the span. Application Insights uses the IP address to generate user location attributes and then discards it by default.
using var tracerProvider = Sdk.CreateTracerProviderBuilder()
.AddSource("OTel.AzureMonitor.Demo")
.AddProcessor(new ActivityFilteringProcessor())
.AddAzureMonitorTraceExporter(o =>
{
o.ConnectionString = "<Your Connection String>"
})
.Build();
Add ActivityFilteringProcessor.cs to your project with the following code:
using System.Diagnostics;
using OpenTelemetry;
using OpenTelemetry.Trace;
public class ActivityFilteringProcessor : BaseProcessor<Activity>
{
public override void OnStart(Activity activity)
{
// prevents all exporters from exporting internal activities
if (activity.Kind == ActivityKind.Internal)
{
activity.IsAllDataRequested = false;
}
}
}
If a particular source isn't explicitly added by using AddSource("ActivitySourceName"), then none of the activities created by using that source will be exported.
Exclude the URL option provided by many HTTP instrumentation libraries.
Use a custom processor. You can use a custom span processor to exclude certain spans from being exported. To mark spans to not be exported, set TraceFlag to DEFAULT.
Use the add custom property example, but replace the following lines of code:
import { IncomingMessage } from "http";
import { RequestOptions } from "https";
import { registerInstrumentations } from "@opentelemetry/instrumentation";
import { HttpInstrumentation, HttpInstrumentationConfig } from "@opentelemetry/instrumentation-http";
import { NodeTracerProvider } from "@opentelemetry/sdk-trace-node";
const httpInstrumentationConfig: HttpInstrumentationConfig = {
ignoreIncomingRequestHook: (request: IncomingMessage) => {
// Ignore OPTIONS incoming requests
if (request.method === 'OPTIONS') {
return true;
}
return false;
},
ignoreOutgoingRequestHook: (options: RequestOptions) => {
// Ignore outgoing requests with /test path
if (options.path === '/test') {
return true;
}
return false;
}
};
const httpInstrumentation = new HttpInstrumentation(httpInstrumentationConfig);
const provider = new NodeTracerProvider();
provider.register();
registerInstrumentations({
instrumentations: [
httpInstrumentation,
]
});
Use a custom processor. You can use a custom span processor to exclude certain spans from being exported. To mark spans to not be exported, set TraceFlag to DEFAULT.
Use the add custom property example, but replace the following lines of code:
Exclude the URL option provided by many HTTP instrumentation libraries.
The following example shows how to exclude a certain URL from being tracked by using the Flask instrumentation:
...
import flask
from opentelemetry.instrumentation.flask import FlaskInstrumentor
# You might also populate OTEL_PYTHON_FLASK_EXCLUDED_URLS env variable
# List will consist of comma delimited regexes representing which URLs to exclude
excluded_urls = "client/.*/info,healthcheck"
FlaskInstrumentor().instrument(excluded_urls=excluded_urls) # Do this before flask.Flask
app = flask.Flask(__name__)
...
Use a custom processor. You can use a custom span processor to exclude certain spans from being exported. To mark spans to not be exported, set TraceFlag to DEFAULT.
...
from opentelemetry.sdk.trace import TracerProvider
from opentelemetry.sdk.trace.export import BatchSpanProcessor
trace.set_tracer_provider(TracerProvider())
span_processor = BatchSpanProcessor(exporter)
span_filter_processor = SpanFilteringProcessor()
trace.get_tracer_provider().add_span_processor(span_filter_processor)
trace.get_tracer_provider().add_span_processor(span_processor)
...
Add SpanFilteringProcessor.py to your project with the following code:
from opentelemetry.trace import SpanContext, SpanKind, TraceFlags
from opentelemetry.sdk.trace import SpanProcessor
class SpanFilteringProcessor(SpanProcessor):
# prevents exporting spans from internal activities
def on_start(self, span):
if span._kind is SpanKind.INTERNAL:
span._context = SpanContext(
span.context.trace_id,
span.context.span_id,
span.context.is_remote,
TraceFlags.DEFAULT,
span.context.trace_state,
)
Custom telemetry
This section explains how to collect custom telemetry from your application.
Add Custom Metrics
Note
Custom Metrics are under preview in Azure Monitor Application Insights. Custom metrics without dimensions are available by default. To view and alert on dimensions, you need to opt-in.
The OpenTelemetry API offers six metric "instruments" to cover various metric scenarios and you'll need to pick the correct "Aggregation Type" when visualizing metrics in Metrics Explorer. This requirement is true when using the OpenTelemetry Metric API to send metrics and when using an instrumentation library.
The following table shows the recommended aggregation types for each of the OpenTelemetry Metric Instruments.
OpenTelemetry Instrument
Azure Monitor Aggregation Type
Counter
Sum
Asynchronous Counter
Sum
Histogram
Min, Max, Average, Sum and Count
Asynchronous Gauge
Average
UpDownCounter
Sum
Asynchronous UpDownCounter
Sum
Caution
Aggregation types beyond what's shown in the table typically aren't meaningful.
The OpenTelemetry Specification
describes the instruments and provides examples of when you might use each one.
Tip
The histogram is the most versatile and most closely equivalent to the prior Application Insights Track Metric API. Azure Monitor currently flattens the histogram instrument into our five supported aggregation types, and support for percentiles is underway. Although less versatile, other OpenTelemetry instruments have a lesser impact on your application's performance.
using System.Diagnostics.Metrics;
using Azure.Monitor.OpenTelemetry.Exporter;
using OpenTelemetry;
using OpenTelemetry.Metrics;
public class Program
{
private static readonly Meter meter = new("OTel.AzureMonitor.Demo");
public static void Main()
{
using var meterProvider = Sdk.CreateMeterProviderBuilder()
.AddMeter("OTel.AzureMonitor.Demo")
.AddAzureMonitorMetricExporter(o =>
{
o.ConnectionString = "<Your Connection String>";
})
.Build();
var process = Process.GetCurrentProcess();
ObservableGauge<int> myObservableGauge = meter.CreateObservableGauge("Thread.State", () => GetThreadState(process));
System.Console.WriteLine("Press Enter key to exit.");
System.Console.ReadLine();
}
private static IEnumerable<Measurement<int>> GetThreadState(Process process)
{
foreach (ProcessThread thread in process.Threads)
{
yield return new((int)thread.ThreadState, new("ProcessId", process.Id), new("ThreadId", thread.Id));
}
}
}
const {
MeterProvider,
PeriodicExportingMetricReader
} = require("@opentelemetry/sdk-metrics");
const { AzureMonitorMetricExporter } = require("@azure/monitor-opentelemetry-exporter");
const provider = new MeterProvider();
const exporter = new AzureMonitorMetricExporter({
connectionString:
connectionString: "<Your Connection String>",
});
const metricReader = new PeriodicExportingMetricReader({
exporter: exporter
});
provider.addMetricReader(metricReader);
const meter = provider.getMeter("OTel.AzureMonitor.Demo");
let gauge = meter.createObservableGauge("gauge");
gauge.addCallback((observableResult) => {
let randomNumber = Math.floor(Math.random() * 100);
observableResult.observe(randomNumber, {"testKey": "testValue"});
});
import {
MeterProvider,
PeriodicExportingMetricReader,
PeriodicExportingMetricReaderOptions
} from "@opentelemetry/sdk-metrics";
import { AzureMonitorMetricExporter } from "@azure/monitor-opentelemetry-exporter";
const provider = new MeterProvider();
const exporter = new AzureMonitorMetricExporter({
connectionString: "<Your Connection String>",
});
const metricReaderOptions: PeriodicExportingMetricReaderOptions = {
exporter: exporter,
};
const metricReader = new PeriodicExportingMetricReader(metricReaderOptions);
provider.addMetricReader(metricReader);
const meter = provider.getMeter("OTel.AzureMonitor.Demo");
let gauge = meter.createObservableGauge("gauge");
gauge.addCallback((observableResult: ObservableResult) => {
let randomNumber = Math.floor(Math.random() * 100);
observableResult.observe(randomNumber, {"testKey": "testValue"});
});
from typing import Iterable
from opentelemetry import metrics
from opentelemetry.metrics import CallbackOptions, Observation
from opentelemetry.sdk.metrics import MeterProvider
from opentelemetry.sdk.metrics.export import PeriodicExportingMetricReader
from azure.monitor.opentelemetry.exporter import AzureMonitorMetricExporter
exporter = AzureMonitorMetricExporter(connection_string="<your-connection-string")
reader = PeriodicExportingMetricReader(exporter)
metrics.set_meter_provider(MeterProvider(metric_readers=[reader]))
meter = metrics.get_meter_provider().get_meter("otel_azure_monitor_gauge_demo")
def observable_gauge_generator(options: CallbackOptions) -> Iterable[Observation]:
yield Observation(9, {"test_key": "test_value"})
def observable_gauge_sequence(options: CallbackOptions) -> Iterable[Observation]:
observations = []
for i in range(10):
observations.append(
Observation(9, {"test_key": i})
)
return observations
gauge = meter.create_observable_gauge("gauge", [observable_gauge_generator])
gauge2 = meter.create_observable_gauge("gauge2", [observable_gauge_sequence])
input()
Add Custom Exceptions
Select instrumentation libraries automatically support exceptions to Application Insights.
However, you may want to manually report exceptions beyond what instrumentation libraries report.
For instance, exceptions caught by your code aren't* ordinarily reported. You may wish to report them
to draw attention in relevant experiences including the failures section and end-to-end transaction views.
import * as opentelemetry from "@opentelemetry/api";
import { BasicTracerProvider, SimpleSpanProcessor } from "@opentelemetry/sdk-trace-base";
import { AzureMonitorTraceExporter } from "@azure/monitor-opentelemetry-exporter";
const provider = new BasicTracerProvider();
const exporter = new AzureMonitorTraceExporter({
connectionString: "<Your Connection String>",
});
provider.addSpanProcessor(new SimpleSpanProcessor(exporter as any));
provider.register();
const tracer = opentelemetry.trace.getTracer("example-basic-tracer-node");
let span = tracer.startSpan("hello");
try{
throw new Error("Test Error");
}
catch(error){
span.recordException(error);
}
The OpenTelemetry Python SDK is implemented such that exceptions thrown will automatically be captured and recorded. See below for an example of this.
from opentelemetry import trace
from opentelemetry.sdk.trace import TracerProvider
from opentelemetry.sdk.trace.export import BatchSpanProcessor
from azure.monitor.opentelemetry.exporter import AzureMonitorTraceExporter
exporter = AzureMonitorTraceExporter(connection_string="<your-connection-string>")
trace.set_tracer_provider(TracerProvider())
tracer = trace.get_tracer("otel_azure_monitor_exception_demo")
span_processor = BatchSpanProcessor(exporter)
trace.get_tracer_provider().add_span_processor(span_processor)
# Exception events
try:
with tracer.start_as_current_span("hello") as span:
# This exception will be automatically recorded
raise Exception("Custom exception message.")
except Exception:
print("Exception raised")
If you would like to record exceptions manually, you can disable that option when creating the span as show below.
...
with tracer.start_as_current_span("hello", record_exception=False) as span:
try:
raise Exception("Custom exception message.")
except Exception as ex:
# Manually record exception
span.record_exception(ex)
...
Enable the OTLP Exporter
You might want to enable the OpenTelemetry Protocol (OTLP) Exporter alongside your Azure Monitor Exporter to send your telemetry to two locations.
Note
The OTLP Exporter is shown for convenience only. We don't officially support the OTLP Exporter or any components or third-party experiences downstream of it. We suggest you open an issue with the OpenTelemetry-Collector for OpenTelemetry issues outside the Azure support boundary.
Add the following code snippet. This example assumes you have an OpenTelemetry Collector with an OTLP receiver running. For details, see the example on GitHub.
// Sends data to Application Insights as well as OTLP
using var tracerProvider = Sdk.CreateTracerProviderBuilder()
.AddSource("OTel.AzureMonitor.Demo")
.AddAzureMonitorTraceExporter(o =>
{
o.ConnectionString = "<Your Connection String>"
})
.AddOtlpExporter()
.Build();
Add the following code snippet. This example assumes you have an OpenTelemetry Collector with an OTLP receiver running. For details, see the example on GitHub.
import { BasicTracerProvider, SimpleSpanProcessor } from '@opentelemetry/sdk-trace-base';
import { OTLPTraceExporter } from '@opentelemetry/exporter-otlp-http';
import { AzureMonitorTraceExporter } from '@azure/monitor-opentelemetry-exporter';
const provider = new BasicTracerProvider();
const azureMonitorExporter = new AzureMonitorTraceExporter({
connectionString: "<Your Connection String>",
});
const otlpExporter = new OTLPTraceExporter();
provider.addSpanProcessor(new SimpleSpanProcessor(azureMonitorExporter));
provider.addSpanProcessor(new SimpleSpanProcessor(otlpExporter));
provider.register();
Add the following code snippet. This example assumes you have an OpenTelemetry Collector with an OTLP receiver running. For details, see this README.
from opentelemetry import trace
from opentelemetry.exporter.otlp.proto.grpc.trace_exporter import OTLPSpanExporter
from opentelemetry.sdk.trace import TracerProvider
from opentelemetry.sdk.trace.export import BatchSpanProcessor
from azure.monitor.opentelemetry.exporter import AzureMonitorTraceExporter
trace.set_tracer_provider(TracerProvider())
tracer = trace.get_tracer(__name__)
exporter = AzureMonitorTraceExporter(connection_string="<your-connection-string>")
otlp_exporter = OTLPSpanExporter(endpoint="http://localhost:4317")
span_processor = BatchSpanProcessor(otlp_exporter)
trace.get_tracer_provider().add_span_processor(span_processor)
with tracer.start_as_current_span("test"):
print("Hello world!")
Configuration
Offline Storage and Automatic Retries
To improve reliability and resiliency, Azure Monitor OpenTelemetry-based offerings write to offline/local storage by default when an application loses its connection with Application Insights. It saves the application telemetry for 48 hours and periodically tries to send it again. In addition to exceeding the allowable time, telemetry will occasionally be dropped in high-load applications when the maximum file size is exceeded or the SDK doesn't have an opportunity to clear out the file. If we need to choose, the product will save more recent events over old ones. In some cases, you may wish to disable this feature to optimize application performance. Learn More
The Azure Monitor Exporter uses EventSource for its own internal logging. The exporter logs are available to any EventListener by opting into the source named OpenTelemetry-AzureMonitor-Exporter. For troubleshooting steps, see OpenTelemetry Troubleshooting.
Azure Monitor Exporter uses the OpenTelemetry API Logger for internal logs. To enable it, use the following code:
import { diag, DiagConsoleLogger, DiagLogLevel } from "@opentelemetry/api";
import { NodeTracerProvider } from "@opentelemetry/sdk-trace-node";
const provider = new NodeTracerProvider();
diag.setLogger(new DiagConsoleLogger(), DiagLogLevel.ALL);
provider.register();
The Azure Monitor Exporter uses the Python standard logging library for its own internal logging. OpenTelemetry API and Azure Monitor Exporter logs are logged at the severity level of WARNING or ERROR for irregular activity. The INFO severity level is used for regular or successful activity. By default, the Python logging library sets the severity level to WARNING, so you must change the severity level to see logs under this severity setting. The following example shows how to output logs of all severity levels to the console and a file:
Known issues for the Azure Monitor OpenTelemetry Exporters include:
Operation name is missing on dependency telemetry, which adversely affects failures and performance tab experience.
Device model is missing on request and dependency telemetry, which adversely affects device cohort analysis.
Database server name is left out of dependency name, which incorrectly aggregates tables with the same name on different servers.
Test connectivity between your application host and the ingestion service
Application Insights SDKs and agents send telemetry to get ingested as REST calls to our ingestion endpoints. You can test connectivity from your web server or application host machine to the ingestion service endpoints by using raw REST clients from PowerShell or curl commands. See Troubleshoot missing application telemetry in Azure Monitor Application Insights.