Capture Application Insights custom metrics with .NET and .NET Core
In this article, you'll learn how to capture custom metrics with Application Insights in .NET and .NET Core apps.
Insert a few lines of code in your application to find out what users are doing with it or to help diagnose issues. You can send telemetry from device and desktop apps, web clients, and web servers. Use the Application Insights core telemetry API to send custom events and metrics and your own versions of standard telemetry. This API is the same API that the standard Application Insights data collectors use.
ASP.NET Core applications
Prerequisites
To complete this tutorial, you need:
- Visual Studio 2022
- The following Visual Studio Workloads:
- ASP.NET and web development
- Data storage and processing
- Azure development
- .NET 6.0
- Azure subscription and user account (with the ability to create and delete resources)
- The completed sample application deployed or an existing ASP.NET Core application with the Application Insights for ASP.NET Core NuGet package installed and configured to gather server-side telemetry.
Custom metrics overview
The Application Insights .NET and .NET Core SDKs have two different methods for collecting custom metrics, which are TrackMetric(), and GetMetric(). The key difference between these two methods is local aggregation. TrackMetric() lacks pre-aggregation while GetMetric() has pre-aggregation. The recommended approach is to use aggregation. Therefore, TrackMetric() is no longer the preferred method for collecting custom metrics. This article will walk you through using the GetMetric() method, and some of the rationale behind how it works.
Pre-aggregating vs non pre-aggregating API
TrackMetric() sends raw telemetry that denotes a metric. TrackMetric() is inefficient because it sends a single telemetry item for each value. TrackMetric() is also inefficient in terms of performance because every TrackMetric(item) goes through the full SDK pipeline of telemetry initializers and processors.
Unlike TrackMetric(), GetMetric() handles local pre-aggregation for you and then only submits an aggregated summary metric at a fixed interval of one minute. If you need to closely monitor some custom metric at the second or even millisecond level, you can use GetMetric() to do so while only incurring the storage and network traffic cost of only monitoring every minute. This behavior also greatly reduces the risk of throttling occurring because the total number of telemetry items that need to be sent for an aggregated metric are greatly reduced.
In Application Insights, custom metrics collected via TrackMetric() and GetMetric() aren't subject to sampling. Sampling important metrics can lead to scenarios where the alerting you may have built around these metrics could become unreliable. By never sampling your custom metrics, you can generally be confident that when your alert thresholds are breached, an alert will fire. Because custom metrics aren't sampled, there are some potential concerns, which are described below.
Trend tracking in a metric every second or at a more granular interval can result in:
- Increased data storage costs. There's a cost associated with how much data you send to Azure Monitor. (The more data you send the greater the overall cost of monitoring.)
- Increased network traffic/performance overhead. (In some scenarios, this overhead could have both a monetary and application performance cost.)
- Risk of ingestion throttling. (The Azure Monitor service drops ("throttles") data points when your app sends a high rate of telemetry in a short time interval.)
Throttling is a concern because it can lead to missed alerts. The condition to trigger an alert could occur locally and then be dropped at the ingestion endpoint due to too much data being sent. We don't recommend using TrackMetric() for .NET and .NET Core unless you've implemented your own local aggregation logic. If you're trying to track every instance when an event occurs over a given time period, you may find that TrackEvent() is a better fit. Keep in mind that unlike custom metrics, custom events are subject to sampling. You can still use TrackMetric() even without writing your own local pre-aggregation, but be aware of the pitfalls if you do so.
In summary, GetMetric() is the recommended approach because it does pre-aggregation, accumulates values from all the Track() calls, and sends a summary/aggregate once every minute. GetMetric() can significantly reduce the cost and performance overhead by sending fewer data points, while still collecting all of the relevant information.
Getting a TelemetryClient instance
Get an instance of TelemetryClient from the dependency injection container in HomeController.cs:
//... additional code removed for brevity
using Microsoft.ApplicationInsights;

namespace AzureCafe.Controllers
{
    public class HomeController : Controller
    {
        private readonly ILogger<HomeController> _logger;
        private AzureCafeContext _cafeContext;
        private BlobContainerClient _blobContainerClient;
        private TextAnalyticsClient _textAnalyticsClient;
        private TelemetryClient _telemetryClient;

        public HomeController(ILogger<HomeController> logger, AzureCafeContext context, BlobContainerClient blobContainerClient, TextAnalyticsClient textAnalyticsClient, TelemetryClient telemetryClient)
        {
            _logger = logger;
            _cafeContext = context;
            _blobContainerClient = blobContainerClient;
            _textAnalyticsClient = textAnalyticsClient;
            _telemetryClient = telemetryClient;
        }

        //... additional code removed for brevity
    }
}
TelemetryClient is thread safe.
TrackMetric
Application Insights can chart metrics that aren't attached to particular events. For example, you could monitor a queue length at regular intervals. With metrics, the individual measurements are of less interest than the variations and trends, so statistical charts are useful.
To send metrics to Application Insights, you can use the TrackMetric(..) API.
Aggregation
Aggregation is the recommended way to send a metric.
When you work with metrics, every single measurement is rarely of interest. Instead, a summary of what happened during a particular time period is important. Such a summary is called aggregation.
For example, the aggregate metric sum for that time period is 1 and the count of the metric values is 2. When you use the aggregation approach, you invoke TrackMetric only once per time period and send the aggregate values. We recommend this approach because it can significantly reduce the cost and performance overhead by sending fewer data points to Application Insights, while still collecting all of the relevant information.
TrackMetric example
From the Visual Studio Solution Explorer, locate and open the HomeController.cs file.
Locate the
CreateReviewmethod and the following code.if (model.Comments != null) { var response = _textAnalyticsClient.AnalyzeSentiment(model.Comments); review.CommentsSentiment = response.Value.Sentiment.ToString(); }To add a custom metric, insert the following code immediately after the previous code.
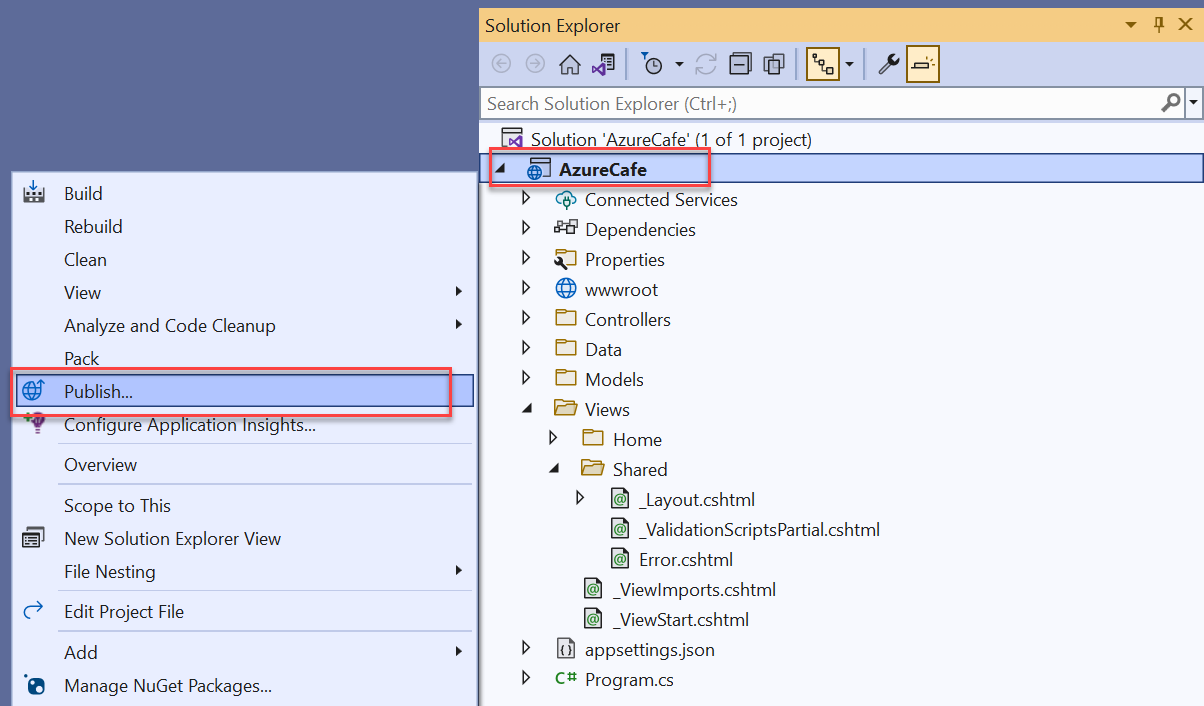
_telemetryClient.TrackMetric("ReviewPerformed", model.Rating);Right-click on the AzureCafe project in Solution Explorer and select Publish from the context menu.
To promote the new code to the Azure App Service, select Publish.
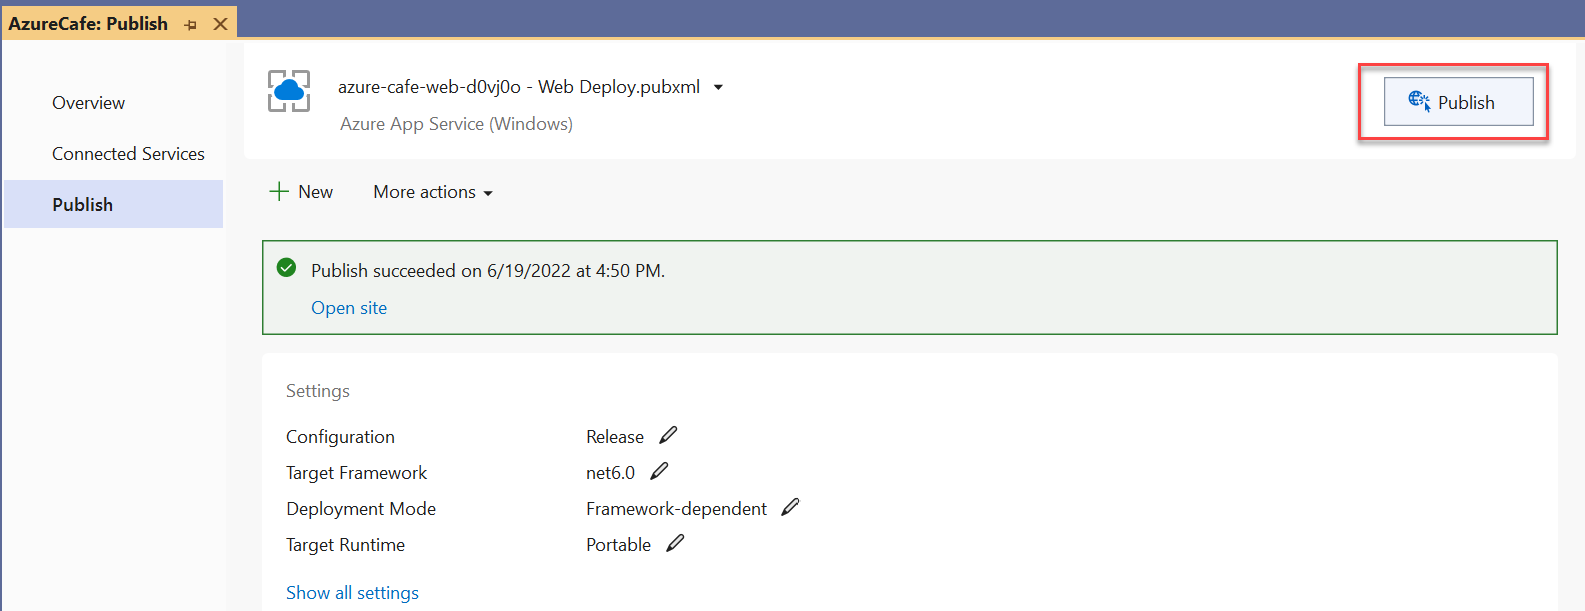
When the Azure Cafe web application is successfully published, a new browser window opens to the Azure Cafe web application.
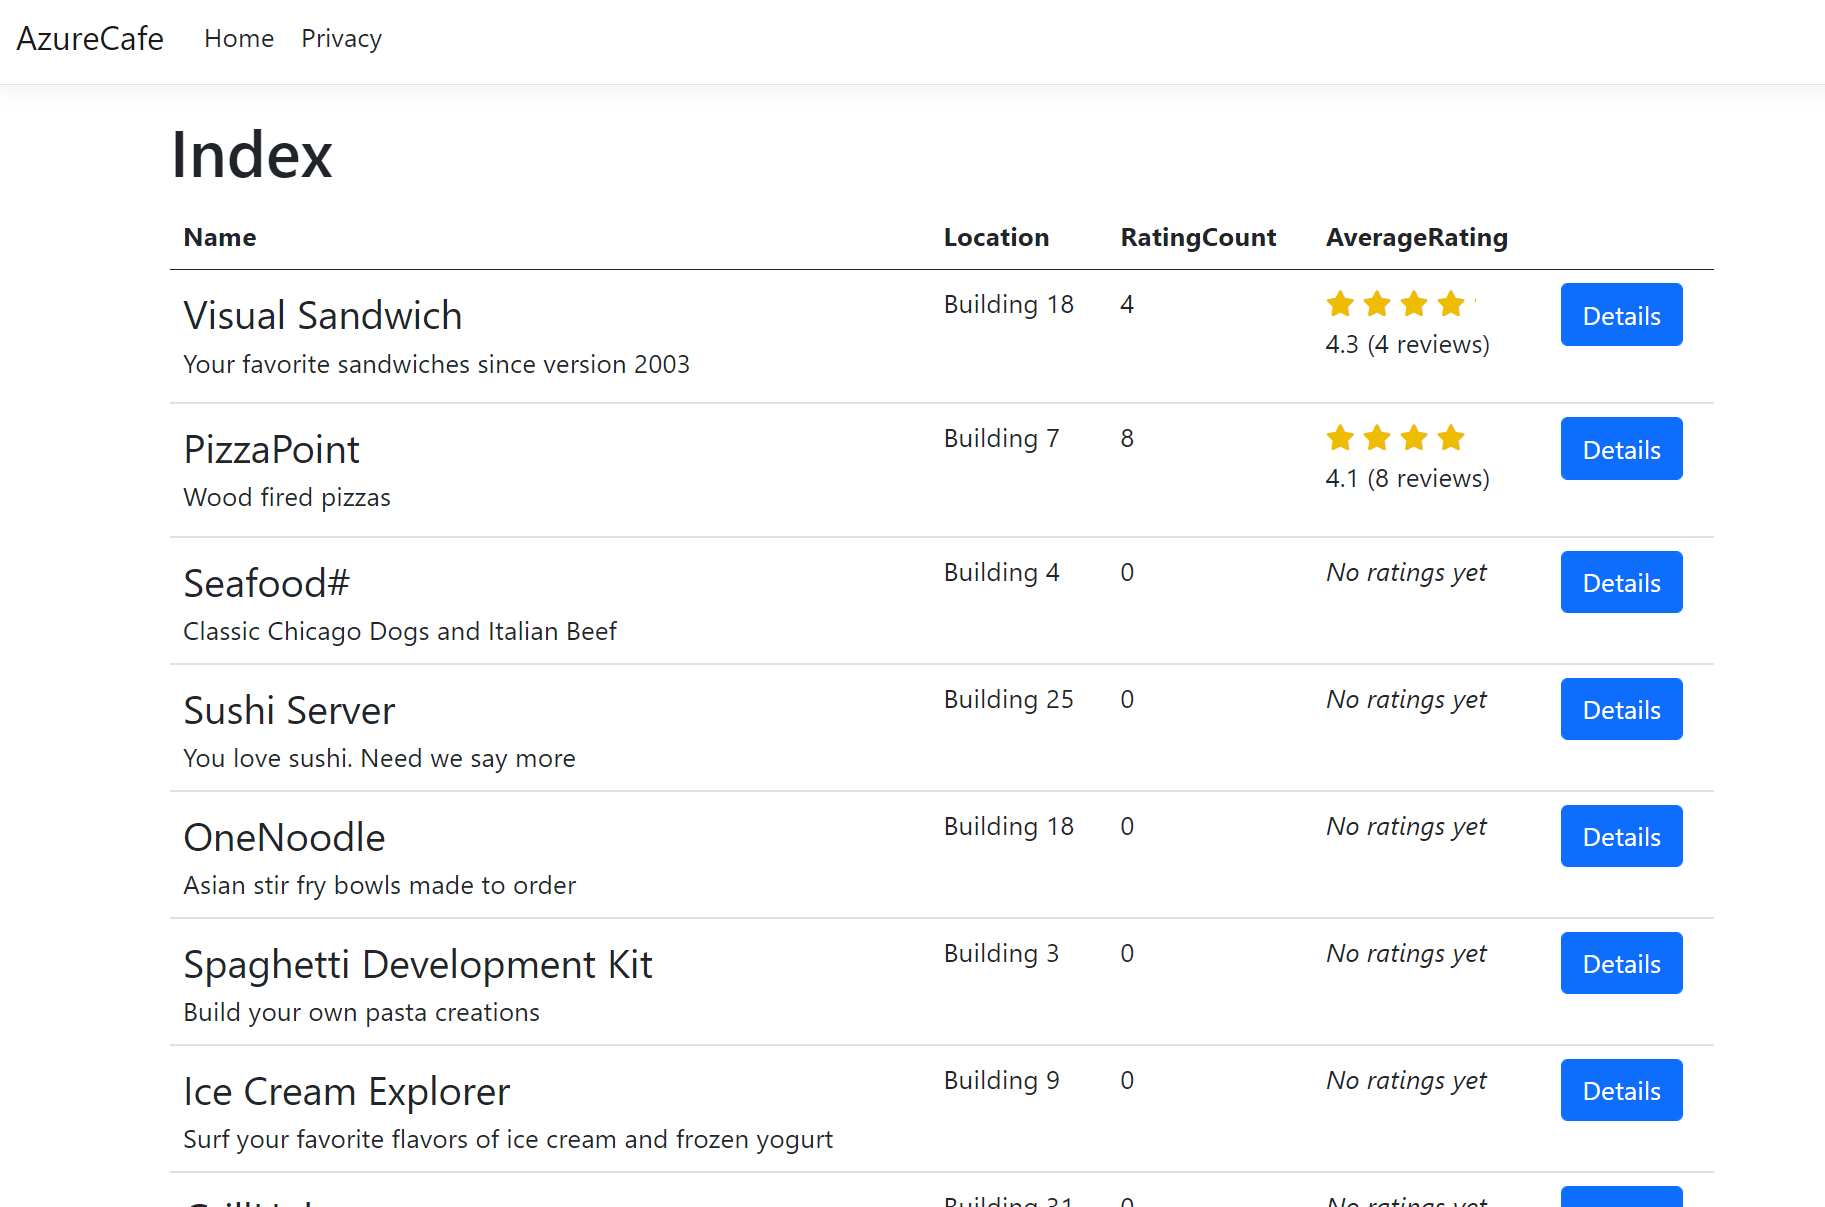
To generate some telemetry, follow these steps in the web application to add a review.
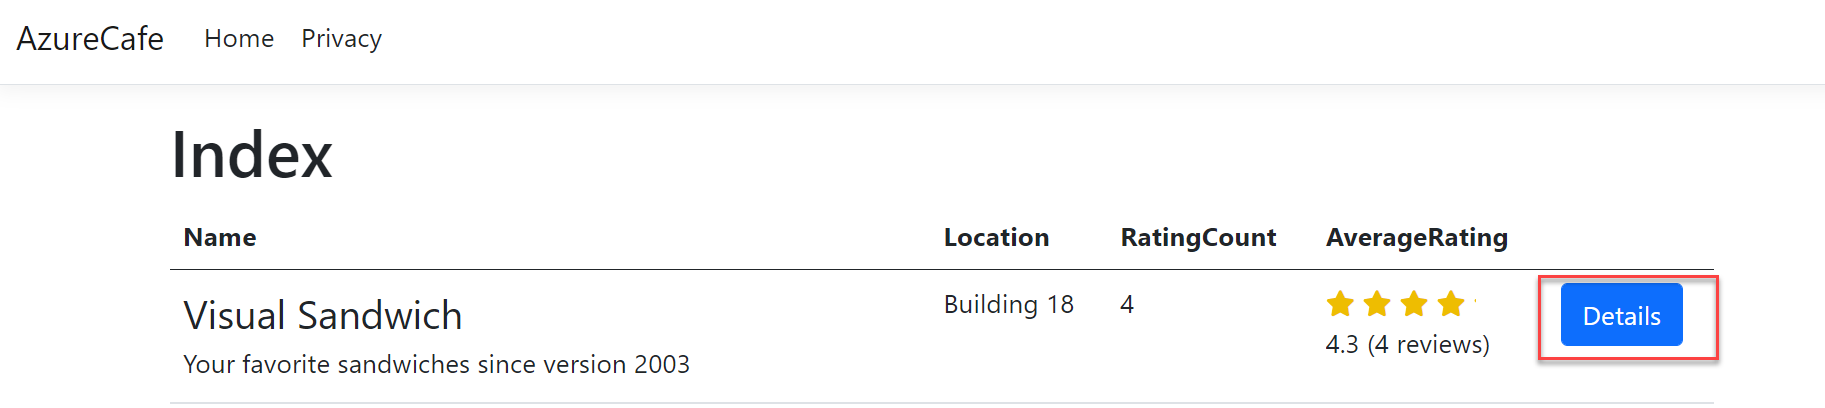
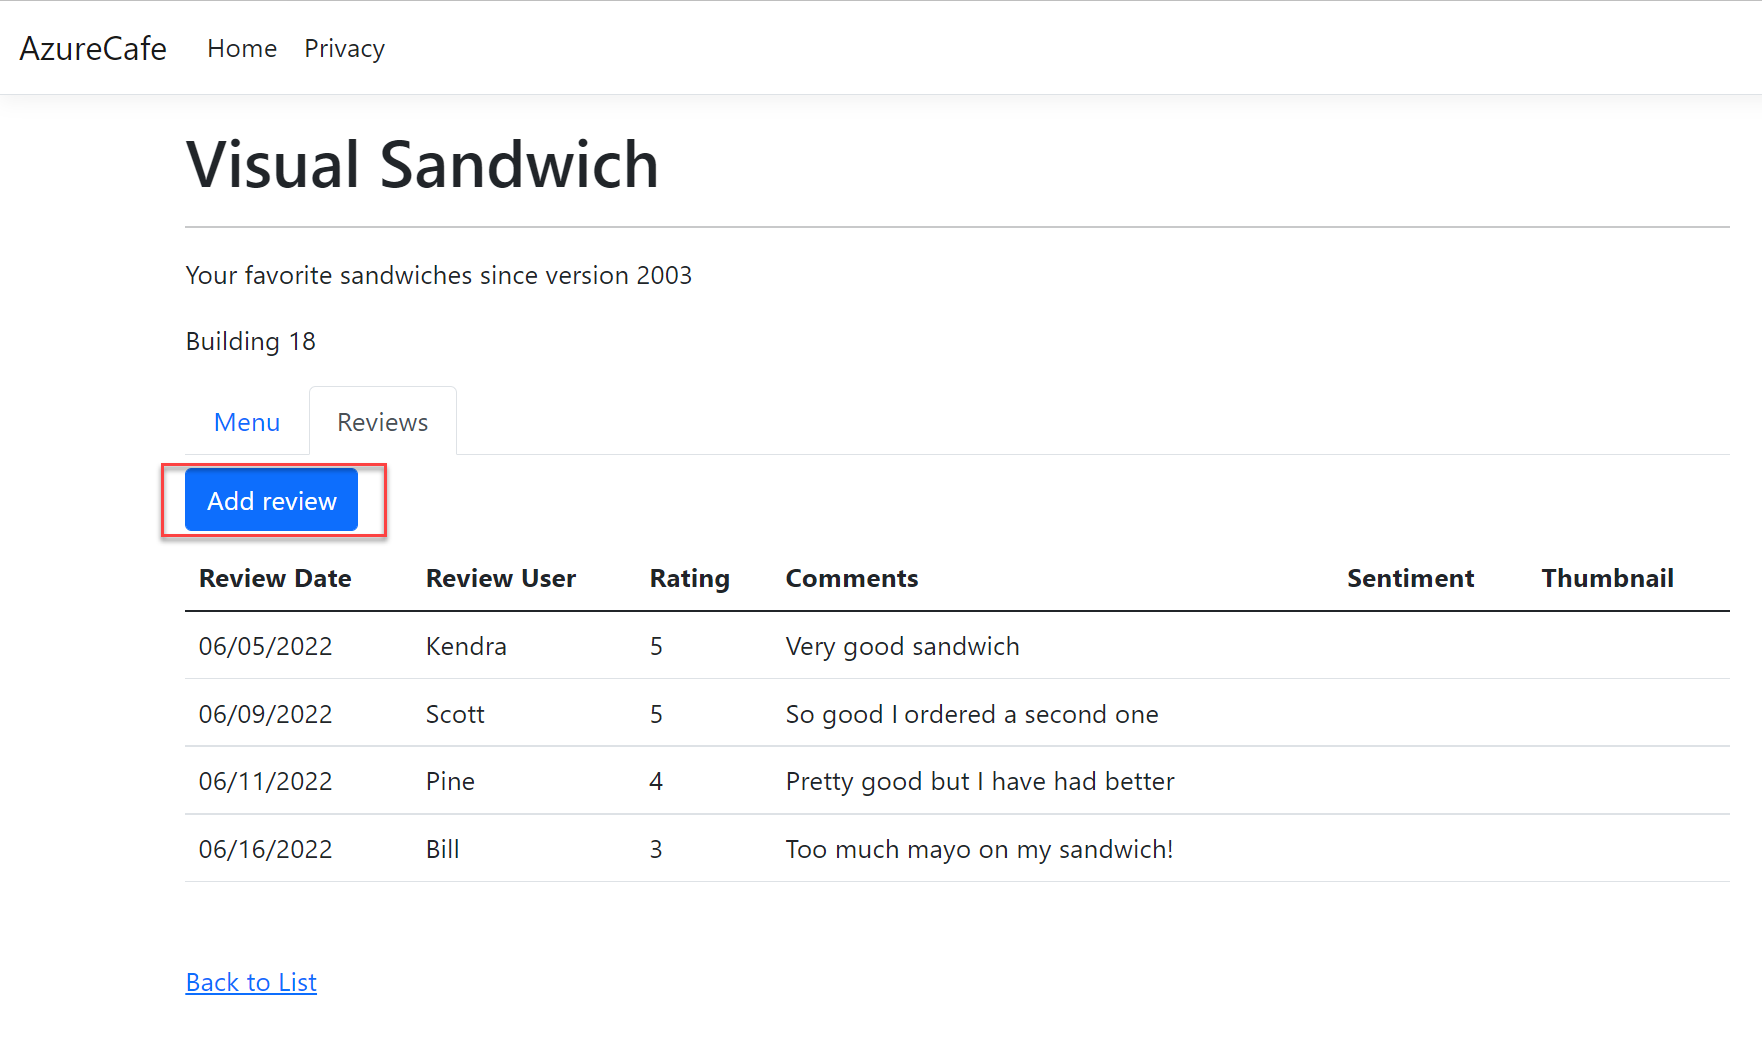
To view a cafe's menu and reviews, select Details next to a cafe.
To view and add reviews, on the Cafe screen, select the Reviews tab. Select the Add review button to add a review.
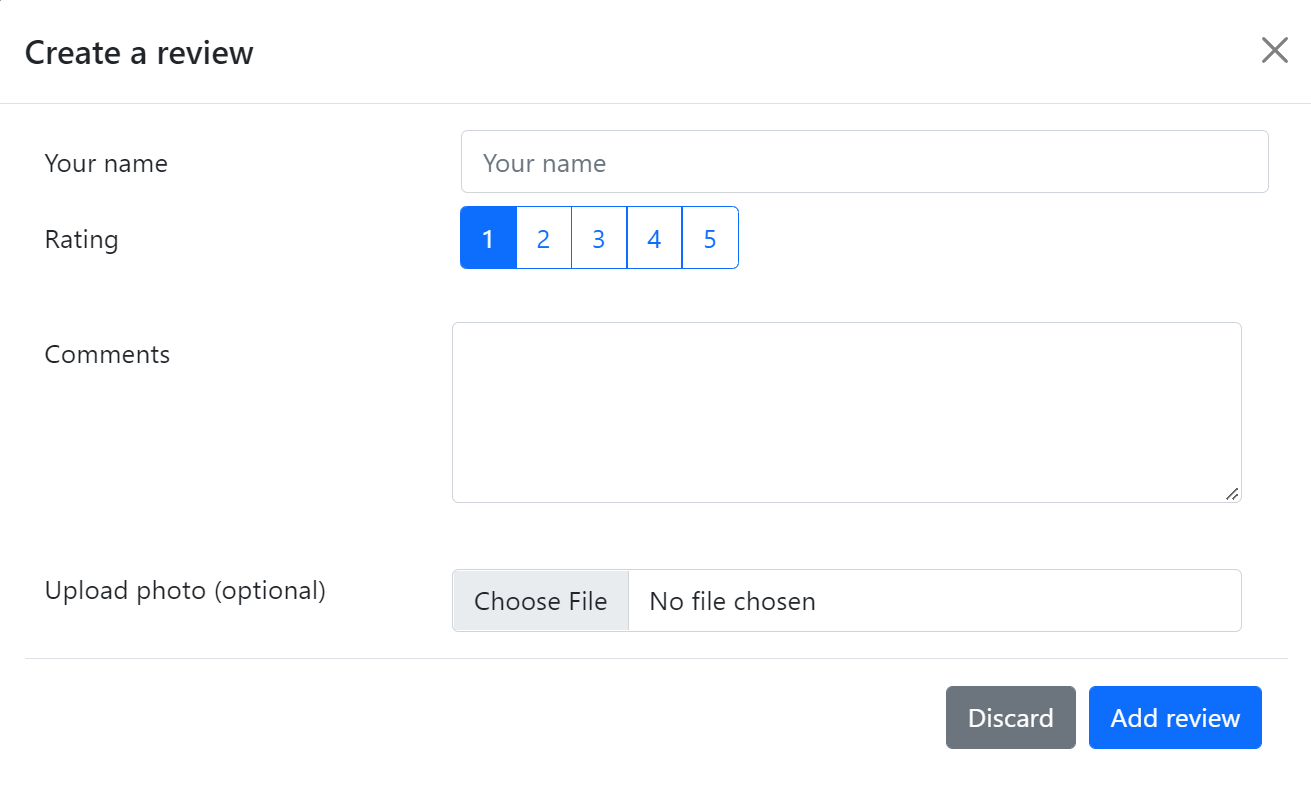
On the Create a review dialog, enter a name, rating, comments, and upload a photo for the review. When finished, select Add review.
If you need to generate additional telemetry, add additional reviews.


View metrics in Application Insights
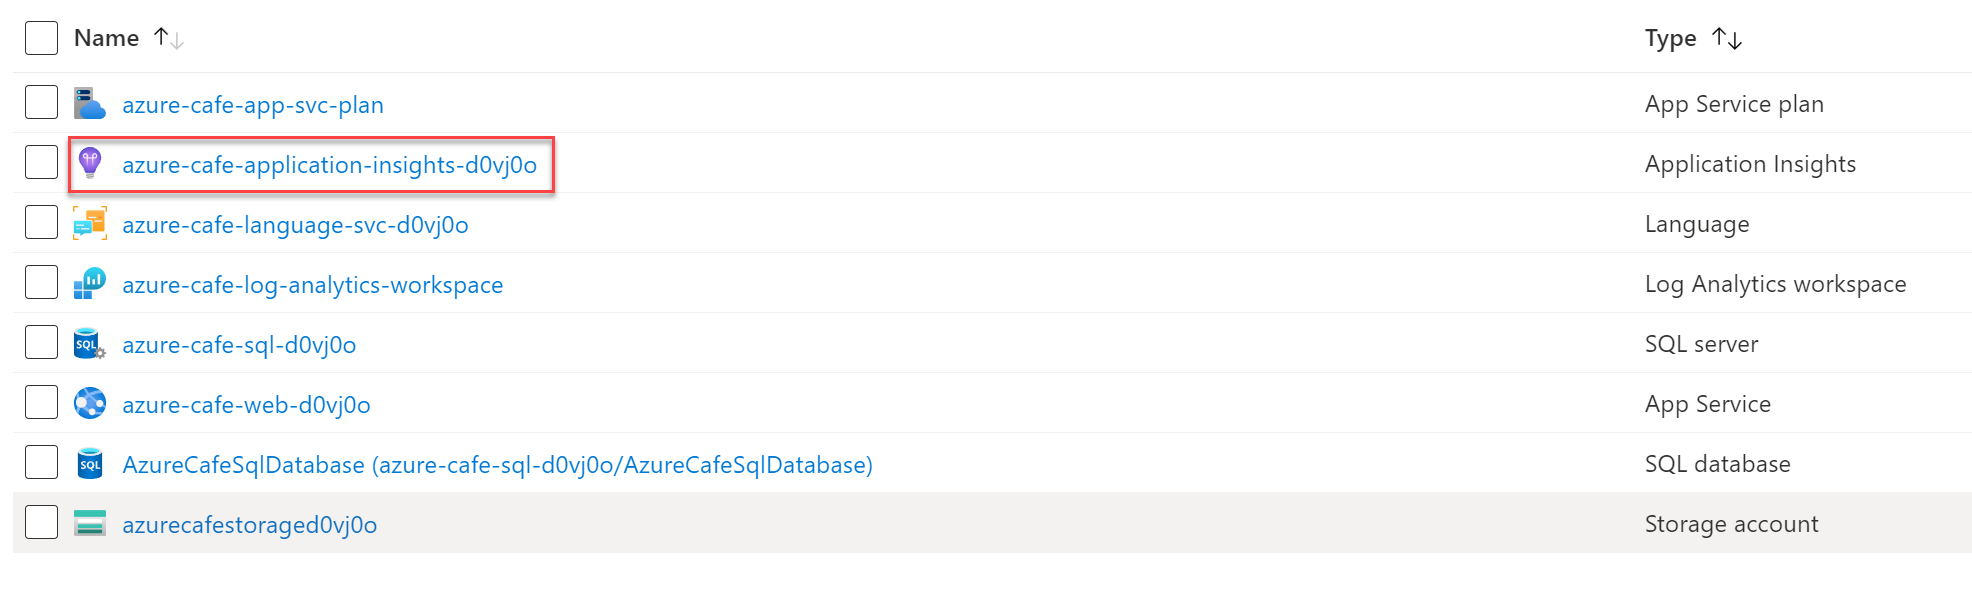
In the Azure portal, select the Application Insights resource.
From the left menu of the Application Insights resource, under the Monitoring section, select Logs.
In the Tables pane, under the Application Insights tree, double-click on the customMetrics table.
Modify the query to retrieve metrics for the ReviewPerformed custom named metric as follows:
customMetrics
| where name == "ReviewPerformed"
Select Run to filter the results.
The results display the rating value present in your review.

GetMetric
As mentioned before, GetMetric(..) is the preferred method for sending metrics. In order to make use of this method, we'll be performing some changes to the existing code from the TrackMetric example.
When running the sample code, you'll see that no telemetry is being sent from the application right away. A single telemetry item will be sent by around the 60-second mark.
Note
GetMetric does not support tracking the last value (i.e. "gauge") or histograms/distributions.
GetMetric example
From the Visual Studio Solution Explorer, locate and open the HomeController.cs file.
Locate the
CreateReviewmethod and the code you added in the previous TrackMetric example.Replace the code you inserted in the previous TrackMetric example with the following code.
var metric = _telemetryClient.GetMetric("ReviewPerformed");
metric.TrackValue(model.Rating);
Right-click the AzureCafe project in Solution Explorer and select Publish from the context menu.
To promote the new code to the Azure App Service, select Publish.
When the Azure Cafe web application is successfully published, a new browser window opens to the Azure Cafe web application.
To generate some telemetry, follow these steps in the web application to add a review.
To view a cafe's menu and reviews, select Details next to a cafe.
To view and add reviews, on the Cafe screen, select the Reviews tab. Select the Add review button to add a review.
On the Create a review dialog, enter a name, rating, comments, and upload a photo for the review. When finished, select Add review.
If you need to generate additional telemetry, add additional reviews.
View metrics in Application Insights
In the Azure portal, select the Application Insights resource.
From the left menu of the Application Insights resource, under the Monitoring section, select Logs.
In the Tables pane, under the Application Insights tree, double-click on the customMetrics table.
Modify the query to retrieve metrics for the ReviewPerformed custom named metric as follows:
customMetrics
| where name == "ReviewPerformed"
Select Run to filter the results.
The results display the rating value present in your review.
Multi-dimensional metrics
The examples in the previous section show zero-dimensional metrics. Metrics can also be multi-dimensional. We currently support up to 10 dimensions.
By default, multi-dimensional metrics within the Metric explorer experience aren't turned on in Application Insights resources.
Note
This is a preview feature and additional billing may apply in the future.
Enable multi-dimensional metrics
This section walks through enabling multi-dimensional metrics for an Application Insights resource.
- In the Azure portal, select the Application Insights resource.
- Select Usage and estimated costs.
- Select Custom Metrics.
- Select Send custom metrics to Azure Metric Store (With dimensions).
- Select OK.
After you enable multi-dimensional metrics for an Application Insights resource and send new multi-dimensional telemetry, you can split a metric by dimension.
Note
Only metrics that are sent after the feature is turned on in the portal will have dimensions stored.
Multi-dimensional metrics example
From the Visual Studio Solution Explorer, locate and open the HomeController.cs file.
Locate the
CreateReviewmethod and the code added in the previous GetMetric example.Replace the code you inserted in the previous GetMetric example with the following code.
var metric = _telemetryClient.GetMetric("ReviewPerformed", "IncludesPhoto");In the
CreateReviewmethod, change the code to match the following code.[HttpPost] [ValidateAntiForgeryToken] public ActionResult CreateReview(int id, CreateReviewModel model) { //... additional code removed for brevity var metric = _telemetryClient.GetMetric("ReviewPerformed", "IncludesPhoto"); if ( model.ReviewPhoto != null ) { using (Stream stream = model.ReviewPhoto.OpenReadStream()) { //... additional code removed for brevity } metric.TrackValue(model.Rating, bool.TrueString); } else { metric.TrackValue(model.Rating, bool.FalseString); } //... additional code removed for brevity }Right-click the on AzureCafe project in Solution Explorer and select Publish from the context menu.
To promote the new code to the Azure App Service, select Publish.
When the Azure Cafe web application is successfully published, a new browser window opens to the Azure Cafe web application.
To generate some telemetry, follow these steps in the web application to add a review.
To view a cafe's menu and reviews, select Details next to a cafe.
To view and add reviews, on the Cafe screen, select the Reviews tab. Select the Add review button to add a review.
On the Create a review dialog, enter a name, rating, comments, and upload a photo for the review. When finished, select Add review.
If you need to generate additional telemetry, add additional reviews.
View logs in Application Insights
In the Azure portal, select the Application Insights resource.
From the left menu of the Application Insights resource, under the Monitoring section, select Logs.
In the Tables pane, under the Application Insights tree, double-click on the customMetrics table.
Modify the query to retrieve metrics for the ReviewPerformed custom named metric as follows:
customMetrics
| where name == "ReviewPerformed"
Select Run to filter the results.
The results display the rating value present in your review and the aggregated values.
To extract the IncludesPhoto dimension into a separate variable (column) to better observe the dimension, use the following query.
customMetrics
| extend IncludesPhoto = tobool(customDimensions.IncludesPhoto)
| where name == "ReviewPerformed"
Because we reused the same custom metric name as before, results with and without the custom dimension will be displayed.
To only display results with the custom dimension, update the query to match the following query.
customMetrics
| extend IncludesPhoto = tobool(customDimensions.IncludesPhoto)
| where name == "ReviewPerformed" and isnotnull(IncludesPhoto)
View metrics in Application Insights
In the Azure portal, select the Application Insights resource.
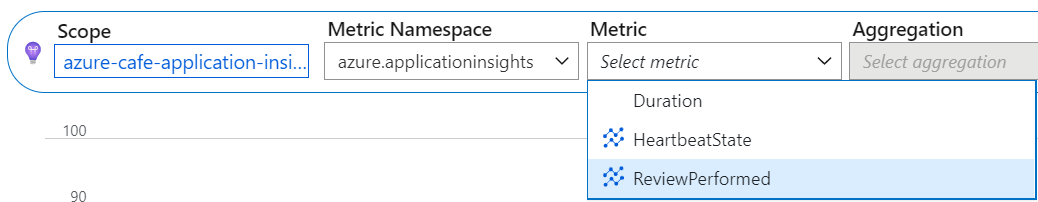
From the left menu of the Application Insights resource, under the Monitoring section, select Metrics.
In the Metric Namespace drop-down menu, select azure.applicationinsights.
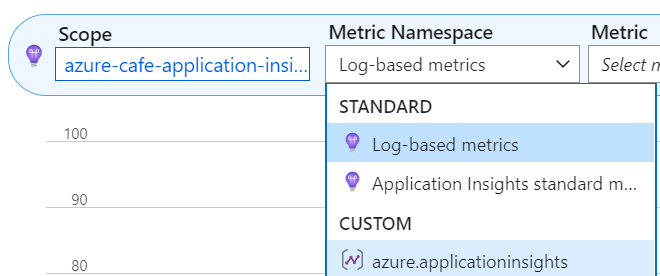
In the Metric drop-down menu, select ReviewPerformed.
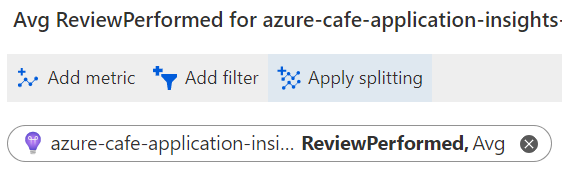
You'll notice that you can't split the metric by your new custom dimension or view your custom dimension with the metrics view.
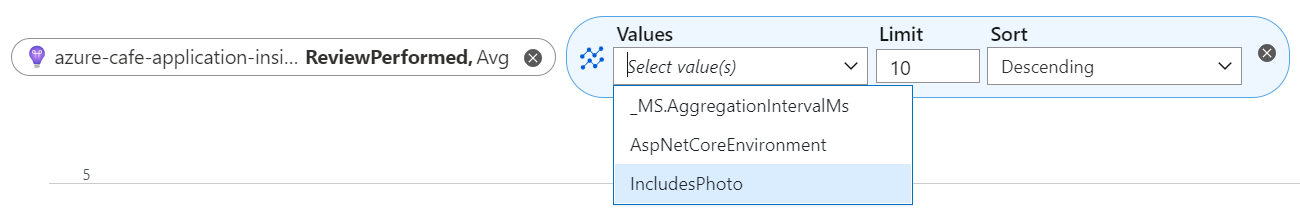
To split the metric by dimension, select Apply Splitting.
To view your custom dimension, in the Values drop-down menu, select IncludesPhoto.


Next steps
- Metric Explorer
- How to enable Application Insights for ASP.NET Core Applications