Understand monitoring costs for Container insights
This article provides pricing guidance for Container insights to help you understand how to:
- Measure costs after Container insights has been enabled for one or more containers.
- Control the collection of data and make cost reductions.
Tip
For strategies to reduce your Azure Monitor costs, see Cost optimization and Azure Monitor.
The Azure Monitor pricing model is primarily based on the amount of data ingested in gigabytes per day into your Log Analytics workspace. The cost of a Log Analytics workspace isn't based only on the volume of data collected, it is also dependent on the plan selected, and how long you chose to store data generated from your clusters.
Note
See Estimate Azure Monitor costs to estimate your costs for Container insights before you enable it.
The following types of data collected from a Kubernetes cluster with Container insights influence cost and can be customized based on your usage:
- Perf, Inventory, InsightsMetrics, and KubeEvents can be controlled through cost optimization settings
- Stdout and stderr container logs from every monitored container in every Kubernetes namespace in the cluster via the agent ConfigMap
- Container environment variables from every monitored container in the cluster
- Completed Kubernetes jobs/pods in the cluster that don't require monitoring
- Active scraping of Prometheus metrics
- Resource log collection of Kubernetes main node logs in your Azure Kubernetes Service (AKS) cluster to analyze log data generated by main components, such as
kube-apiserverandkube-controller-manager.
Control ingestion to reduce cost
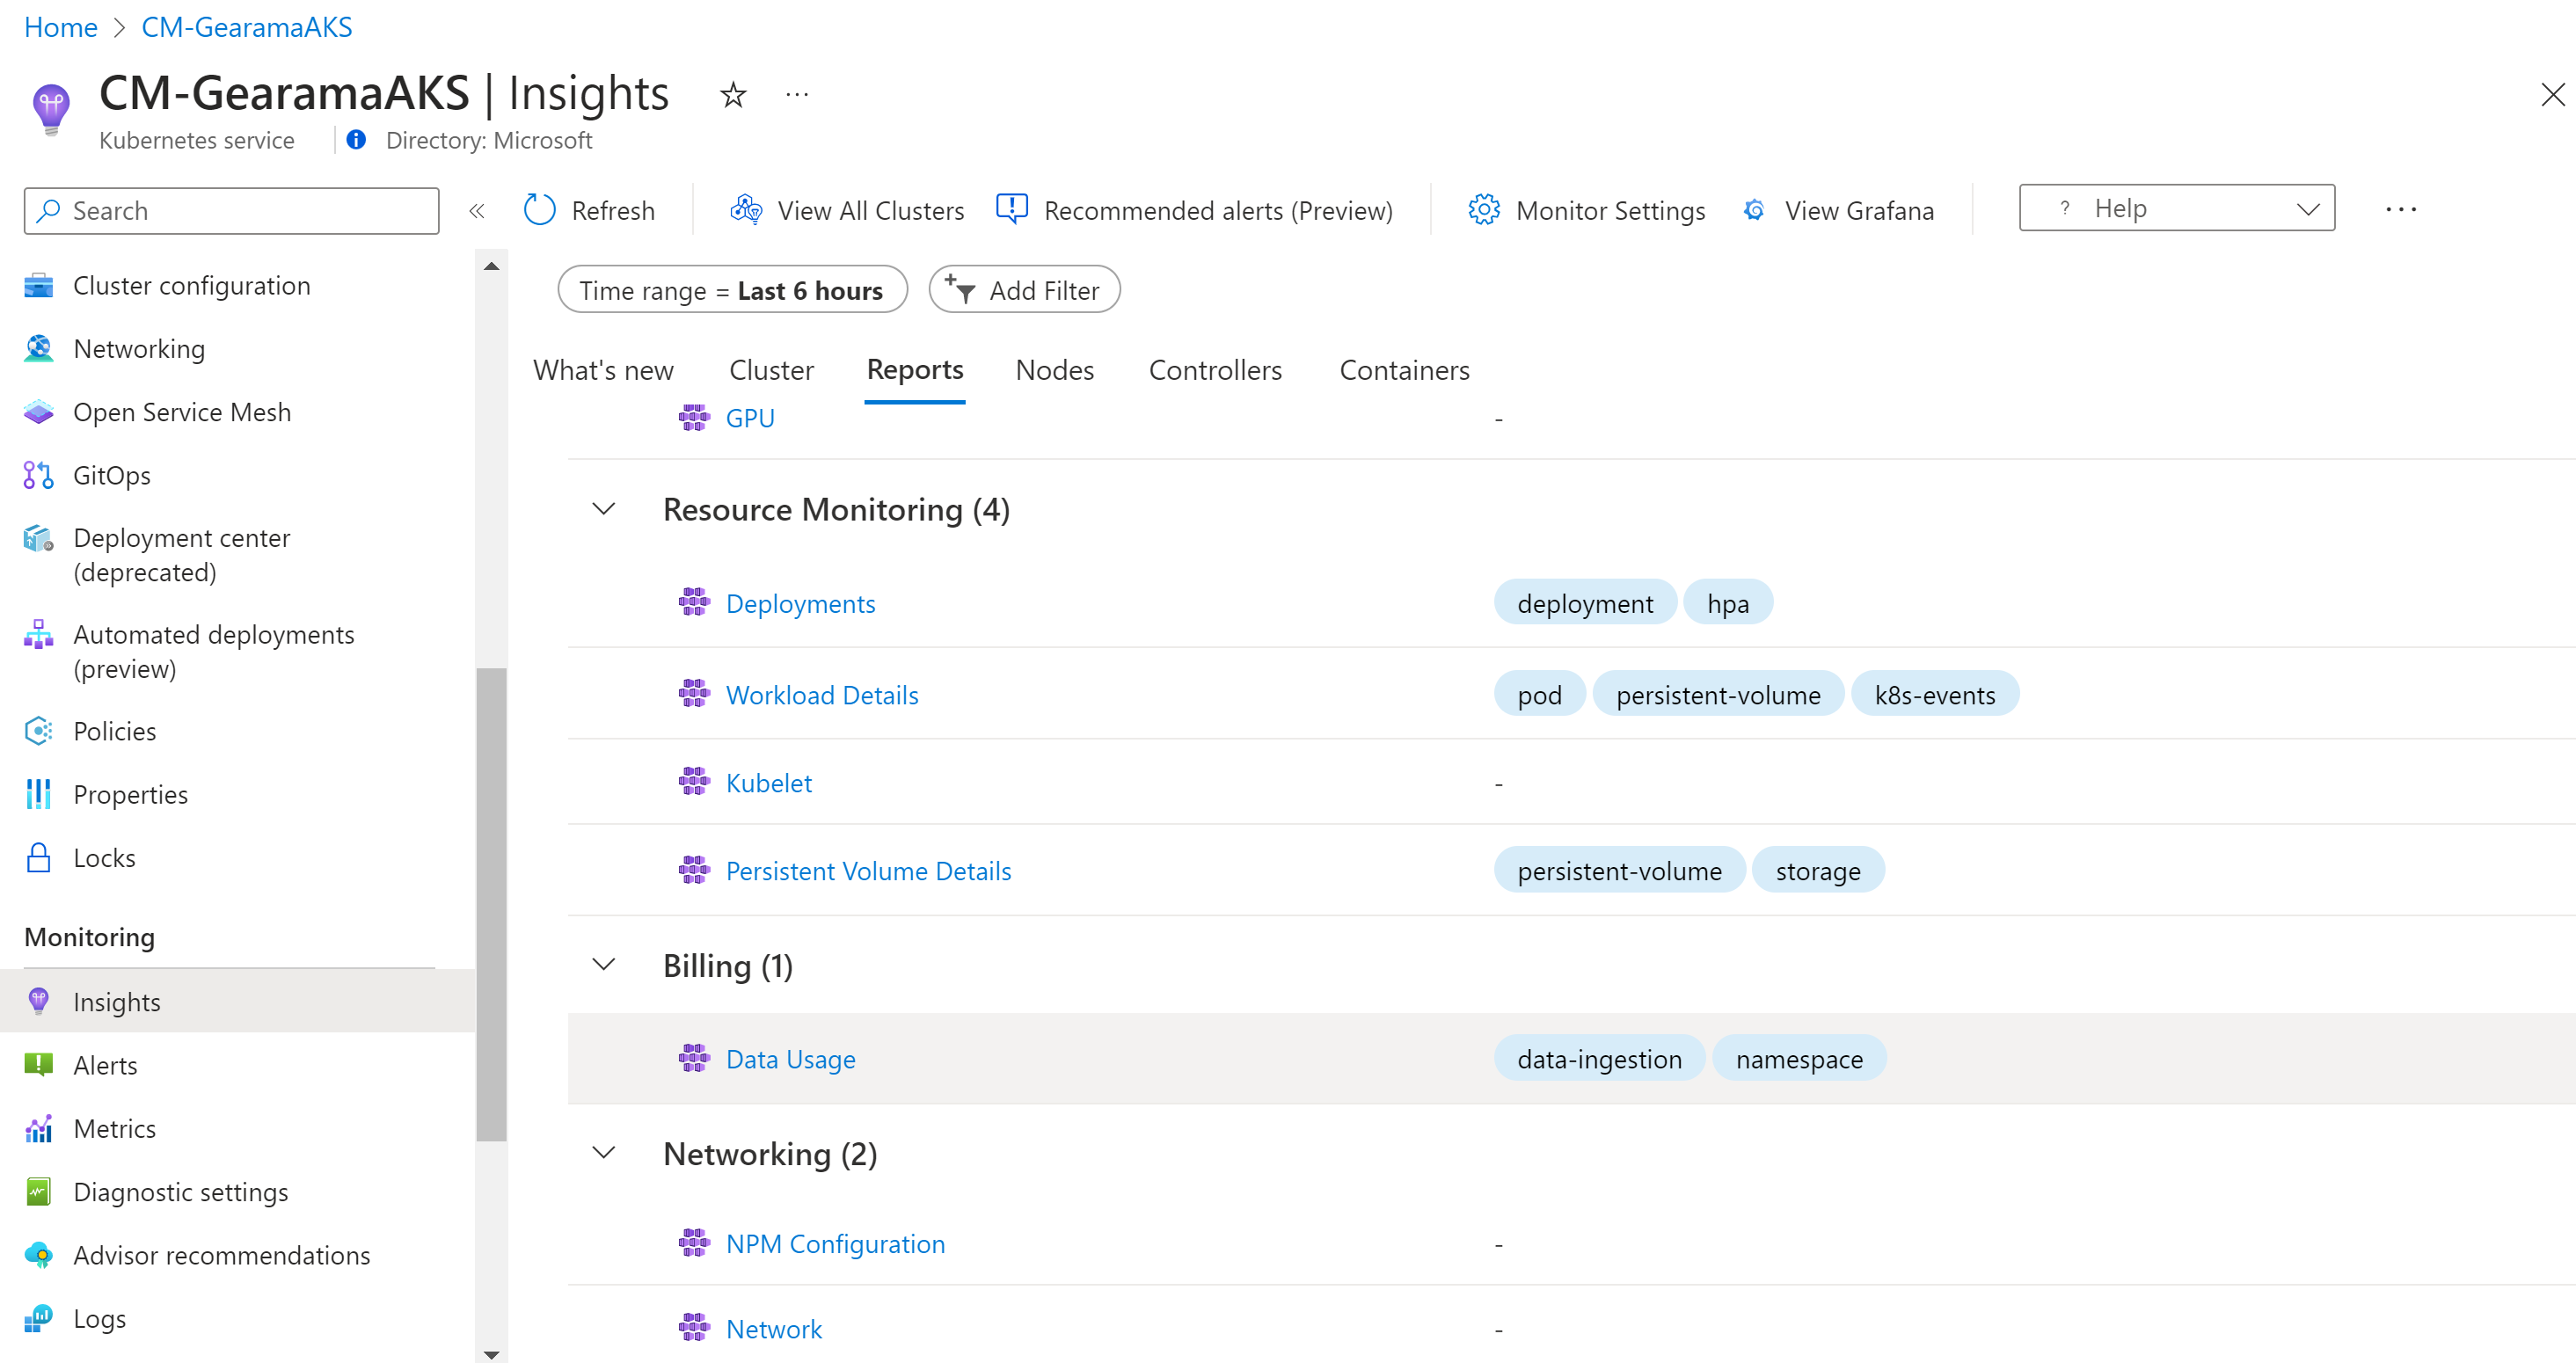
Consider a scenario where your organization's different business units share Kubernetes infrastructure and a Log Analytics workspace. Each business unit is separated by a Kubernetes namespace. You can visualize how much data is ingested in each workspace by using the Data Usage runbook. The runbook is available from the Reports tab.
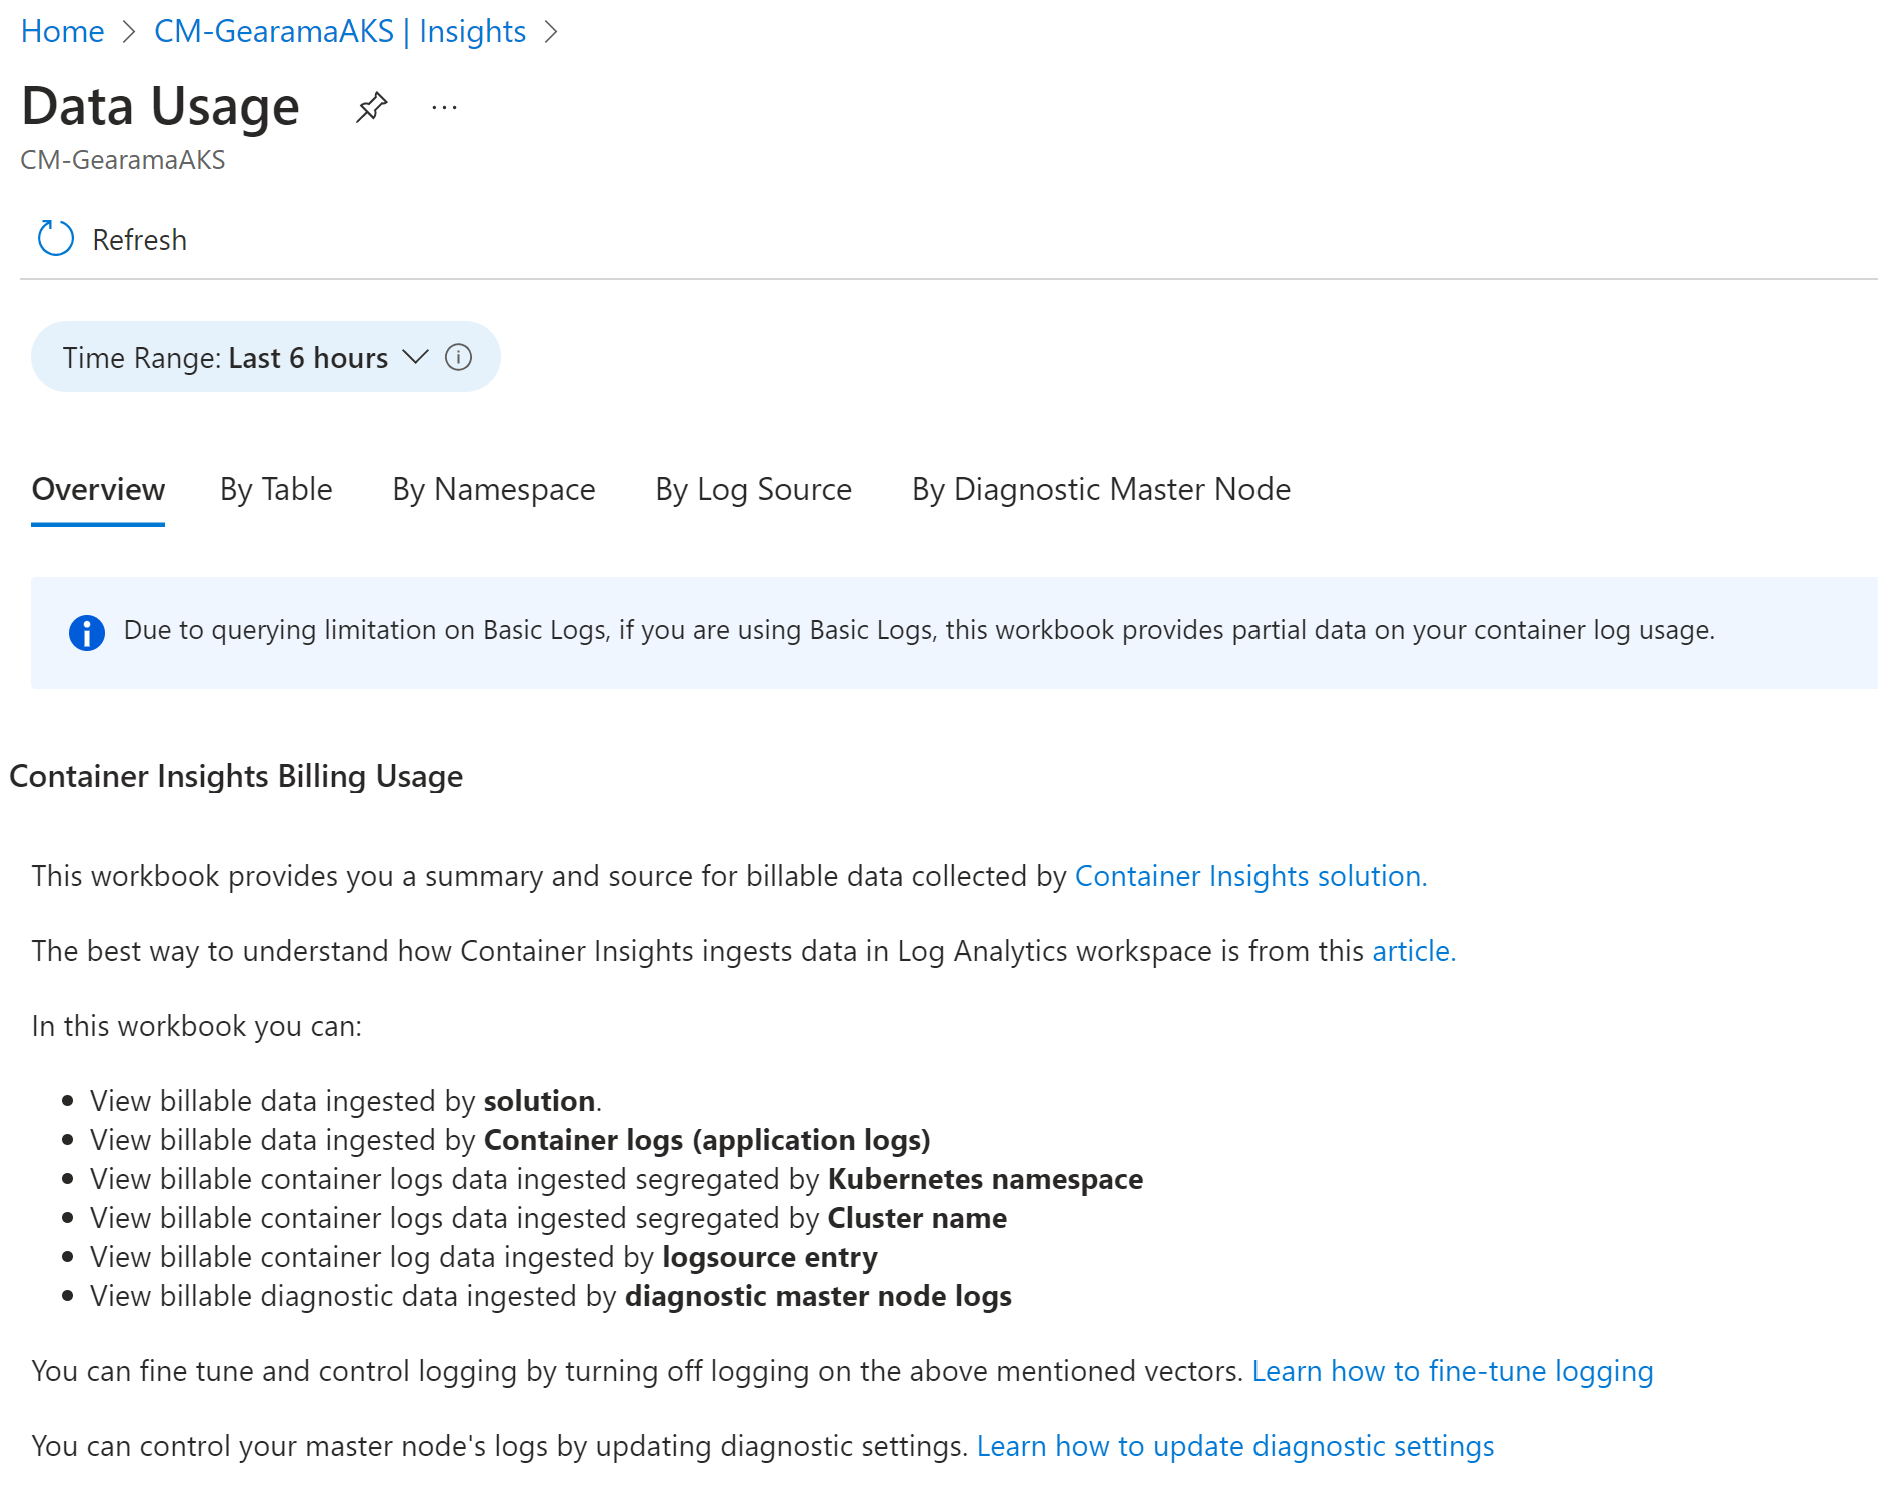
This workbook helps you visualize the source of your data without having to build your own library of queries from what we share in our documentation. In this workbook, you can view charts that present billable data such as the:
- Total billable data ingested in GB by solution.
- Billable data ingested by Container logs (application logs).
- Billable container logs data ingested by Kubernetes namespace.
- Billable container logs data ingested segregated by Cluster name.
- Billable container log data ingested by log source entry.
- Billable diagnostic data ingested by diagnostic main node logs.
To learn about managing rights and permissions to the workbook, review Access control.
Determining the root cause of the data ingestion
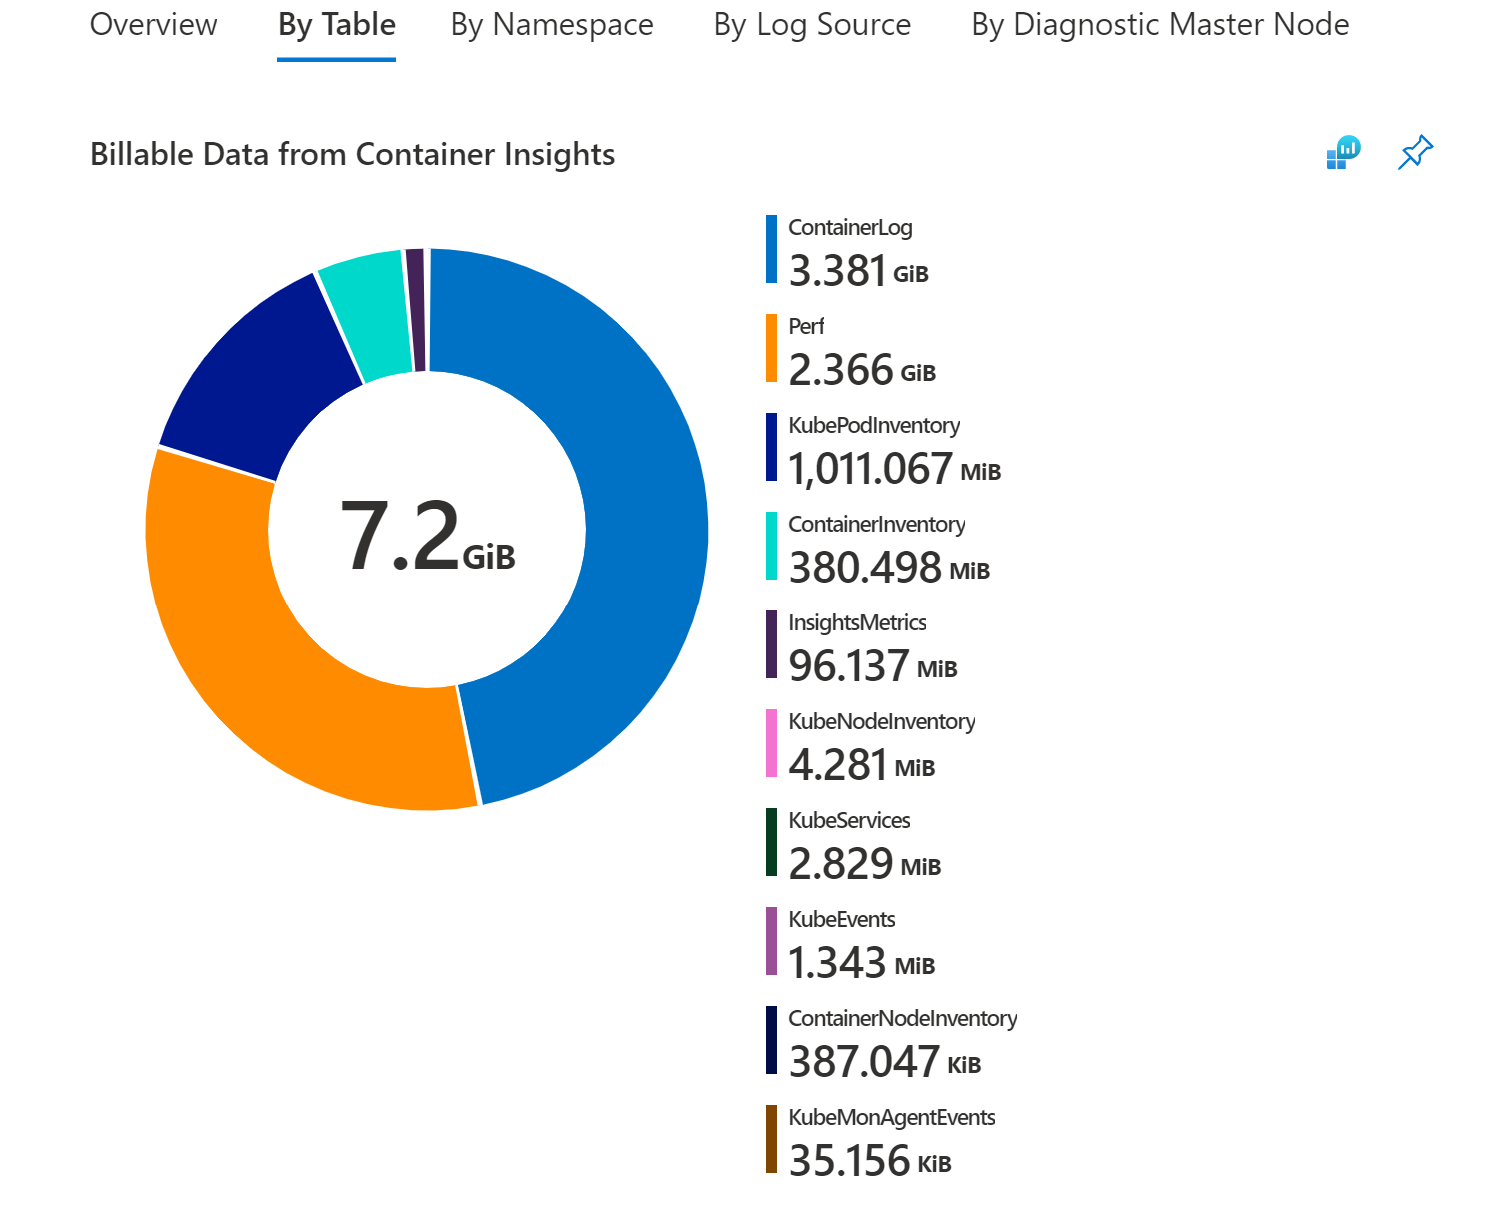
Container Insights data primarily consists of metric counters (Perf, Inventory, InsightsMetrics, and custom metrics) and logs (ContainerLog). Based on your cluster usage and size, you may have different requirements and monitoring needs.
By navigating to the By Table section of the Data Usage workbook, you can see the breakdown of table sizes for Container Insights.
If the majority of your data comes from one of these following tables:
- Perf
- InsightsMetrics
- ContainerInventory
- ContainerNodeInventory
- KubeNodeInventory
- KubePodInventory
- KubePVInventory
- KubeServices
- KubeEvents
You can adjust your ingestion using the cost optimization settings and/or migrating to the Prometheus metrics addon
Otherwise, the majority of your data belongs to the ContainerLog table. and you can follow the steps below to reduce your ContainerLog costs.
Reducing your ContainerLog costs
After you finish your analysis to determine which sources are generating the data that's exceeding your requirements, you can reconfigure data collection. For more information on configuring collection of stdout, stderr, and environmental variables, see Configure agent data collection settings.
The following examples show what changes you can apply to your cluster by modifying the ConfigMap file to help control cost.
Disable stdout logs across all namespaces in the cluster by modifying the following code in the ConfigMap file for the Azure Container insights service that's pulling the metrics:
[log_collection_settings]
   [log_collection_settings.stdout]
      enabled = false
Disable collecting stderr logs from your development namespace. An example is
dev-test. Continue collecting stderr logs from other namespaces, such as,prodanddefault, by modifying the following code in the ConfigMap file:Note
The kube-system log collection is disabled by default. The default setting is retained. Adding the
dev-testnamespace to the list of exclusion namespaces is applied to stderr log collection.[log_collection_settings.stderr] enabled = true exclude_namespaces = ["kube-system", "dev-test"]Disable environment variable collection across the cluster by modifying the following code in the ConfigMap file. This modification applies to all containers in every Kubernetes namespace.
[log_collection_settings.env_var]
    enabled = false
To clean up jobs that are finished, specify the cleanup policy in your job definition yaml. Following is example Job definition with clean-up policy. For more details, refer to Kubernetes documentation.
apiVersion: batch/v1
kind: Job
metadata:
  name: pi-with-ttl
spec:
  ttlSecondsAfterFinished: 100
After you apply one or more of these changes to your ConfigMaps, apply it to your cluster with the command kubectl apply -f <config3. map_yaml_file.yaml>. For example, run the command kubectl apply -f container-azm-ms-agentconfig.yaml to open the file in your default editor to modify and then save it.
Configure Basic Logs
You can save on data ingestion costs on ContainerLog in your Log Analytics workspace that you primarily use for debugging, troubleshooting, and auditing as Basic Logs. For more information, including the limitations of Basic Logs, see Configure Basic Logs in Azure Monitor. ContainerLogV2 is the configured version of Basic Logs that Container Insights uses. ContainerLogV2 includes verbose text-based log records.
You must be on the ContainerLogV2 schema to configure Basic Logs. For more information, see Enable the ContainerLogV2 schema (preview).
Prometheus metrics scraping
Note
This section describes collection of Prometheus metrics in your Log Analytics workspace. This information does not apply if you're using Managed Prometheus to scrape your Prometheus metrics.
If you collect Prometheus metrics in your Log Analytics workspace, make sure that you limit the number of metrics you collect from your cluster:
- Ensure that scraping frequency is optimally set. The default is 60 seconds. You can increase the frequency to 15 seconds, but you must ensure that the metrics you're scraping are published at that frequency. Otherwise, many duplicate metrics will be scraped and sent to your Log Analytics workspace at intervals that add to data ingestion and retention costs but are of less value.
- Container insights supports exclusion and inclusion lists by metric name. For example, if you're scraping kubedns metrics in your cluster, hundreds of them might get scraped by default. But you're most likely only interested in a subset of the metrics. Confirm that you specified a list of metrics to scrape, or exclude others except for a few to save on data ingestion volume. It's easy to enable scraping and not use many of those metrics, which will only add charges to your Log Analytics bill.
- When you scrape through pod annotations, ensure you filter by namespace so that you exclude scraping of pod metrics from namespaces that you don't use. An example is the
dev-testnamespace.
Data collected from Kubernetes clusters
Metric data
Container insights includes a predefined set of metrics and inventory items collected that are written as log data in your Log Analytics workspace. All metrics in the following table are collected every one minute.
| Type | Metrics |
|---|---|
| Node metrics | cpuUsageNanoCorescpuCapacityNanoCorescpuAllocatableNanoCoresmemoryRssBytesmemoryWorkingSetBytesmemoryCapacityBytesmemoryAllocatableBytesrestartTimeEpochused (disk)free (disk)used_percent (disk)io_time (diskio)writes (diskio)reads (diskio)write_bytes (diskio)write_time (diskio)iops_in_progress (diskio)read_bytes (diskio)read_time (diskio)err_in (net)err_out (net)bytes_recv (net)bytes_sent (net)Kubelet_docker_operations (kubelet) |
| Container metrics | cpuUsageNanoCorescpuRequestNanoCorescpuLimitNanoCoresmemoryRssBytesmemoryWorkingSetBytesmemoryRequestBytesmemoryLimitBytesrestartTimeEpoch |
Cluster inventory
The following list is the cluster inventory data collected by default:
- KubePodInventory – 1 per pod per minute
- KubeNodeInventory – 1 per node per minute
- KubeServices – 1 per service per minute
- ContainerInventory – 1 per container per minute
Next steps
To help you understand what the costs are likely to be based on recent usage patterns from data collected with Container insights, see Analyze usage in a Log Analytics workspace.
Feedback
Coming soon: Throughout 2024 we will be phasing out GitHub Issues as the feedback mechanism for content and replacing it with a new feedback system. For more information see: https://aka.ms/ContentUserFeedback.
Submit and view feedback for


