Container insights log schema
Container insights stores log data it collects in a table called ContainerLogV2. This article describes the schema of this table and its comparison and migration from the legacy ContainerLog table.
Important
ContainerLogV2 will be the default schema via the ConfigMap for CLI version 2.54.0 and greater. ContainerLogV2 will be default ingestion format for customers who will be onboarding container insights with Managed Identity Auth using ARM, Bicep, Terraform, Policy and Portal onboarding. ContainerLogV2 can be explicitly enabled through CLI version 2.51.0 or higher using Data collection settings.
Support for the ContainerLog table will be retired on 30th September 2026.
Table comparison
The following table highlights the key differences between using ContainerLogV2 and ContainerLog schema.
| Feature differences | ContainerLog | ContainerLogV2 |
|---|---|---|
| Schema | Details at ContainerLog. | Details at ContainerLogV2. Additional columns are: - ContainerName- PodName- PodNamespace. |
| Onboarding | Only configurable through ConfigMap. | Configurable through both ConfigMap and DCR. 1 |
| Pricing | Only compatible with full-priced analytics logs. | Supports the low cost basic logs tier in addition to analytics logs. |
| Querying | Requires multiple join operations with inventory tables for standard queries. | Includes additional pod and container metadata to reduce query complexity and join operations. |
| Multiline | Not supported, multiline entries are split into multiple rows. | Support for multiline logging to allow consolidated, single entries for multiline output. |
1DCR configuration not supported for clusters using service principal authentication based clusters. Migrate your clusters with service principal to managed identity to use this experience.
Note
Export to Event Hub and Storage Account is not supported if the incoming LogMessage is not a valid JSON. For best performance, we recommend emitting container logs in JSON format.
Assess the impact on existing alerts
Before you enable the ContainerLogsV2 schema, you should assess whether you have any alert rules that rely on the ContainerLog table. Any such alerts will need to be updated to use the new table.
To scan for alerts that reference the ContainerLog table, run the following Azure Resource Graph query:
resources
| where type in~ ('microsoft.insights/scheduledqueryrules') and ['kind'] !in~ ('LogToMetric')
| extend severity = strcat("Sev", properties["severity"])
| extend enabled = tobool(properties["enabled"])
| where enabled in~ ('true')
| where tolower(properties["targetResourceTypes"]) matches regex 'microsoft.operationalinsights/workspaces($|/.*)?' or tolower(properties["targetResourceType"]) matches regex 'microsoft.operationalinsights/workspaces($|/.*)?' or tolower(properties["scopes"]) matches regex 'providers/microsoft.operationalinsights/workspaces($|/.*)?'
| where properties contains "ContainerLog"
| project id,name,type,properties,enabled,severity,subscriptionId
| order by tolower(name) asc
Enable the ContainerLogV2 schema
You can enable the ContainerLogV2 schema for a cluster either using the cluster's Data Collection Rule (DCR) or ConfigMap. If both settings are enabled, the ConfigMap will take precedence. Stdout and stderr logs will only be ingested to the ContainerLog table when both the DCR and ConfigMap are explicitly set to off.
Multi-line logging in Container Insights
With multiline logging enabled, previously split container logs are stitched together and sent as single entries to the ContainerLogV2 table. If the stitched log line is larger than 64 KB, it will be truncated due to Log Analytics workspace limits. This feature also has support for .NET, Go, Python and Java stack traces, which appear as single entries in the ContainerLogV2 table. Enable multiline logging with ConfigMap as described in Configure data collection in Container insights using ConfigMap.
Note
The configmap now features a language specification option, wherein the customers can select only the languages that they are interested in. This feature can be enabled by editing the languages in the stacktrace_languages option in the configmap.
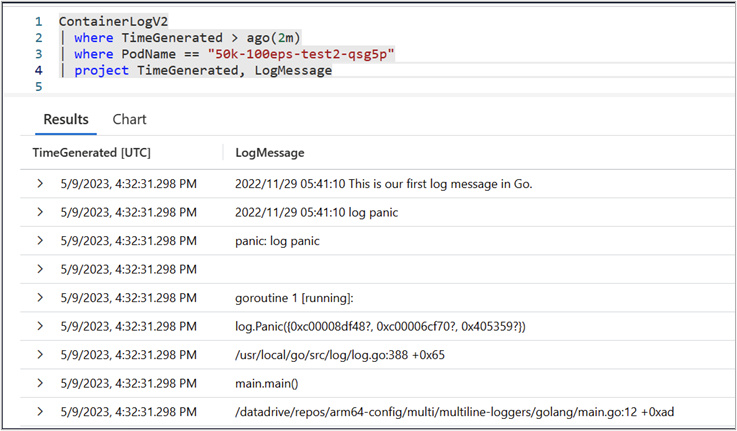
The following screenshots show multi-line logging for Go exception stack trace:
Multi-line logging disabled
Multi-line logging enabled
Java stack trace
Python stack trace
Next steps
- Configure Basic Logs for ContainerLogv2.
- Learn how query data from ContainerLogV2
Feedback
Coming soon: Throughout 2024 we will be phasing out GitHub Issues as the feedback mechanism for content and replacing it with a new feedback system. For more information see: https://aka.ms/ContentUserFeedback.
Submit and view feedback for


