Configure self-managed Grafana to use Azure Monitor managed service for Prometheus with Microsoft Entra ID.
Azure Monitor managed service for Prometheus allows you to collect and analyze metrics at scale using a Prometheus-compatible monitoring solution. The most common way to analyze and present Prometheus data is with a Grafana dashboard. This article explains how to configure Prometheus as a data source for self-hosted Grafana using Microsoft Entra ID.
For information on using Grafana with managed system identity, see Configure Grafana using managed system identity.
Microsoft Entra authentication
To set up Microsoft Entra authentication, follow the steps below:
- Register an app with Microsoft Entra ID.
- Grant access for the app to your Azure Monitor workspace.
- Configure your self-hosted Grafana with the app's credentials.
Register an app with Microsoft Entra ID
To register an app, open the Active Directory Overview page in the Azure portal.
Select New registration.
On the Register an application page, enter a Name for the application.
Select Register.
Note the Application (client) ID and Directory(Tenant) ID. They're used in the Grafana authentication settings.
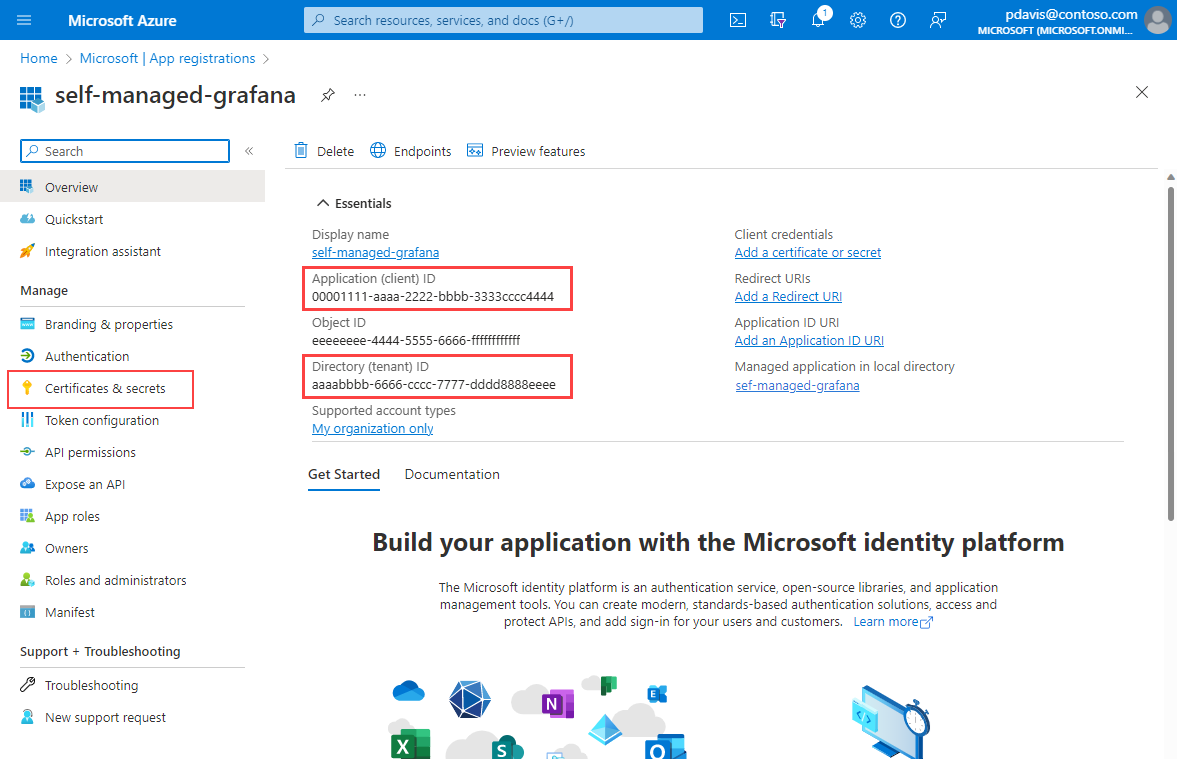
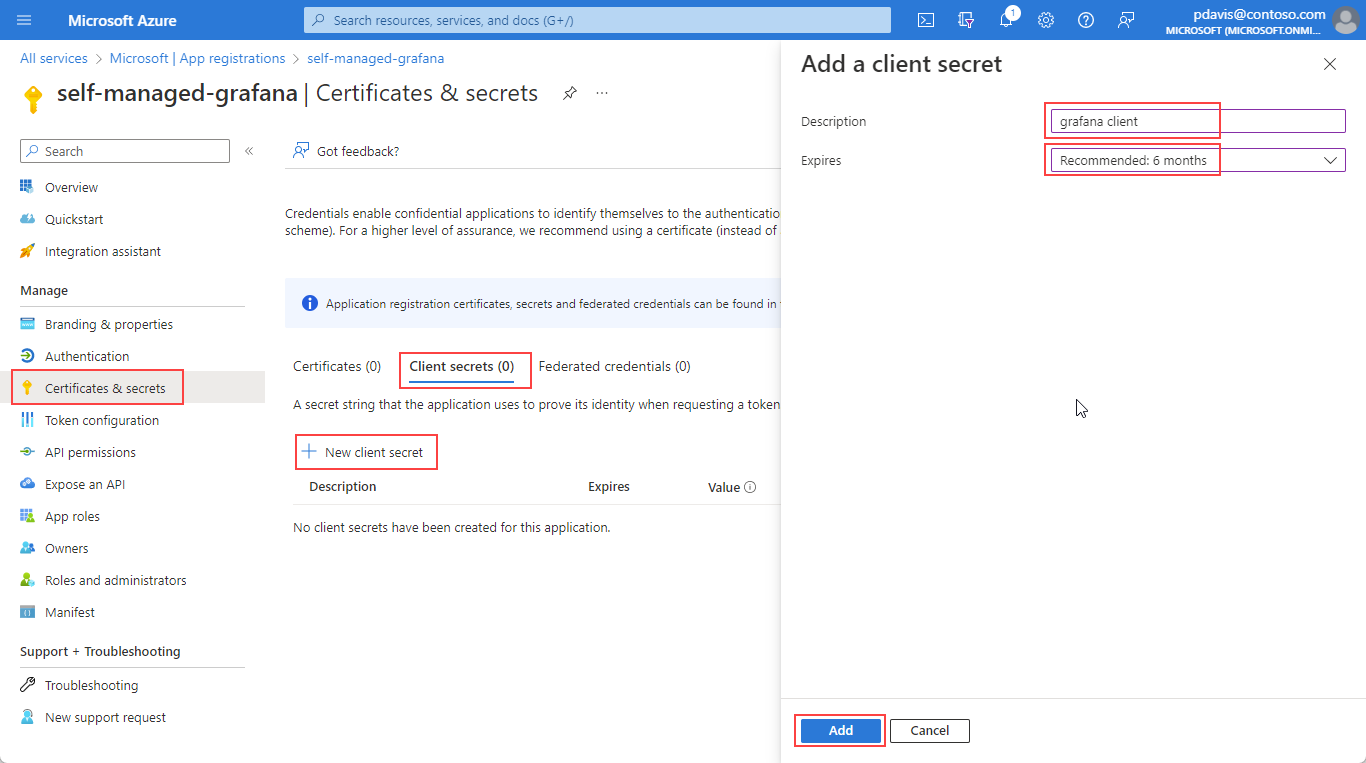
On the app's overview page, select Certificates and Secrets.
In the client secrets tab, select New client secret.
Enter a Description.
Select an expiry period from the dropdown and select Add.
Note
Create a process to renew the secret and update your Grafana data source settings before the secret expires. Once the secret expires Grafana will lose the ability to query data from your Azure Monitor workspace.
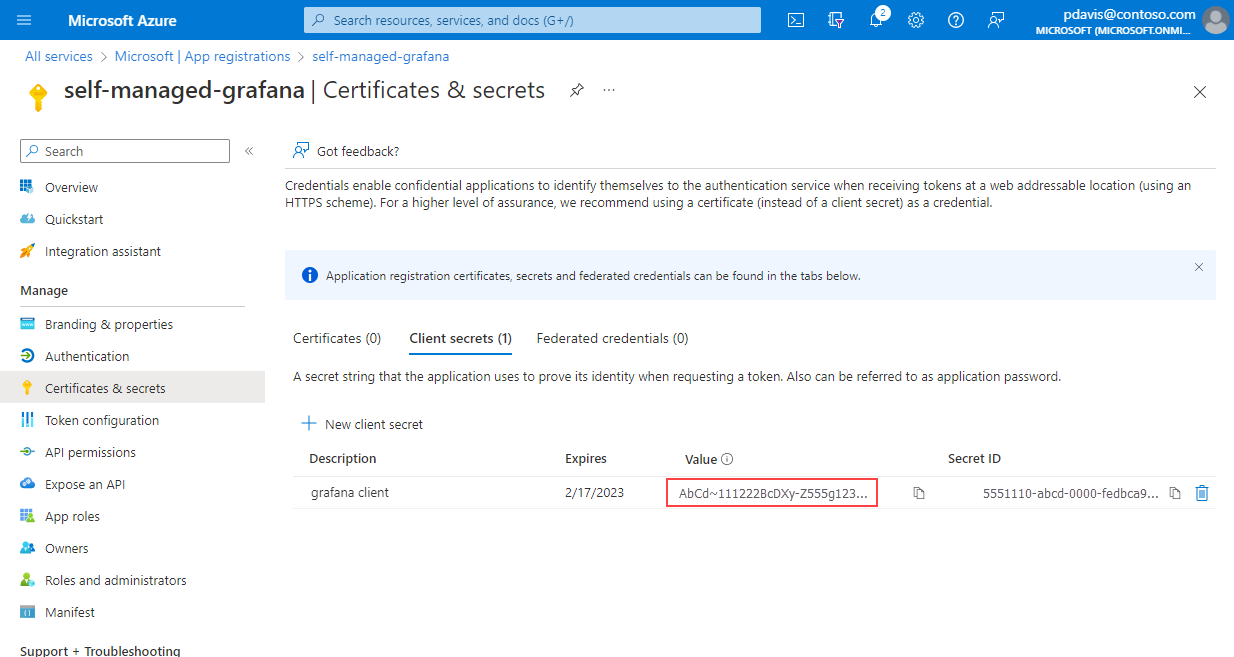
Copy and save the client secret Value.
Note
Client secret values can only be viewed immediately after creation. Be sure to save the secret before leaving the page.
Allow your app access to your workspace
Allow your app to query data from your Azure Monitor workspace.
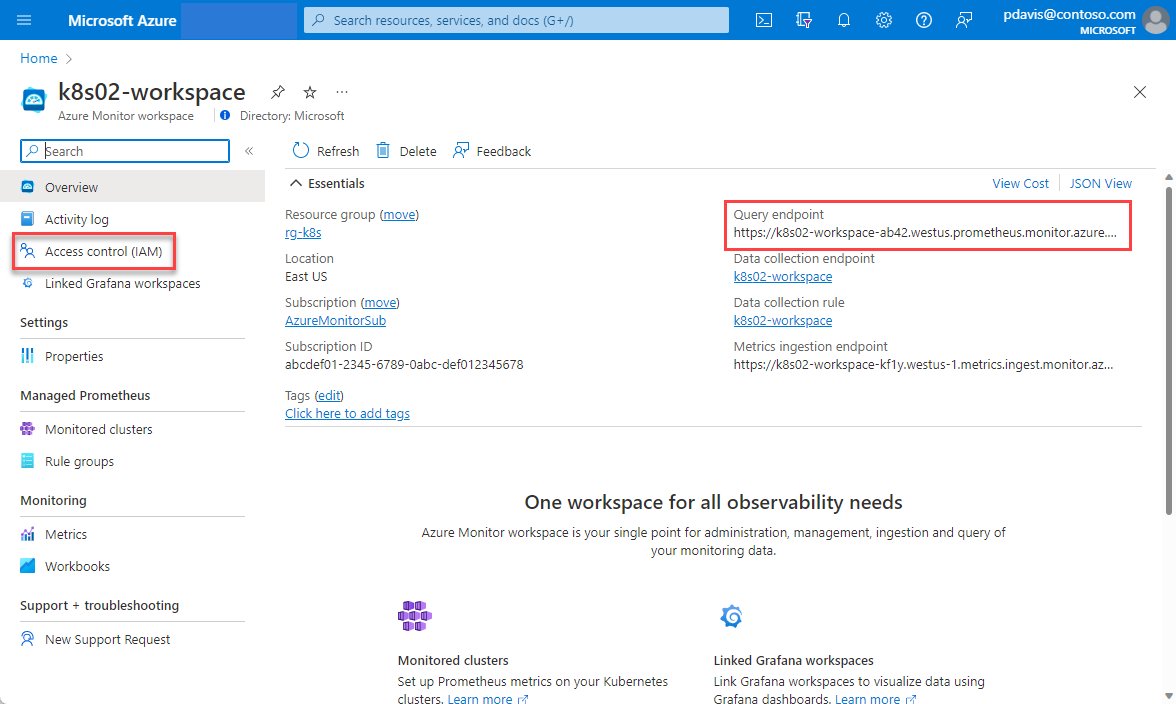
Open your Azure Monitor workspace in the Azure portal.
On the Overview page, take note of your Query endpoint. The query endpoint is used when setting up your Grafana data source.
Select Access control (IAM).
Select Add, then Add role assignment from the Access Control (IAM) page.
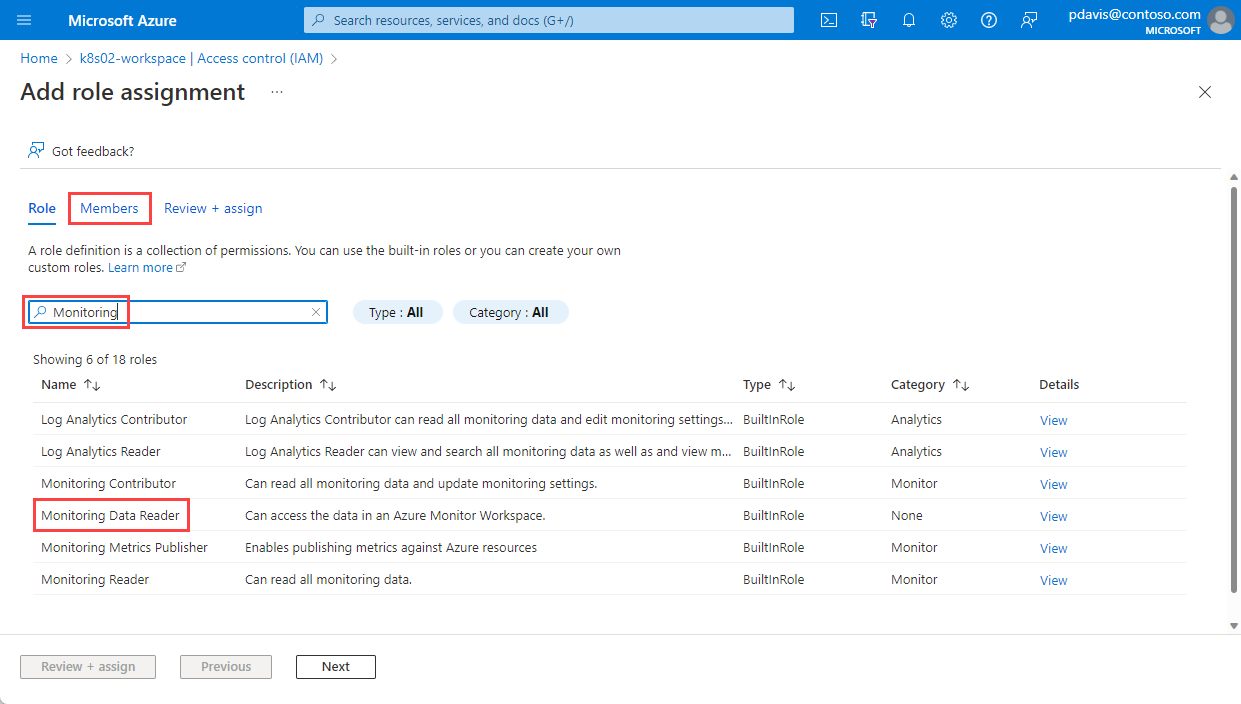
On the Add role Assignment page, search for Monitoring.
Select Monitoring data reader, then select the Members tab.
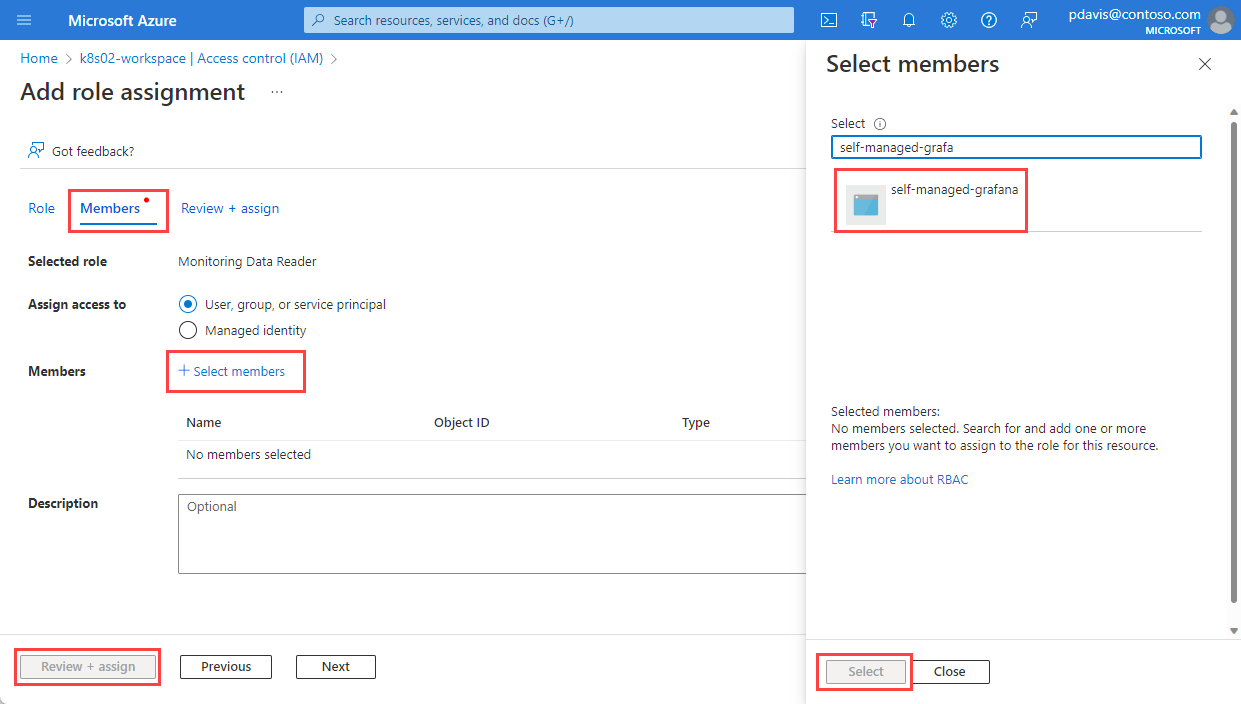
Select Select members.
Search for the app that you registered in the Register an app with Microsoft Entra ID section and select it.
Click Select.
Select Review + assign.
You've created your App registration and have assigned it access to query data from your Azure Monitor workspace. The next step is setting up your Prometheus data source in Grafana.
Setup self-managed Grafana to turn on Azure Authentication.
Grafana now supports connecting to Azure Monitor managed Prometheus using the Prometheus data source. For self-hosted Grafana instances, a configuration change is needed to use the Azure Authentication option in Grafana. For self-hosted Grafana or any other Grafana instances that are not managed by Azure, make the following changes:
Locate the Grafana configuration file. See the Configure Grafana documentation for details.
Identity your Grafana version.
Update the Grafana configuration file.
For Grafana 9.0:
    [feature_toggles]
    # Azure authentication for Prometheus (<=9.0)
    prometheus_azure_auth = true
For Grafana 9.1 and later versions:
    [auth]
    # Azure authentication for Prometheus (>=9.1)
    azure_auth_enabled = true
For Azure Managed Grafana, you don't need to make any configuration changes. Managed Identity is also enabled by default.
Configure your Prometheus data source in Grafana
Sign-in to your Grafana instance.
On the configuration page, select the Data sources tab.
Select Add data source.
Select Prometheus.
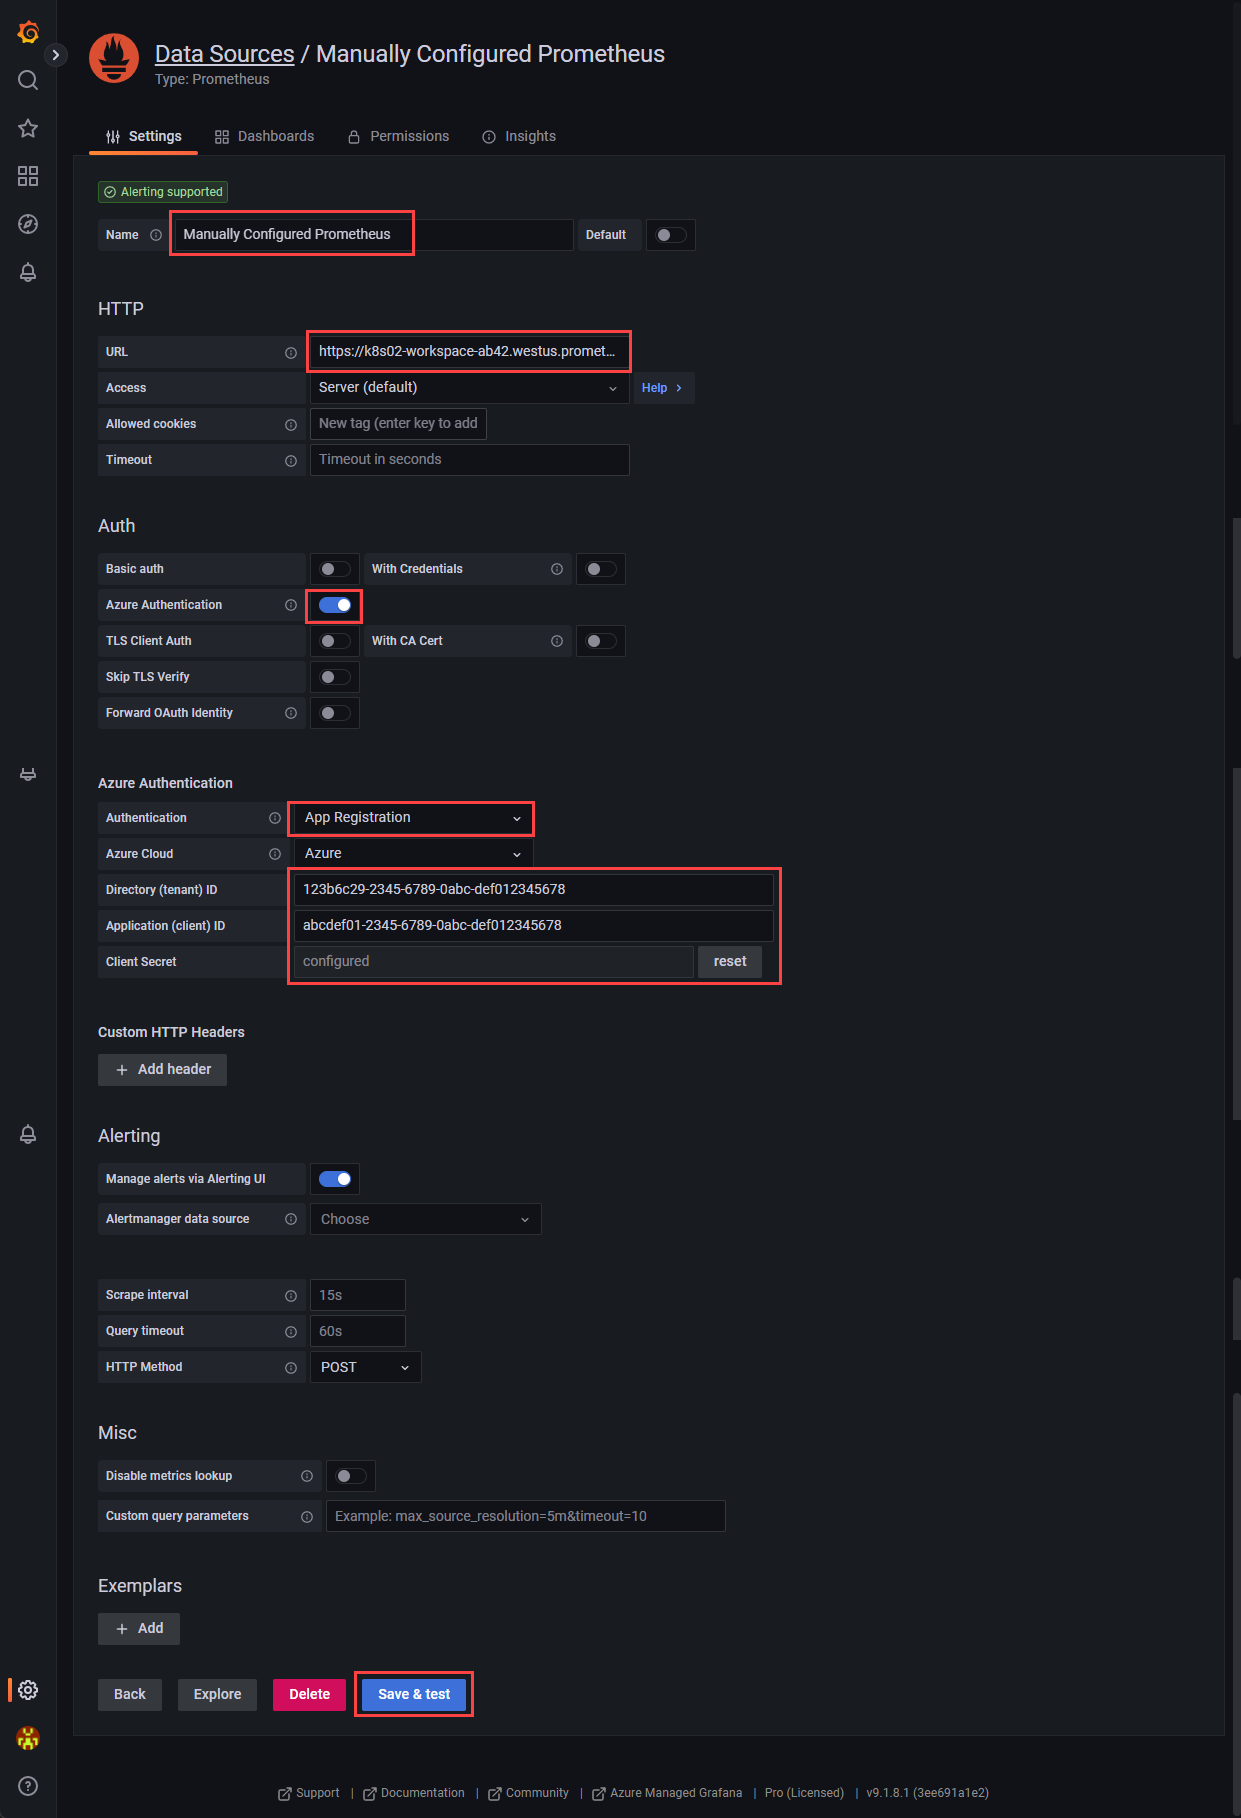
Enter a Name for your Prometheus data source.
In the URL field, paste the Query endpoint value from the Azure Monitor workspace overview page.
Under Auth, turn on Azure Authentication.
In the Azure Authentication section, select App Registration from the Authentication dropdown.
Enter the Direct(tenant) ID, Application (client) ID, and the Client secret from the Register an app with Microsoft Entra ID section.
Select Save & test
Frequently asked questions
This section provides answers to common questions.
I am missing all or some of my metrics. How can I troubleshoot?
You can use the troubleshooting guide for ingesting Prometheus metrics from the managed agent here.
Why am I missing metrics that have two labels with the same name but different casing?
Azure managed Prometheus is a case insensitive system. It treats strings, such as metric names, label names, or label values, as the same time series if they differ from another time series only by the case of the string. For more information, see Prometheus metrics overview.
I see some gaps in metric data, why is this occurring?
During node updates, you might see a 1-minute to 2-minute gap in metric data for metrics collected from our cluster level collectors. This gap occurs because the node that the data runs on is being updated as part of a normal update process. This update process affects cluster-wide targets such as kube-state-metrics and custom application targets that are specified. This occurs when your cluster is updated manually or via autoupdate. This behavior is expected and occurs due to the node it runs on being updated. This behavior doesn't affect any of our recommended alert rules.
Next steps
Feedback
Coming soon: Throughout 2024 we will be phasing out GitHub Issues as the feedback mechanism for content and replacing it with a new feedback system. For more information see: https://aka.ms/ContentUserFeedback.
Submit and view feedback for