Note
Access to this page requires authorization. You can try signing in or changing directories.
Access to this page requires authorization. You can try changing directories.
Signals determine the health state of each entity in your Azure Monitor health model. In this tutorial, you configure three signal types in the designer: Azure resource metric signals, Log Analytics workspace signals (logs), and Azure Monitor workspace signals (metrics).
In this tutorial, you learn how to:
- Add and tune an Azure resource metric signal.
- Add and tune a Log Analytics workspace signal based on a KQL query.
- Add and tune an Azure Monitor workspace signal based on a PromQL query.
- Reuse signal definitions across entities.
Prerequisites
Before you start:
- Create a health model with at least one entity. For details, see Create a new Azure Monitor health model.
- Verify that your entity maps to a real data source such as an Azure resource, Log Analytics workspace telemetry, or Prometheus metrics in an Azure Monitor workspace.
- Ensure the health model identity has permissions to read the target telemetry. For details, see Permissions required.
Understand signal options in the entity editor
- Select Designer from your health model's menu in the Azure portal.
- Select Edit on the entity you want to configure.
- Select the Signals tab.
The Signals tab lets you add and tune signal assignments for the entity.
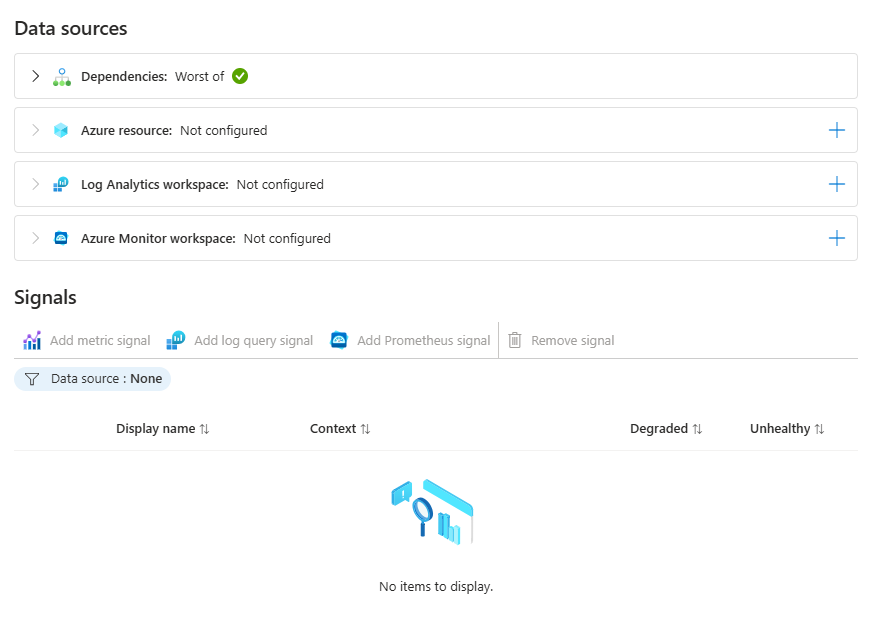
When you add a signal assignment, you can choose one of these options:
- Create new to define a new signal.
- Signal definitions to reuse an existing signal definition.
- Recommended to add a suggested signal for supported Azure resources.
- Import from alert rules to create a signal from an existing Azure Monitor alert rule.
Add an Azure resource metric signal
Use an Azure resource signal to evaluate platform metrics from the resource represented by the entity, such as CPU percentage, request count, or availability.
In the entity editor, in the Azure resource data source select Add Azure resource.
Choose the Azure resource.
Under Signals, select Add metric signal and then Create new.
Select a metric from the available list.
Configure threshold logic for Degraded and Unhealthy.
Optional: If available for the metric, apply suggested thresholds, or set Threshold type to Dynamic to enable dynamic thresholds.
Dynamic thresholds adapt to the metric's normal patterns and seasonal variance instead of using a fixed value. Set the Sensitivity to tune how the signal learns normal behavior. During warm-up or sparse-data periods, health evaluation temporarily relies on available in-place statistics until enough history is collected. For more information, see Dynamic thresholds.
Select one of the following actions:
- Add to entity to save this signal only on the current entity.
- Save as new signal definition to create a reusable definition for other entities in the same health model.
Select Save.
Note
A metric signal shows as Unknown when no traffic is visible on the resource. It resolves once traffic begins to flow. The metric charts reflect the same behavior, so they can look misleading until enough data is collected.
Add a Log Analytics workspace signal (KQL)
Use a Log Analytics workspace signal when health depends on log-based conditions, such as error rates, failed requests, or custom operational events.
- In the entity editor, select Add Log Analytics workspace.
- Choose the workspace resource, and select Select resources.
- Set Authentication setting if needed, and then select Add log query signal and then Create new.
- Enter a display name.
- Select Edit query, then write or select a KQL query that returns a single numeric value. Select Run before confirming with Done.
- Configure Degraded and Unhealthy thresholds.
- Select Add to entity or Save as new signal definition, and then select Save.
Add an Azure Monitor workspace signal (PromQL)
Use an Azure Monitor workspace signal to evaluate Prometheus metrics by using PromQL, such as Kubernetes workload and infrastructure signals.
- In the entity editor, select Add Azure Monitor workspace.
- Choose the workspace resource, and select Select resources.
- Set Authentication setting if needed, and then select Add Prometheus signal.
- Enter a display name and provide a PromQL query that returns a single numeric value.
- Configure Degraded and Unhealthy thresholds for the expected operating range.
- Select Add to entity or Save as new signal definition, and then select Save.
For detailed property guidance, see Create and configure signals in Azure Monitor health models.
Reuse signal definitions across entities
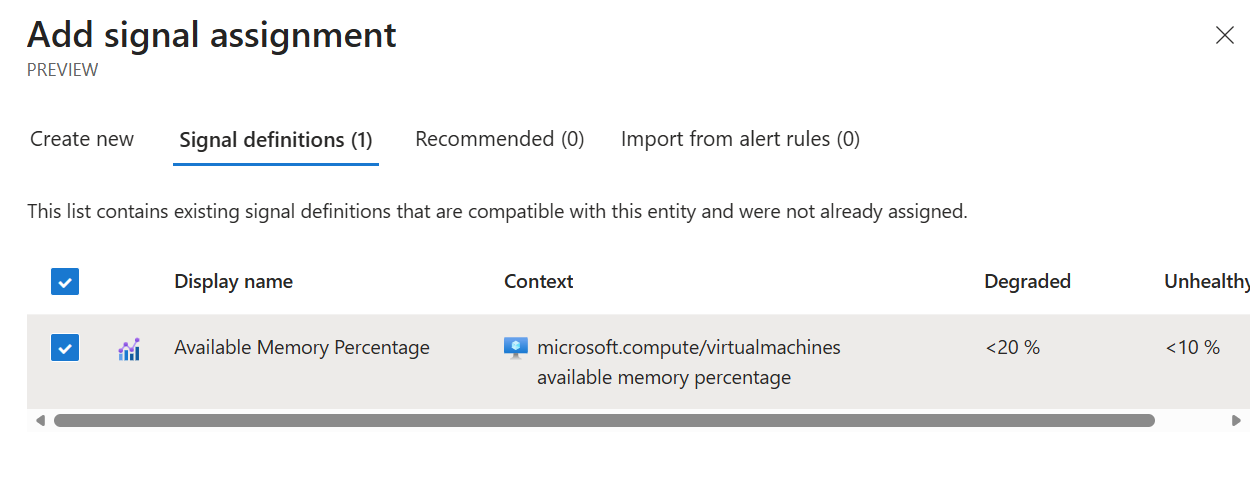
To apply an existing signal definition to another entity:
- Open the target entity in Designer and go to Signals.
- Select Add metric, log query, or Prometheus signal, and then select Signal definitions.
- Select a definition that isn't already assigned to the entity.
- Select Select, and then select Save.
Validate signal behavior
After you save your signals:
- Select Graph and Timeline views to verify health transitions.
- Confirm that entities shift between Healthy, Degraded, and Unhealthy as expected.
- Refine thresholds if states are too sensitive or not sensitive enough.
Next steps
After you configure signals, tune health propagation and alerting: