How to troubleshoot connectivity and message delivery issues
Article
This guidance introduces several ways to help do self-diagnosis to find the root cause directly or narrow down the issue. The self-diagnosis result is also useful when reporting it to us for further investigation.
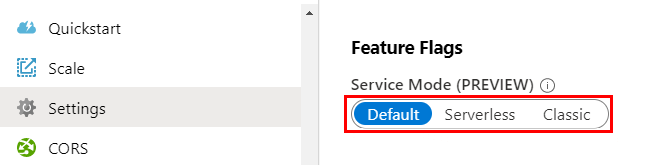
First, you need to check from the Azure portal which ServiceMode is the Azure SignalR Service (also known as ASRS) configured to.
To simplify troubleshooting process, Azure SignalR service provides live trace tool to expose service traces on connectivity and messaging categories. The traces include but aren't limited to connection connected/disconnected events and message received/left events. With live trace tool, you can capture, view, sort, filter and export live traces. For more information, see How to use live trace tool.
When ASRS is in Default mode, there are three roles: Client, Server, and Service:
Client: Client stands for the clients connected to ASRS. The persistent connections connecting client and ASRS are called Client Connections in this guidance.
Server: Server stands for the server that serves client negotiation and hosts SignalR Hub logic. And the persistent connections between Server and ASRS are called Server Connections in this guidance.
Service: Service is the short name for ASRS in this guidance.
There are several ways that can help you narrow down the issue.
If the issue happens right in the way or is repro-able, the straight-forward way is to view the on-going traffic.
If the issue is hard to repro, traces and logs can help.
How to view the traffic and narrow down the issue
Capturing the on-going traffic is the most straight-forward way to narrow down the issue. You can capture the Network traces using the options described below:
For a SignalR persistent connection, it first /negotiate to your hosted app server and then redirected to the Azure SignalR service and then establishes the real persistent connection to Azure SignalR service. Refer to Internals of Azure SignalR Service for the detailed steps.
With the client-side network trace in hand, check which request fails with what status code and what response, and look for solutions inside Troubleshooting Guide.
Server requests
SignalR Server maintains the Server Connection between Server and Service. When the app server starts, it starts the WebSocket connection to Azure SignalR service. All the client traffics are routed through Azure SignalR service to these Server Connections and then dispatched to the Hub. When a Server Connection drops, the clients routed to this Server Connection will be impacted. Our Azure SignalR SDK has a logic "Always Retry" to reconnect the Server Connection with at most 1-minute delay to minimize the effects.
Server Connections can drop because of network instability or regular maintenance of Azure SignalR Service, or your hosted app server updates/maintenance. As long as client-side has the disconnect/reconnect mechanism, the effect is minimal like any client-side caused disconnect-reconnect.
View the server-side network trace to find the status code and error detail why Server Connection drops or is rejected by the Service. Look for the root cause inside Troubleshooting Guide.
Enable server-side logging for ASP.NET Core SignalR
Server-side logging for ASP.NET Core SignalR integrates with the ILogger based logging provided in the ASP.NET Core framework. You can enable server-side logging by using ConfigureLogging, a sample usage as follows:
Logger categories for Azure SignalR always start with Microsoft.Azure.SignalR. To enable detailed logs from Azure SignalR, configure the preceding prefixes to Information level in your appsettings.json file like below:
Check if there are any abnormal warning/error logs recorded.
Enable server-side traces for ASP.NET SignalR
When using SDK version >= 1.0.0, you can enable traces by adding the following to web.config: (Details)
XML
<system.diagnostics><sources><sourcename="Microsoft.Azure.SignalR"switchName="SignalRSwitch"><listeners><addname="ASRS" /></listeners></source></sources><!-- Sets the trace verbosity level --><switches><addname="SignalRSwitch"value="Information" /></switches><!-- Specifies the trace writer for output --><sharedListeners><addname="ASRS"type="System.Diagnostics.TextWriterTraceListener"initializeData="asrs.log.txt" /></sharedListeners><traceautoflush="true" /></system.diagnostics>
Check if there are any abnormal warning/error logs recorded.
How to enable logs inside Azure SignalR service
You can also enable diagnostic logs for Azure SignalR service, these logs provide detailed information of every connection connected to the Azure SignalR service.
Classic mode is obsoleted and isn't encouraged to use. When in Classic mode, Azure SignalR service uses the connected Server Connections to determine if current service is in default mode or serverless mode. Classic mode can lead to intermediate client connectivity issues because, when there's a sudden drop of all the connected Server Connection, for example due to network instability, Azure SignalR believes it's now switched to serverless mode, and clients connected during this period will never be routed to the hosted app server. Enable service-side logs and check if there are any clients recorded as ServerlessModeEntered if you have hosted app server, however, some clients never reach the app server side. If you see any of these clients, abort the client connections, and then let the clients restart.