Get quality checks and insights for a Virtual Instance for SAP solutions
The Quality Insights Azure workbook in Azure Center for SAP solutions provides insights about the SAP system resources as a result of running more than 100 quality checks on the VIS. The feature is part of the monitoring capabilities built in to the Virtual Instance for SAP solutions (VIS). These quality checks make sure that your SAP system uses Azure and SAP best practices for reliability and performance.
In this how-to guide, you'll learn how to use quality checks and insights to get more information about various configurations within your SAP system.
Prerequisites
- An SAP system that you've created with Azure Center for SAP solutions or registered with Azure Center for SAP solutions.
Open Quality Insights workbook
To open the workbook:
Sign in to the Azure portal.
Search for and select Azure Center for SAP solutions in the Azure portal search bar.
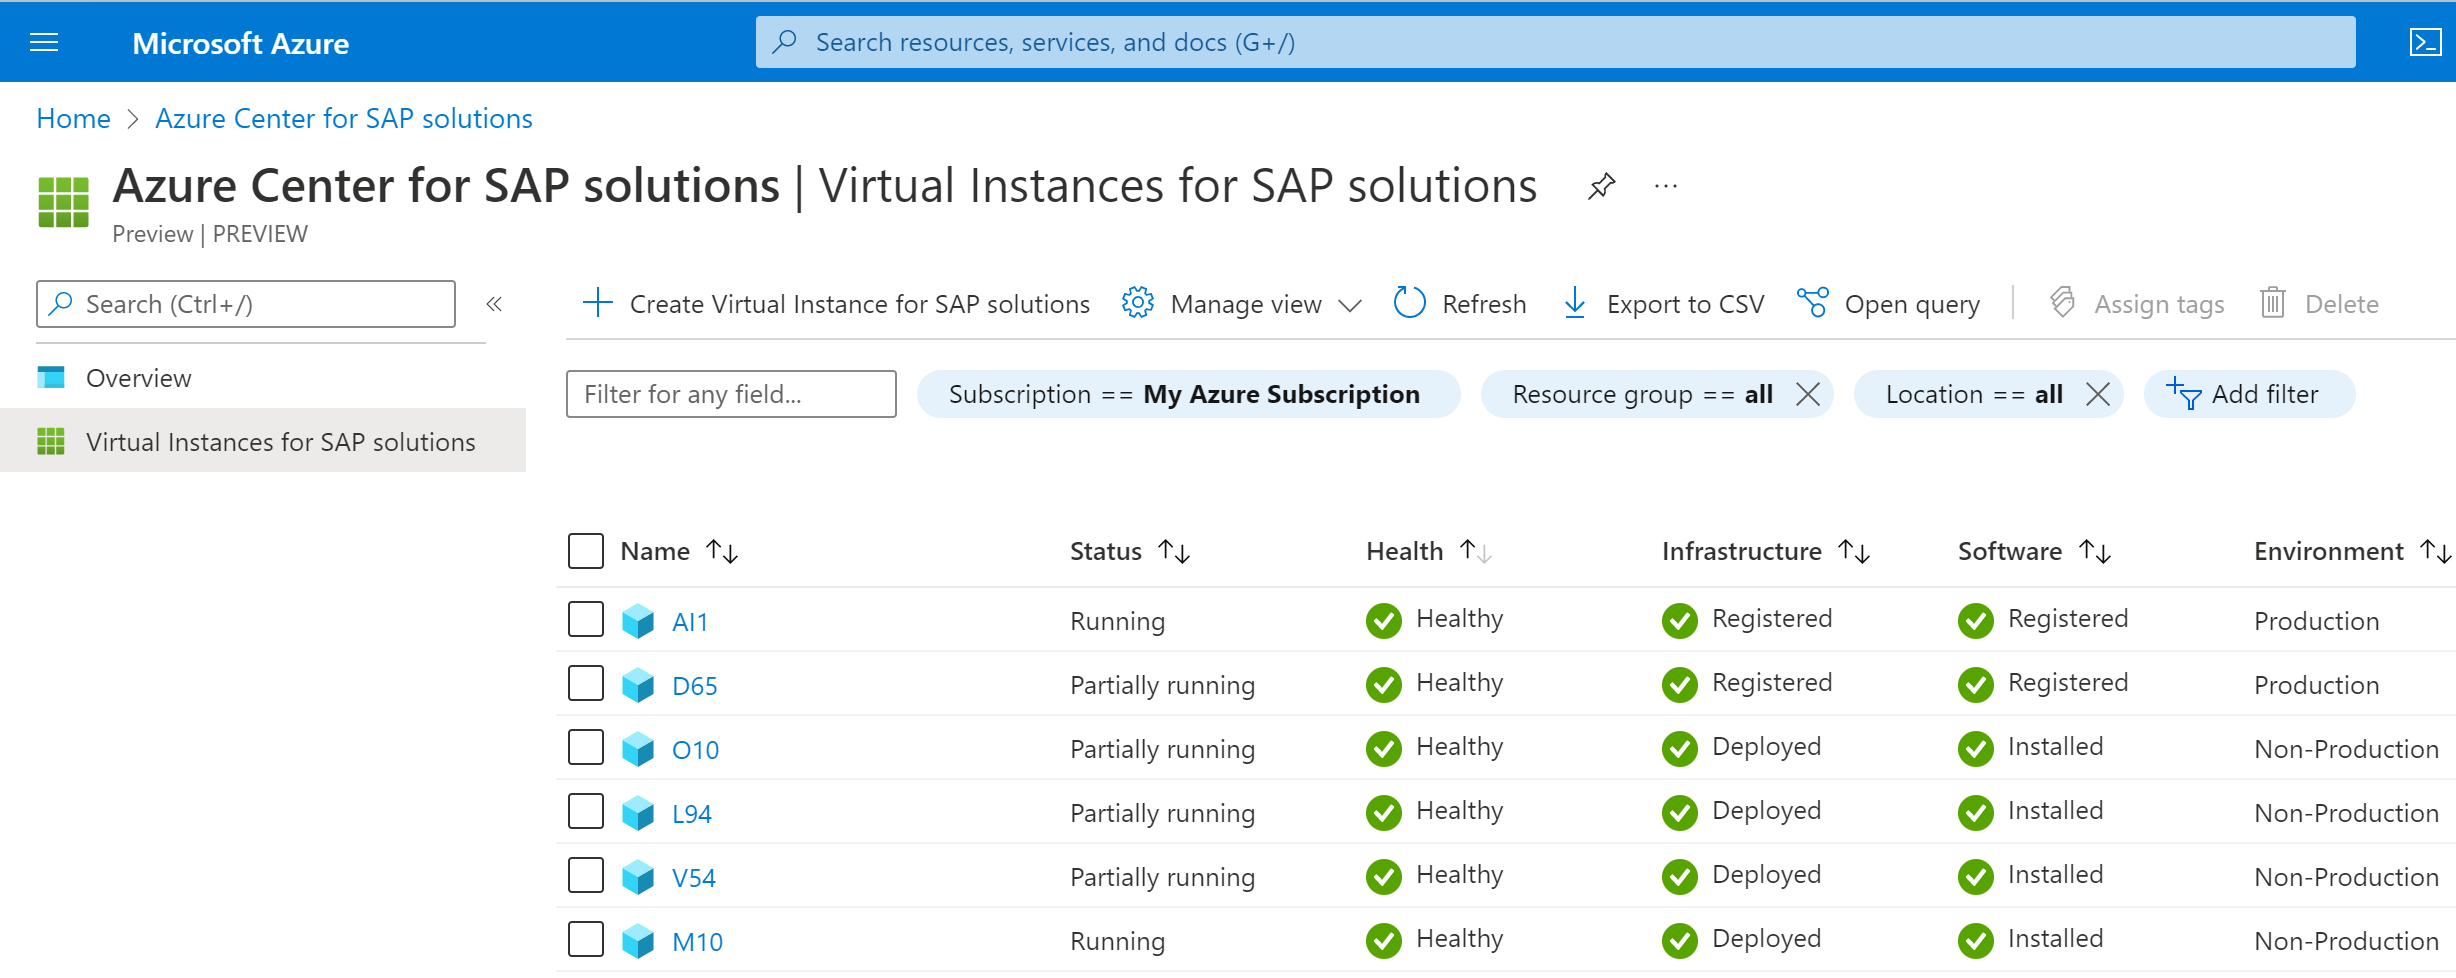
On the Azure Center for SAP solutions page's sidebar menu, select Virtual Instances for SAP solutions.
On the Virtual Instances for SAP solutions page, select the VIS that you want to get insights about.
On the sidebar menu for the VIS, under Monitoring select Quality Insights.
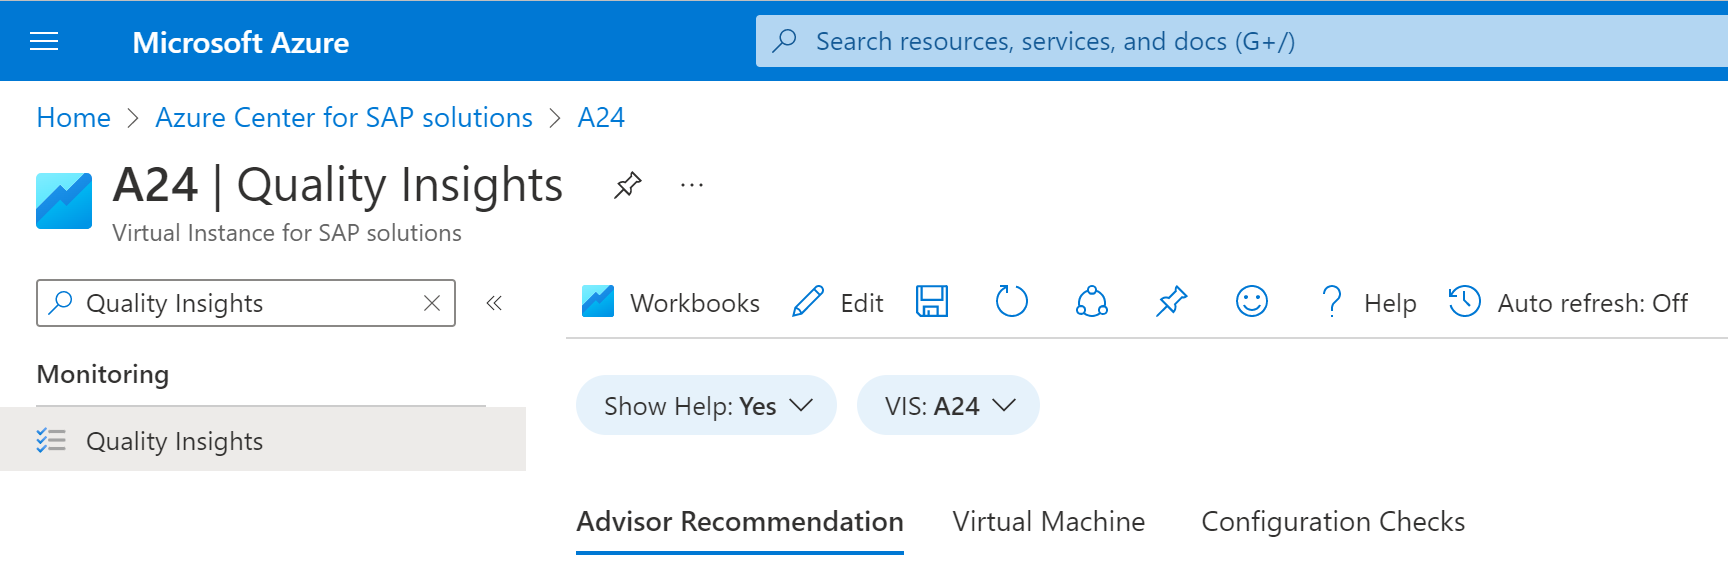


There are multiple sections in the workbook:
- Select the default Advisor Recommendations tab to see the list of recommendations made by Azure Center for SAP solutions for the different instances in your VIS
- Select the Virtual Machine tab to find information about the VMs in your VIS
- Select the Configuration Checks tab to see configuration checks for your VIS
Get Advisor Recommendations
The Quality checks feature in Azure Center for SAP solutions runs validation checks for all VIS resources. These quality checks validate the SAP system configurations follow the best practices recommended for SAP on Azure. If a VIS doesn't follow these best practices, you receive a recommendation from Azure Advisor. Azure Center for SAP solutions runs more than 100 quality checks on all VIS resources. These checks span across the following categories:
- Azure Infrastructure checks
- OS parameter checks.
- High availability (HA) Load Balancer checks
- HANA DB file system checks.
- OS parameter checks for ANF file system.
- Pacemaker configuration checks for HANA DB and ASCS Instance for SUSE and Redhat
- OS Configuration checks for Application Instances
The table in the Advisor Recommendations tab shows all the recommendations for ASCS, Application and Database instances in the VIS.

Select an instance name to see all recommendations, including which action to take to resolve an issue.

Set Alerts for Quality check recommendations
As the Quality checks recommendations in Azure Center for SAP solutions are integrated with Azure Advisor, you can set alerts for the recommendations. See how to Configure alerts for recommendations
Note
These quality checks run on all VIS instances at a regular frequency of once every 1 hour. The corresponding recommendations in Azure Advisor also refresh at the same 1-hour frequency.If you take action on one or more recommendations from Azure Center for SAP solutions, wait for the next refresh to see any new recommendations from Azure Advisor.
Important
Azure Advisor filters out recommendations for Deleted Azure resources for 7 days. Therefore, if you delete a VIS and then re-register it, you will be able to see Advisor recommendations after 7 days of re-registration.
Get VM information
The Virtual Machine tab provides insights about the VMs in your VIS. There are multiple subsections:
Azure Compute
The Azure Compute tab shows a summary graph of the VMs inside the VIS.

Compute List
The Compute List tab shows a table of information about the VMs inside the VIS. This information includes the VM's name and state, SKU, OS, publisher, image version and SKU, offer, Azure region, resource group, tags, and more.
You can toggle Show Help to see more information about the table data.
Select a VM name to see its overview page, and change settings like Boot Diagnostic.

Compute Extensions
The Compute Extensions tab shows information about your VM extensions. There are three tabs within this section:
VM + Extensions
VM+Extensions shows a summary of any VM extensions installed on the VMs in your VIS.

VM Extensions Status
VM Extensions Status shows details about the VM extensions in each VM. You can see each extension's state, version, and if AutoUpgrade is enabled.

Failed VM Extensions
Failed VM Extensions shows which VM extensions are failing in the selected VIS.

Compute + OS Disk
The Compute+OS Disk tab shows a table with OS disk configurations in the SAP system.

Compute + Data Disks
The Compute+Data Disks tab shows a table with data disk configurations in the SAP system.

Run configuration checks
The Configuration Checks tab provides configuration checks for the VMs in your VIS. There are four subsections:
Accelerated Networking
The Accelerated Networking tab shows if Accelerated Networking State is enabled for each NIC in the VIS. It's recommended to enable this setting for reliability and performance.

Public IP
The Public IP tab shows any public IP addresses that are associated with the NICs linked to the VMs in the VIS.

Backup
The Backup tab shows a table of VMs that don't have Azure Backup configured. It's recommended to use Azure Backup with your VMs.

Load Balancer
The Load Balancer tab shows information about load balancers connected to the resource group(s) for the VIS. There are two subsections: Load Balancer Overview and Load Balancer Monitor.
Load Balancer Overview
The Load Balancer Overview tab shows rules and details for the load balancers in the VIS. You can review:
- If the HA ports are defined for the load balancers.
- If the load balancers have floating IP addresses enabled.
- If the keep-alive functionality is enabled, with a maximum timeout of 30 minutes.

Load Balancer Monitor
The Load Balancer Monitor tab shows monitoring information for the load balancers. You can filter the information by load balancer and time range.
Load Balancer Key Metrics, which is a table that shows important information about the load balancers in the subscription where the VIS exists.

Backend health probe by Backend IP, which is a chart that shows the health probe status for each load balancer over time.

Next steps
Feedback
Coming soon: Throughout 2024 we will be phasing out GitHub Issues as the feedback mechanism for content and replacing it with a new feedback system. For more information see: https://aka.ms/ContentUserFeedback.
Submit and view feedback for