Tutorial: Ingest and query monitoring data in Azure Data Explorer
Article
This tutorial will teach you how to ingest data from diagnostic and activity logs to an Azure Data Explorer cluster without writing code. With this simple ingestion method, you can quickly begin querying Azure Data Explorer for data analysis.
In this tutorial, you'll learn how to:
Create tables and ingestion mapping in an Azure Data Explorer database.
Format the ingested data by using an update policy.
Create an event hub and connect it to Azure Data Explorer.
An Azure Data Explorer cluster and database. Create a cluster and database. In this tutorial, the database name is TestDatabase.
Azure Monitor data provider: diagnostic metrics and logs and activity logs
View and understand the data provided by the Azure Monitor diagnostic metrics and logs and activity logs below. You'll create an ingestion pipeline based on these data schemas. Note that each event in a log has an array of records. This array of records will be split later in the tutorial.
Examples of diagnostic metrics and logs and activity logs
Azure diagnostic metrics and logs and activity logs are emitted by an Azure service and provide data about the operation of that service.
Diagnostic metrics are aggregated with a time grain of 1 minute. Following is an example of an Azure Data Explorer metric-event schema on query duration:
Azure activity logs are subscription-level logs that provide insight into the operations performed on resources in your subscription. Following is an example of an activity-log event for checking access:
Set up an ingestion pipeline in Azure Data Explorer
Setting up an Azure Data Explorer pipeline involves several steps, such as table creation and data ingestion. You can also manipulate, map, and update the data.
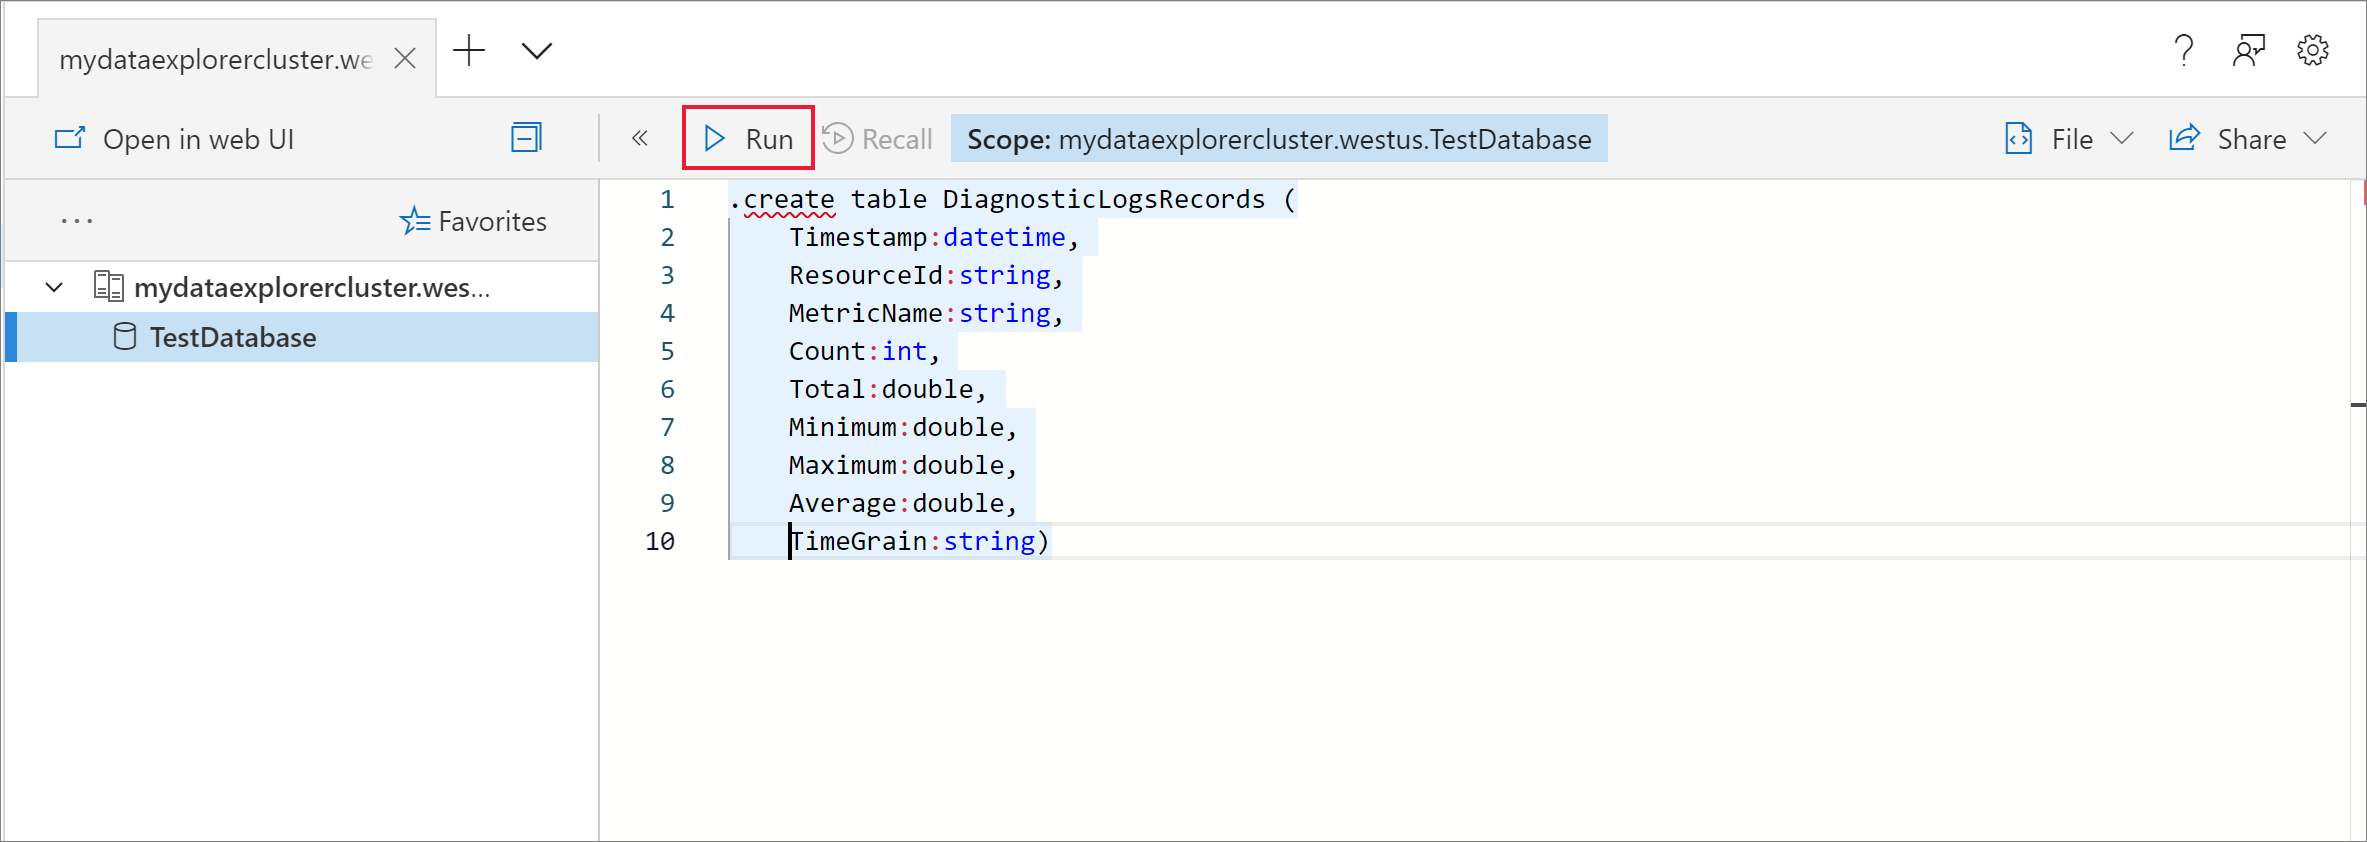
Connect to the Azure Data Explorer web UI
In your Azure Data Explorer TestDatabase database, select Query to open the Azure Data Explorer web UI.
Create the target tables
The structure of the Azure Monitor logs isn't tabular. You'll manipulate the data and expand each event to one or more records. The raw data will be ingested to an intermediate table named ActivityLogsRawRecords for activity logs and DiagnosticRawRecords for diagnostic metrics and logs. At that time, the data will be manipulated and expanded. Using an update policy, the expanded data will then be ingested into the ActivityLogs table for activity logs, DiagnosticMetrics for diagnostic metrics and DiagnosticLogs for diagnostic logs. This means that you'll need to create two separate tables for ingesting activity logs and three separate tables for ingesting diagnostic metrics and logs.
Use the Azure Data Explorer web UI to create the target tables in the Azure Data Explorer database.
In the TestDatabase database, create a table named DiagnosticMetrics to store the diagnostic metrics records. Use the following .create table management command:
Create the intermediate data table named DiagnosticRawRecords in the TestDatabase database for data manipulation using the following query. Select Run to create the table.
In the TestDatabase database, create a table named DiagnosticLogs to store the diagnostic log records. Use the following .create table management command:
Create the intermediate data table named DiagnosticRawRecords in the TestDatabase database for data manipulation using the following query. Select Run to create the table.
Create a table named ActivityLogs in the TestDatabase database to receive activity log records. To create the table, run the following Azure Data Explorer query:
Because the data format is json, data mapping is required. The json mapping maps each json path to a table column name. JSON paths that include special characters should be escaped as ['Property Name']. For more information, see JSONPath syntax.
Create a function that expands the collection of diagnostic metric records so that each value in the collection receives a separate row. Use the mv-expand operator:
Add the update policy to the target table. This policy will automatically run the query on any newly ingested data in the DiagnosticRawRecords intermediate data table and ingest its results into the DiagnosticMetrics table:
Create a function that expands the collection of diagnostic logs records so that each value in the collection receives a separate row. You'll enable ingestion logs on an Azure Data Explorer cluster, and use ingestion logs schema. You'll create one table for succeeded and for failed ingestion, while some of the fields will be empty for succeeded ingestion (ErrorCode for example). Use the mv-expand operator:
Add the update policy to the target table. This policy will automatically run the query on any newly ingested data in the DiagnosticRawRecords intermediate data table and ingest its results into the DiagnosticLogs table:
Create a function that expands the collection of activity log records so that each value in the collection receives a separate row. Use the mv-expand operator:
Add the update policy to the target table. This policy will automatically run the query on any newly ingested data in the ActivityLogsRawRecords intermediate data table and ingest its results into the ActivityLogs table:
Azure diagnostic settings enable exporting metrics and logs to a storage account or to an event hub. In this tutorial, we'll route the metrics and logs via an event hub. You'll create an event hub namespace and an event hub for the diagnostic metrics and logs in the following steps. Azure Monitor will create the event hub insights-operational-logs for the activity logs.
Create an event hub by using an Azure Resource Manager template in the Azure portal. To follow the rest of the steps in this article, right-click the Deploy to Azure button, and then select Open in new window. The Deploy to Azure button takes you to the Azure portal.
Connect diagnostic metrics and logs to your event hub
Select a resource from which to export metrics. Several resource types support exporting diagnostic data, including event hubs namespace, Azure Key Vault, Azure IoT Hub, and Azure Data Explorer clusters. In this tutorial, we'll use an Azure Data Explorer cluster as our resource, we'll review query performance metrics and ingestion results logs.
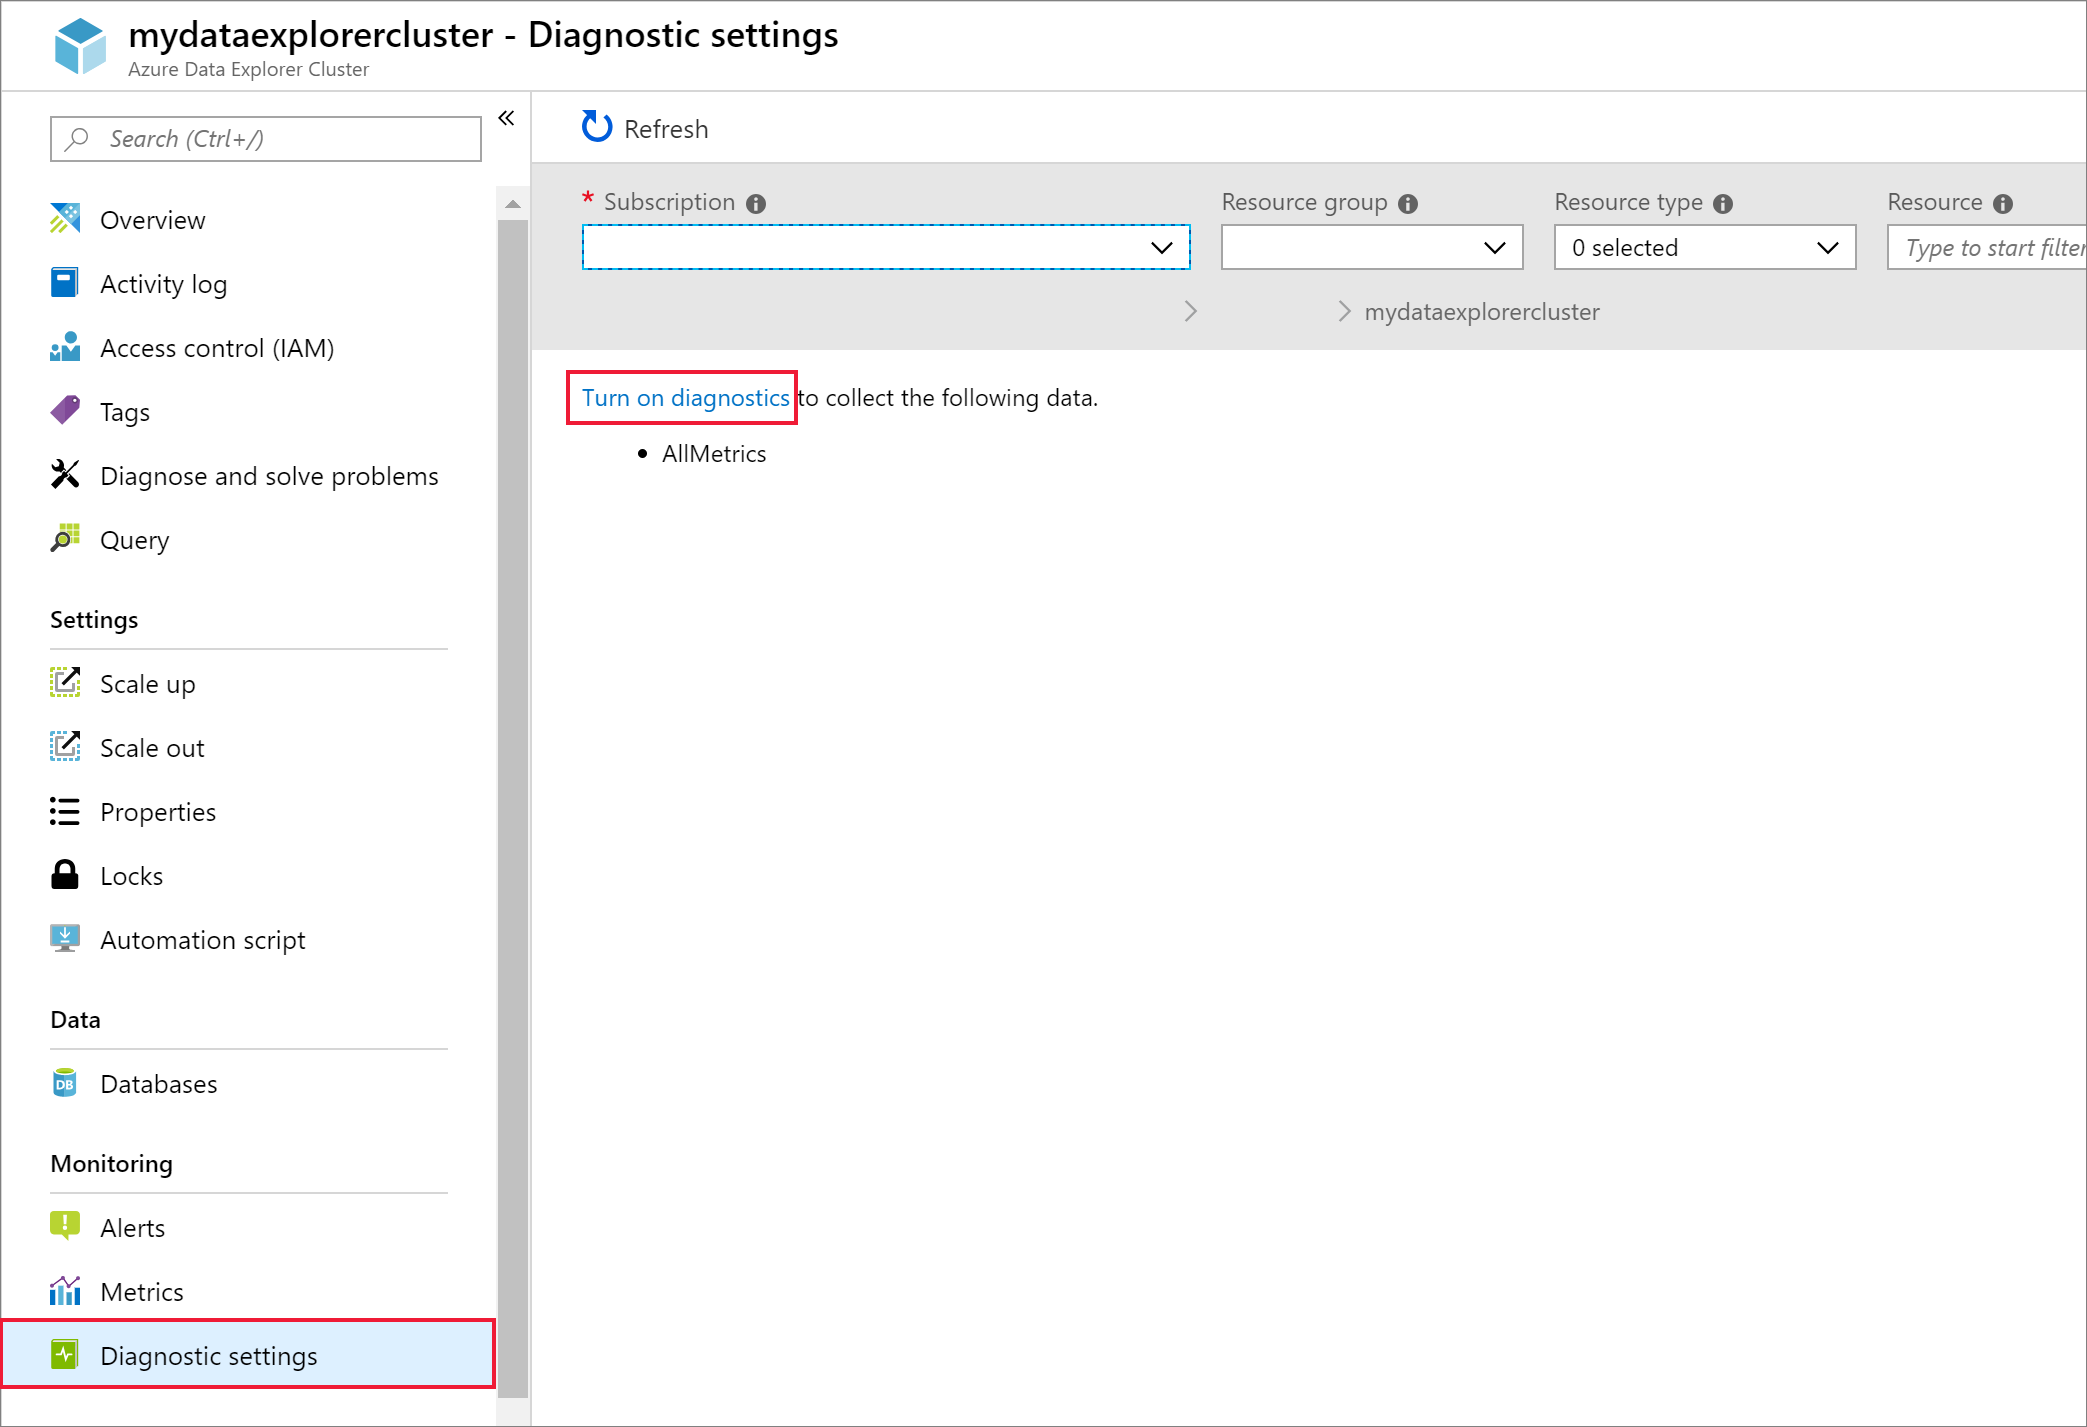
Select your Kusto cluster in the Azure portal.
Select Diagnostic settings, and then select the Turn on diagnostics link.
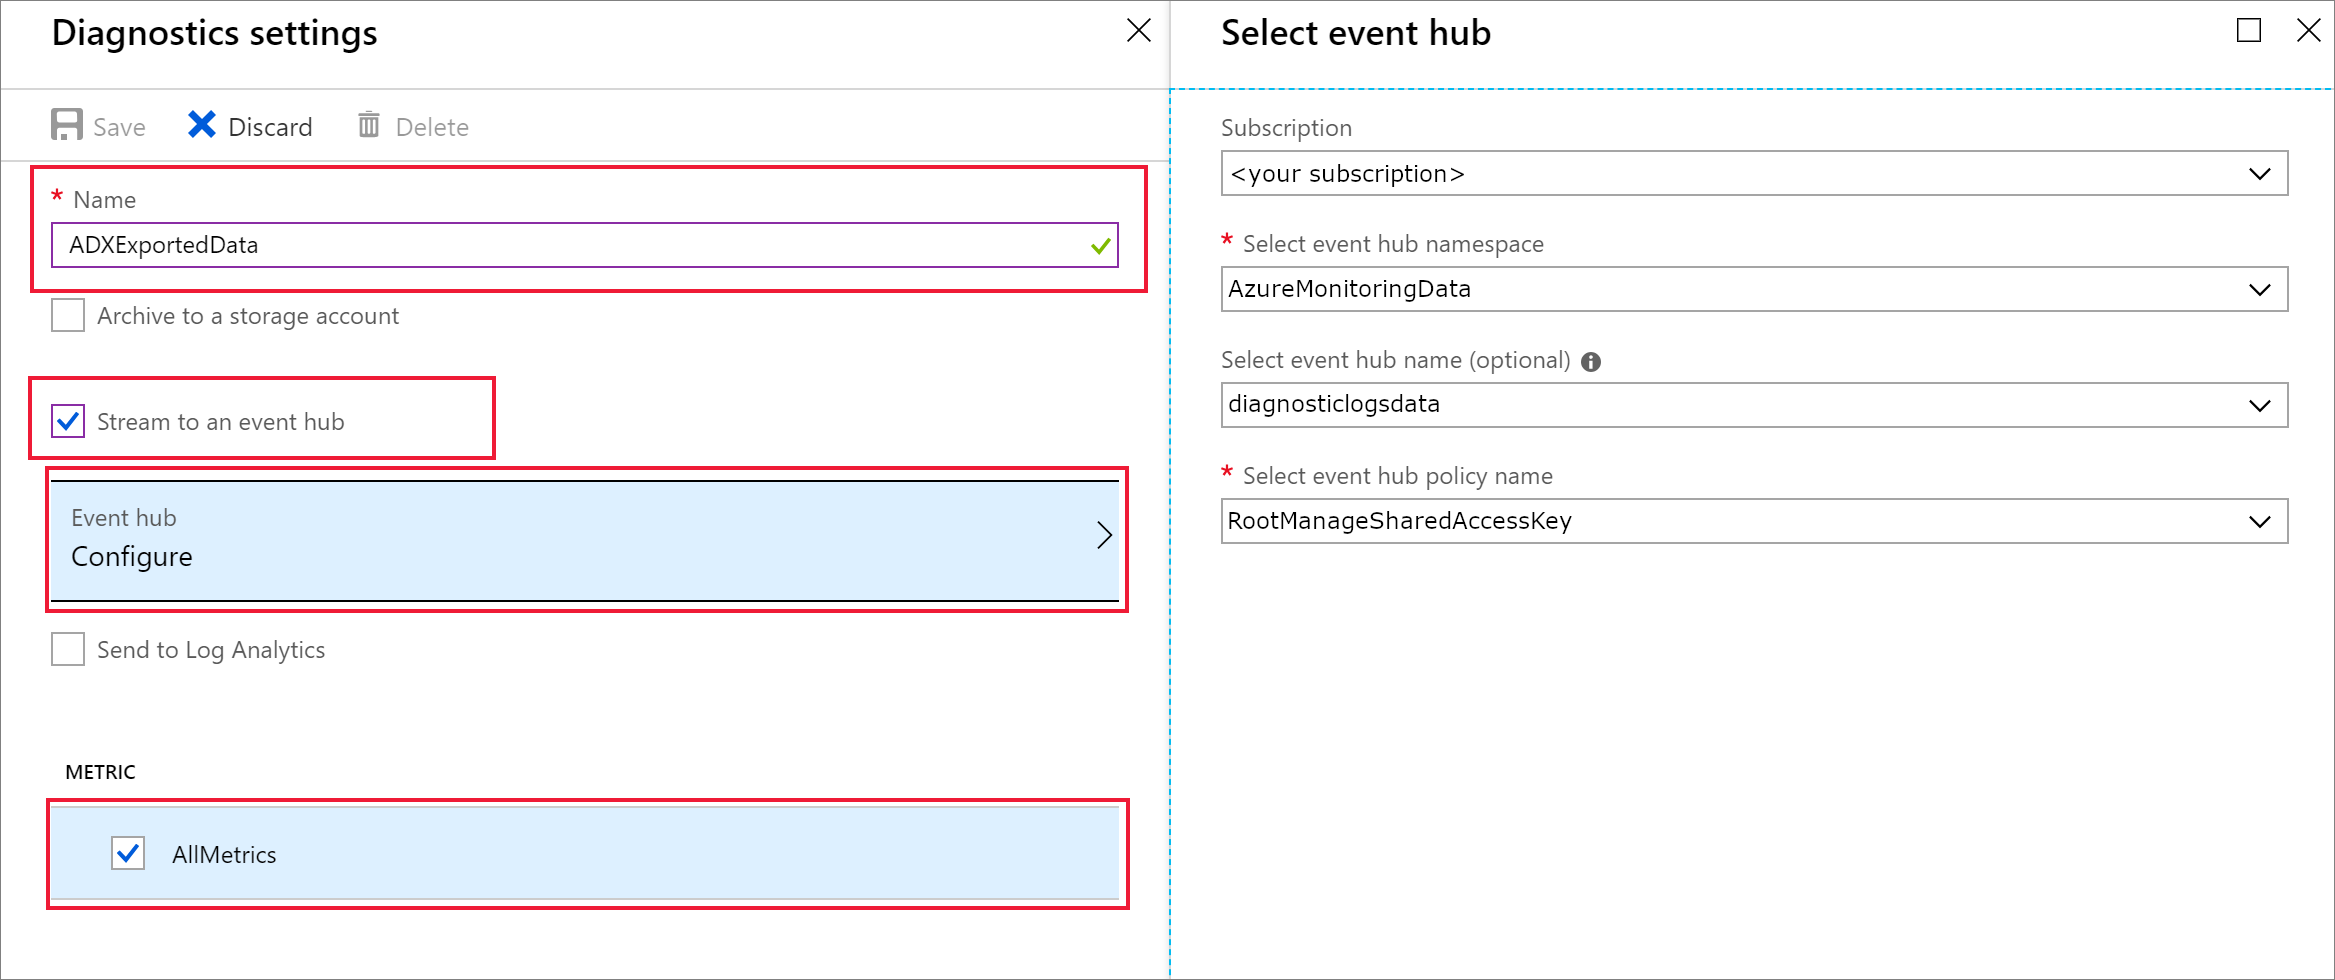
The Diagnostics settings pane opens. Take the following steps:
Give your diagnostics log data the name ADXExportedData.
Under LOG, select both SucceededIngestion and FailedIngestion check boxes.
Under METRIC, select the Query performance check box.
Select the Stream to an event hub check box.
Select Configure.
In the Select event hub pane, configure how to export data from diagnostic logs to the event hub you created:
In the Select event hub namespace list, select AzureMonitoringData.
In the Select event hub name list, select DiagnosticData.
In the Select event hub policy name list, select RootManagerSharedAccessKey.
Select OK.
Select Save.
Connect activity logs to your event hub
In the left menu of the Azure portal, select Activity log.
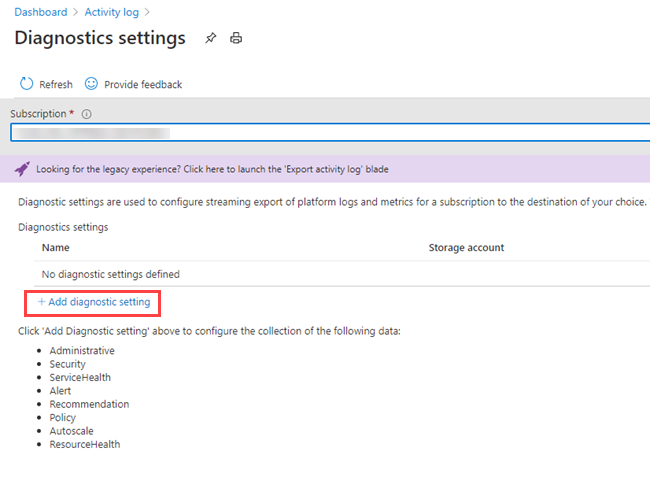
The Activity log window opens. Select Diagnostics settings.
The Diagnostics settings window opens. Select + Add diagnostic setting.
A new Diagnostic setting window opens.
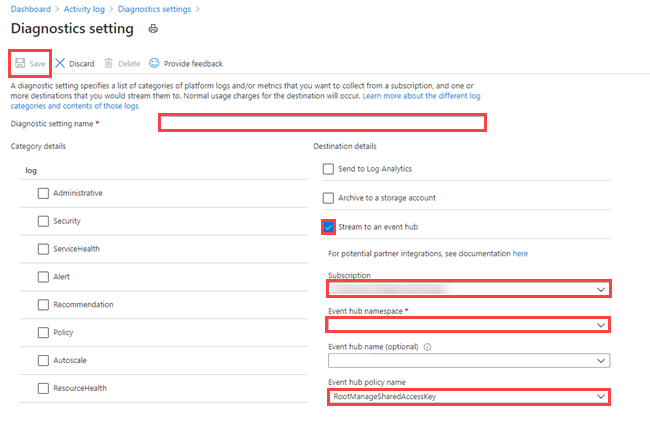
Do the following steps:
Enter a name in the Diagnostic setting name field.
On the left-hand side of check boxes, select the platform log(s) you wish to collect from a subscription.
Select the Stream to an event hub check box.
Select your subscription.
In the Event hub namespace list, select AzureMonitoringData.
Optionally, select your Event hub name.
In the Event hub policy name list, select the default event hub policy name.
In the upper-left corner of the window, select Save. An event hub with the name insights-operational-logs will be created (unless you've selected an Event hub name above).
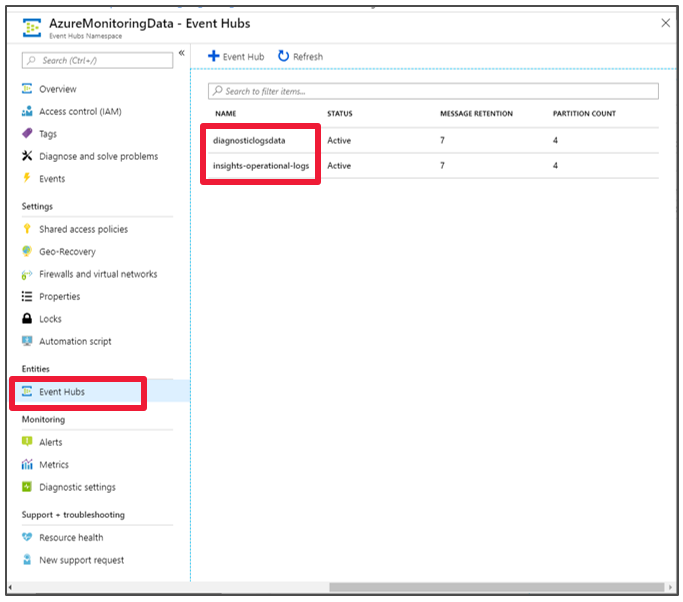
See data flowing to your event hubs
Wait a few minutes until the connection is defined, and the activity-log export to the event hub is finished. Go to your event hubs namespace to see the event hubs you created.
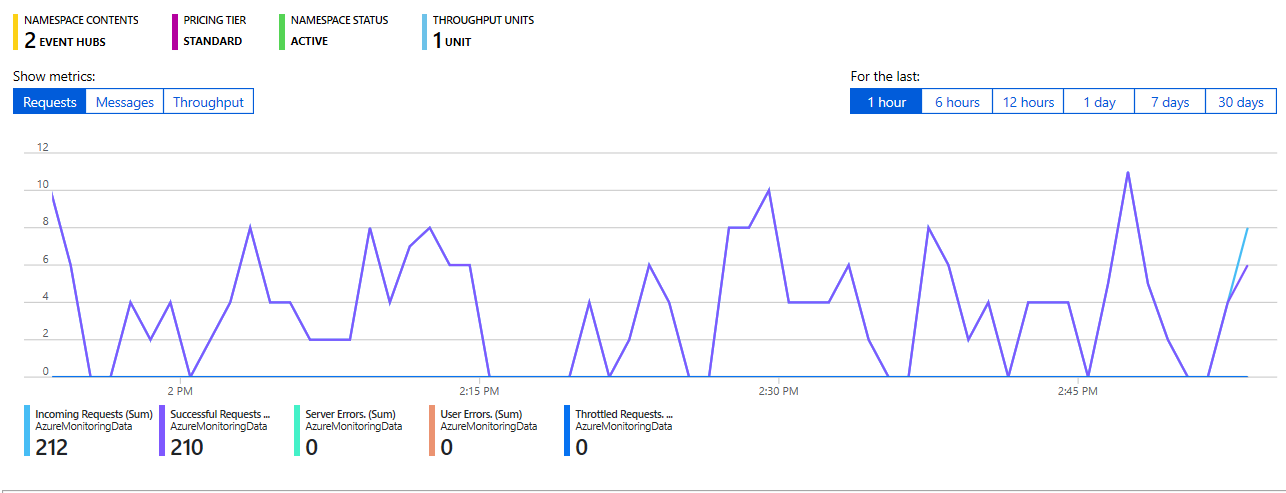
See data flowing to your event hub:
Connect an event hub to Azure Data Explorer
Now you need to create the data connections for your diagnostic metrics and logs and activity logs.
Create the data connection for diagnostic metrics and logs and activity logs
In your Azure Data Explorer cluster named kustodocs, select Databases in the left menu.
In the Databases window, select your TestDatabase database.
In the left menu, select Data ingestion.
In the Data ingestion window, select + Add Data Connection.
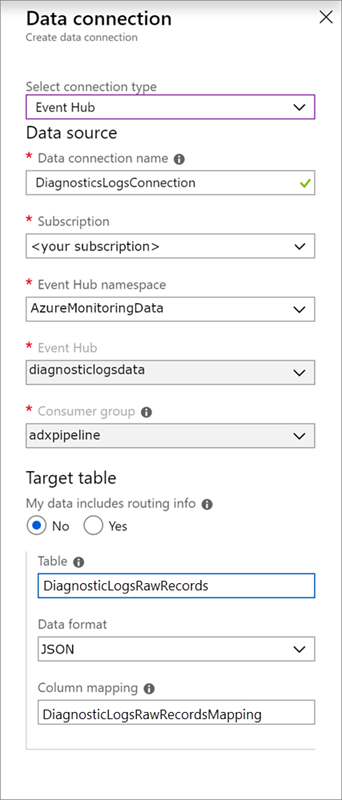
In the Data connection window, enter the following information:
Use the following settings in the Data Connection window:
Data source:
Setting
Suggested value
Field description
Data connection name
DiagnosticsLogsConnection
The name of the connection you want to create in Azure Data Explorer.
Event hub namespace
AzureMonitoringData
The name you chose earlier that identifies your namespace.
Event hub
DiagnosticData
The event hub you created.
Consumer group
adxpipeline
The consumer group defined in the event hub you created.
Target table:
There are two options for routing: static and dynamic. For this tutorial, you'll use static routing (the default), where you specify the table name, the data format, and the mapping. Leave My data includes routing info unselected.
Setting
Suggested value
Field description
Table
DiagnosticRawRecords
The table you created in the TestDatabase database.
Data format
JSON
The format used in the table.
Column mapping
DiagnosticRawRecordsMapping
The mapping you created in the TestDatabase database, which maps incoming JSON data to the column names and data types of the DiagnosticRawRecords table.
Select Create.
Use the following settings in the Data Connection window:
Data source:
Setting
Suggested value
Field description
Data connection name
ActivityLogsConnection
The name of the connection you want to create in Azure Data Explorer.
Event hub namespace
AzureMonitoringData
The name you chose earlier that identifies your namespace.
Event hub
insights-operational-logs
The event hub you created.
Consumer group
$Default
The default consumer group. If needed, you can create a different consumer group.
Target table:
There are two options for routing: static and dynamic. For this tutorial, you'll use static routing (the default), where you specify the table name, data format, and mapping. Leave My data includes routing info unselected.
Setting
Suggested value
Field description
Table
ActivityLogsRawRecords
The table you created in the TestDatabase database.
Data format
JSON
The format used in the table.
Column mapping
ActivityLogsRawRecordsMapping
The mapping you created in the TestDatabase database, which maps incoming JSON data to the column names and data types of the ActivityLogsRawRecords table.
Select Create.
Query the new tables
You now have a pipeline with data flowing. Ingestion via the cluster takes 5 minutes by default, so allow the data to flow for a few minutes before beginning to query.
The following query analyzes query duration data from diagnostic metric records in Azure Data Explorer:
Kusto
DiagnosticMetrics
| where Timestamp > ago(15m) and MetricName == 'QueryDuration'
| summarizeavg(Average)
Query results:
avg_Average
00:06.156
Query the diagnostic logs table
This pipeline produces ingestions via an event hub. You'll review the results of these ingestions.
The following query analyzes how many ingestions accrued in a minute, including a sample of Database, Table and IngestionSourcePath for each interval:
Kusto
DiagnosticLogs
| where Timestamp > ago(15m) and OperationName has'INGEST'
| summarizecount(), take_any(Database, Table, IngestionSourcePath) by bin(Timestamp, 1m)