series_periods_detect()
Finds the most significant periods that exist in a time series.
Syntax
series_periods_detect(series, min_period, max_period, num_periods)
Learn more about syntax conventions.
Parameters
| Name | Type | Required | Description |
|---|---|---|---|
| series | dynamic |
✔️ | An array of numeric values, typically the resulting output of the make-series or make_list operators. |
| min_period | real |
✔️ | The minimal period for which to search. |
| max_period | real |
✔️ | The maximal period for which to search. |
| num_periods | long |
✔️ | The maximum required number of periods. This number will be the length of the output dynamic arrays. |
Important
- The algorithm can detect periods containing at least 4 points and at most half of the series length.
- Set the min_period a little below and max_period a little above the periods you expect to find in the time series. For example, if you have an hourly aggregated signal, and you look for both daily and weekly periods (24 and 168 hours respectively), you can set min_period=0.8*24, max_period=1.2*168, and leave 20% margins around these periods.
- The input time series must be regular. That is, aggregated in constant bins, which is always the case if it has been created using make-series. Otherwise, the output is meaningless.
Returns
The function outputs a table with two columns:
- periods: A dynamic array containing the periods that have been found, in units of the bin size, ordered by their scores.
- scores: A dynamic array containing values between 0 and 1. Each array measures the significance of a period in its respective position in the periods array.
Example
The following query embeds a snapshot of a month of an application’s traffic, aggregated twice a day. The bin size is 12 hours.
print y=dynamic([80, 139, 87, 110, 68, 54, 50, 51, 53, 133, 86, 141, 97, 156, 94, 149, 95, 140, 77, 61, 50, 54, 47, 133, 72, 152, 94, 148, 105, 162, 101, 160, 87, 63, 53, 55, 54, 151, 103, 189, 108, 183, 113, 175, 113, 178, 90, 71, 62, 62, 65, 165, 109, 181, 115, 182, 121, 178, 114, 170])
| project x=range(1, array_length(y), 1), y
| render linechart
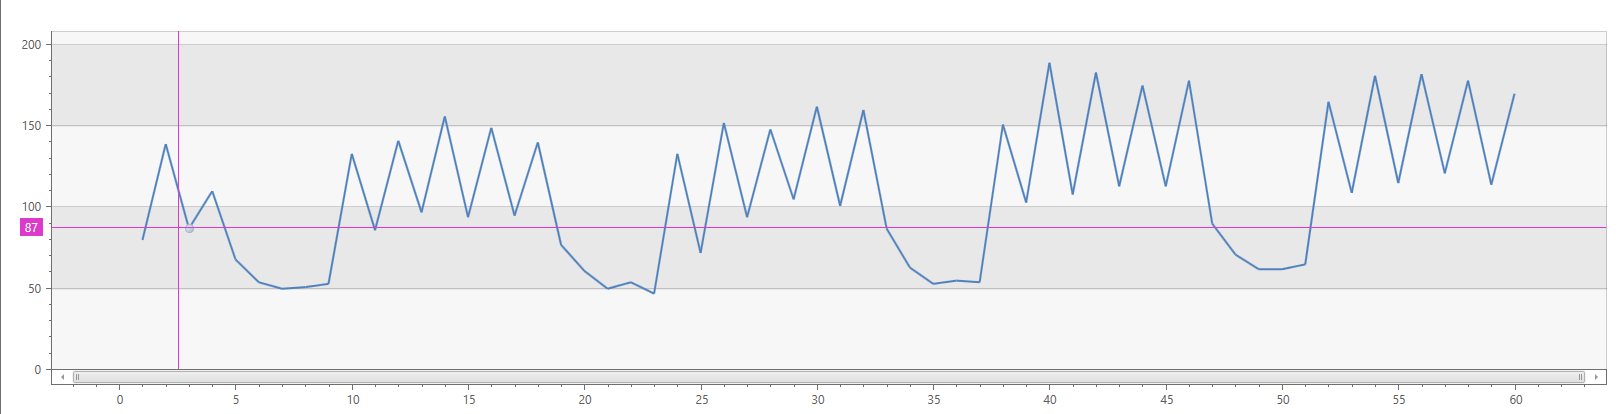
Running series_periods_detect() on this series, results in the weekly period, 14 points long.
print y=dynamic([80, 139, 87, 110, 68, 54, 50, 51, 53, 133, 86, 141, 97, 156, 94, 149, 95, 140, 77, 61, 50, 54, 47, 133, 72, 152, 94, 148, 105, 162, 101, 160, 87, 63, 53, 55, 54, 151, 103, 189, 108, 183, 113, 175, 113, 178, 90, 71, 62, 62, 65, 165, 109, 181, 115, 182, 121, 178, 114, 170])
| project x=range(1, array_length(y), 1), y
| project series_periods_detect(y, 0.0, 50.0, 2)
Output
| series_periods_detect_y_periods | series_periods_detect_y_periods_scores |
|---|---|
| [14.0, 0.0] | [0.84, 0.0] |
Note
The daily period that can be also seen in the chart wasn't found because the sampling is too coarse (12h bin size), so a daily period of 2 bins is below the minimum period size of 4 points, required by the algorithm.
Feedback
Coming soon: Throughout 2024 we will be phasing out GitHub Issues as the feedback mechanism for content and replacing it with a new feedback system. For more information see: https://aka.ms/ContentUserFeedback.
Submit and view feedback for