Monitor Data Flows
APPLIES TO:  Azure Data Factory
Azure Synapse Analytics
Azure Data Factory
Azure Synapse Analytics
Tip
Try out Data Factory in Microsoft Fabric, an all-in-one analytics solution for enterprises. Microsoft Fabric covers everything from data movement to data science, real-time analytics, business intelligence, and reporting. Learn how to start a new trial for free!
After you have completed building and debugging your data flow, you want to schedule your data flow to execute on a schedule within the context of a pipeline. You can schedule the pipeline using Triggers. For testing and debugging your data flow from a pipeline, you can use the Debug button on the toolbar ribbon or Trigger Now option from the Pipeline Builder to execute a single-run execution to test your data flow within the pipeline context.
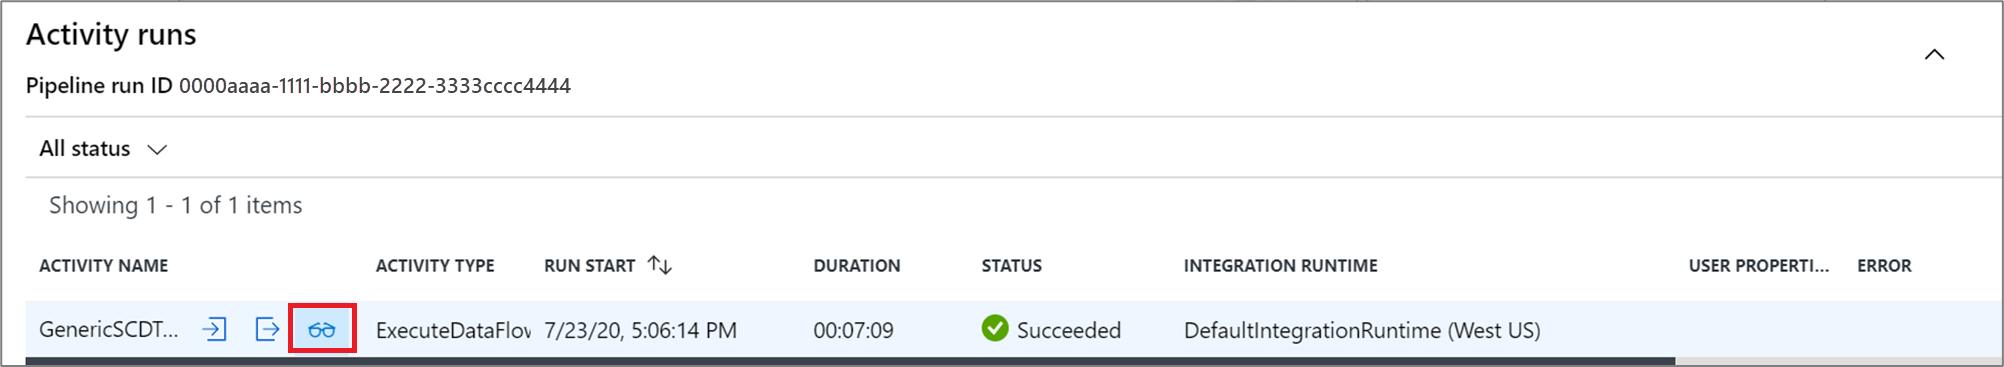
When you execute your pipeline, you can monitor the pipeline and all of the activities contained in the pipeline including the Data Flow activity. Select the monitor icon in the left-hand UI panel. You can see a screen similar to the one that follows. The highlighted icons allow you to drill into the activities in the pipeline, including the Data Flow activity.
You see statistics at this level as well including the run times and status. The Run ID at the activity level is different than the Run ID at the pipeline level. The Run ID at the previous level is for the pipeline. Selecting the eyeglasses gives you deep details on your data flow execution.
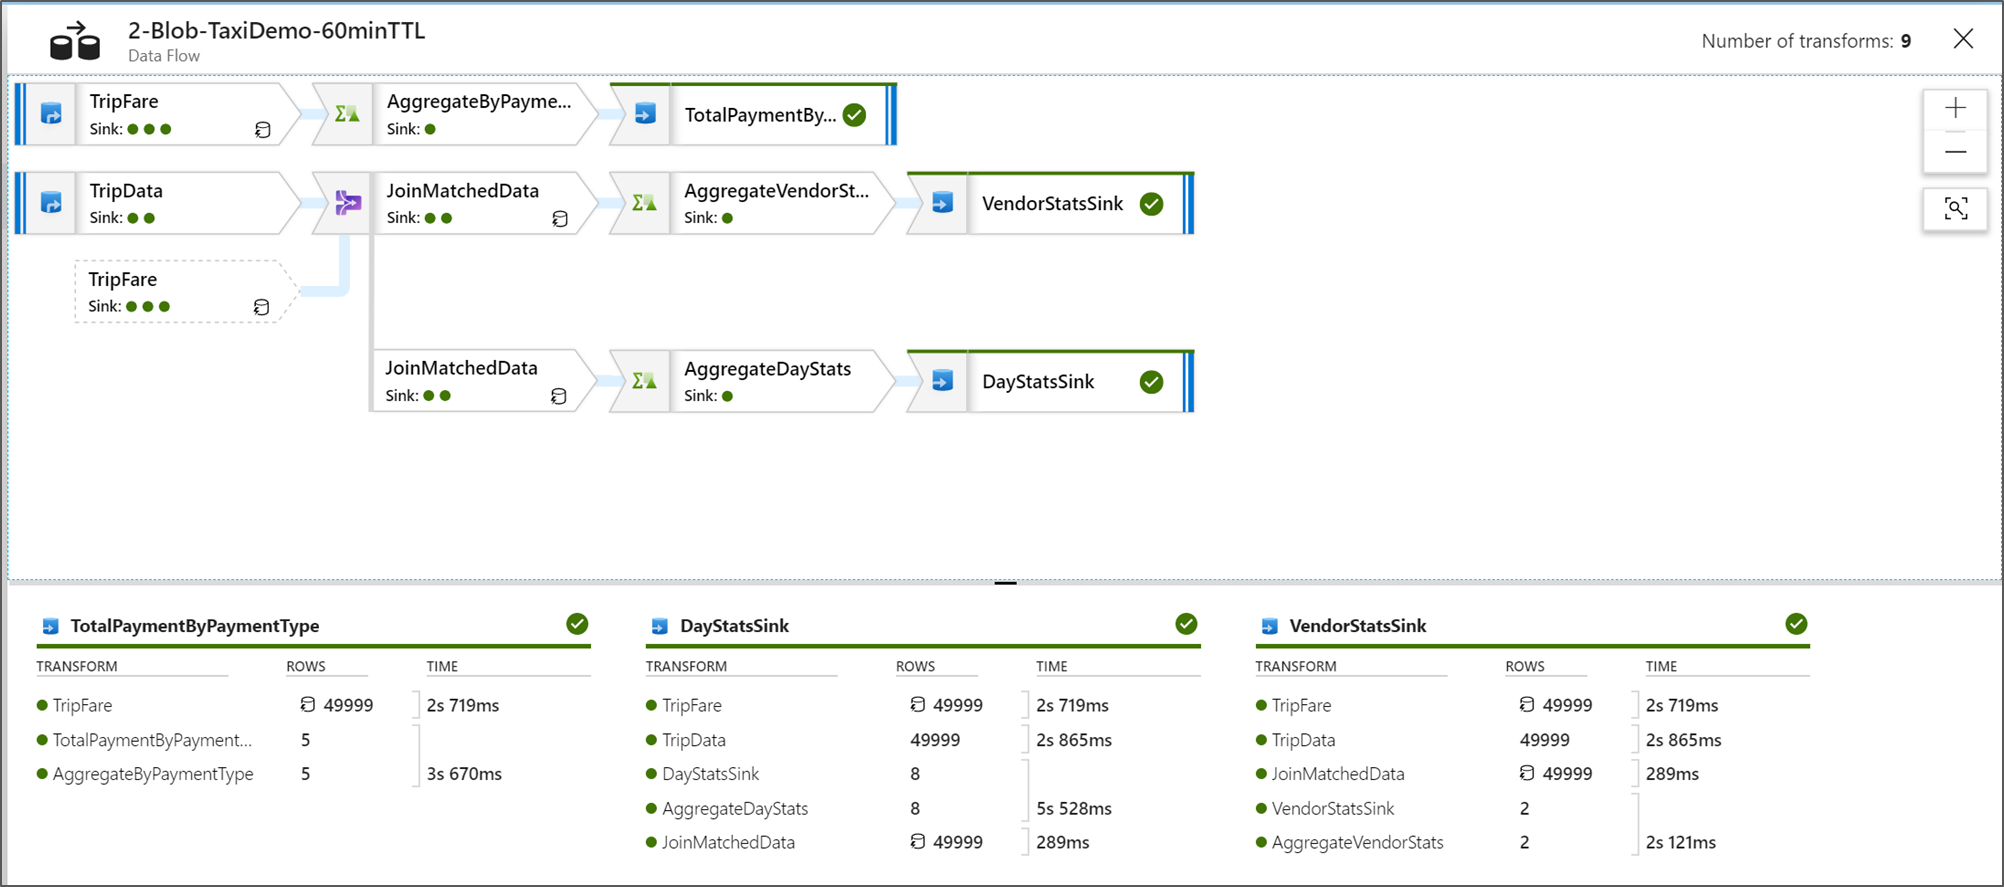
When you're in the graphical node monitoring view, you can see a simplified view-only version of your data flow graph. To see the details view with larger graph nodes that include transformation stage labels, use the zoom slider on the right side of your canvas. You can also use the search button on the right side to find parts of your data flow logic in the graph.
View Data Flow Execution Plans
When your Data Flow is executed in Spark, the service determines optimal code paths based on the entirety of your data flow. Additionally, the execution paths might occur on different scale-out nodes and data partitions. Therefore, the monitoring graph represents the design of your flow, taking into account the execution path of your transformations. When you select individual nodes, you can see "stages" that represent code that was executed together on the cluster. The timings and counts that you see represent those groups or stages as opposed to the individual steps in your design.
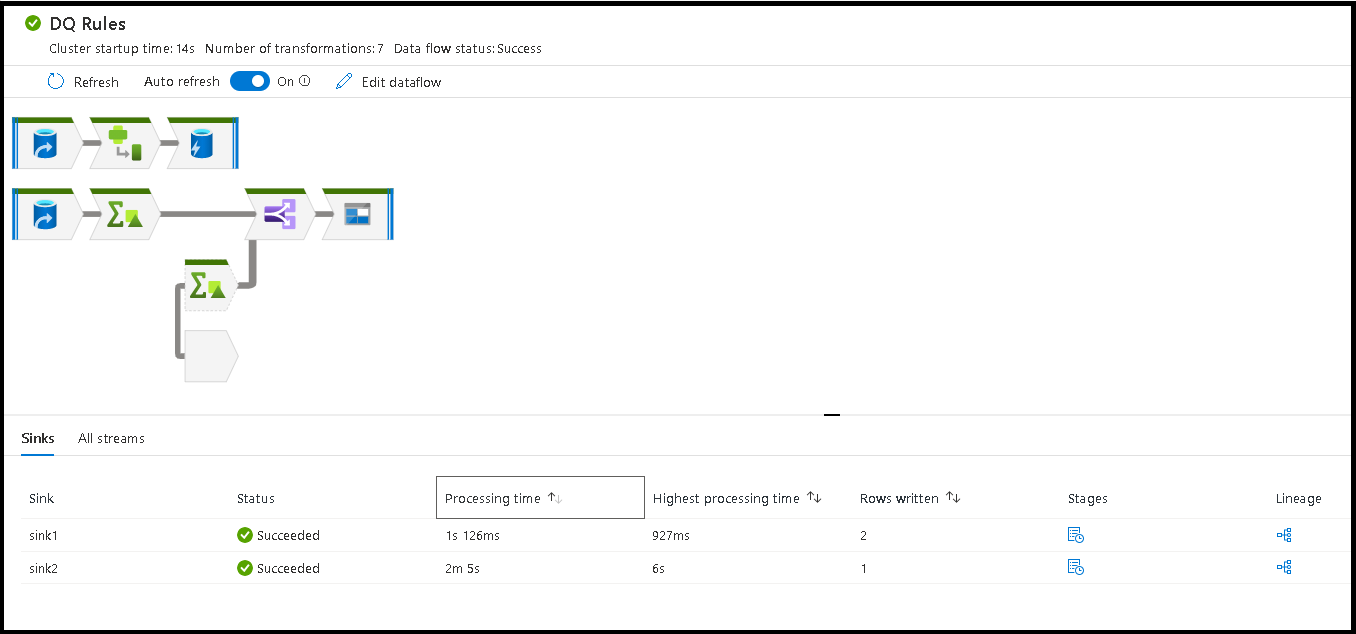
When you select the open space in the monitoring window, the stats in the bottom pane display timing and row counts for each Sink and the transformations that led to the sink data for transformation lineage.
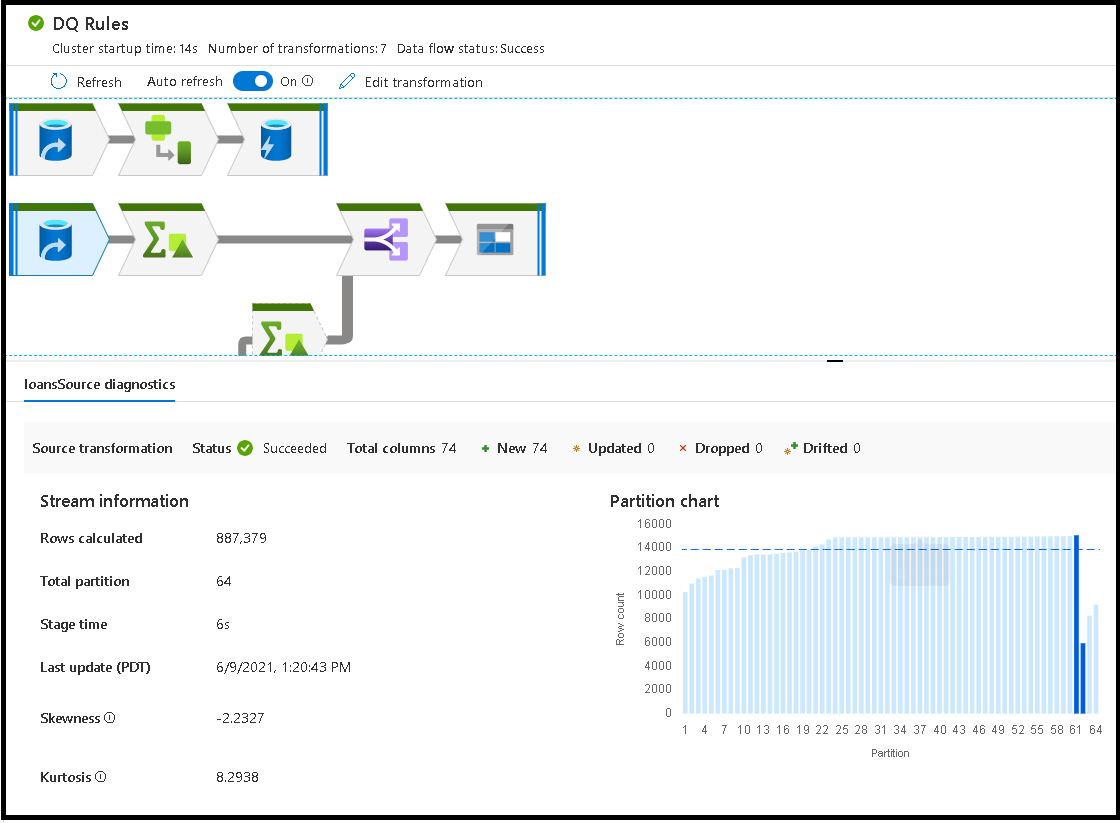
When you select individual transformations, you receive extra feedback on the right-hand panel that shows partition stats, column counts, skewness (how evenly is the data distributed across partitions), and kurtosis (how spiky is the data).
Sorting by processing time helps you to identify which stages in your data flow took the most time.
To find which transformations inside each stage took the most time, sort on highest processing time.
The *rows written are also sortable as a way to identify which streams inside your data flow are writing the most data.
When you select the Sink in the node view, you can see column lineage. There are three different methods that columns are accumulated throughout your data flow to land in the Sink. They are:
- Computed: You use the column for conditional processing or within an expression in your data flow, but don't land it in the Sink
- Derived: The column is a new column that you generated in your flow, that is, it wasn't present in the Source
- Mapped: The column originated from the source and you're mapping it to a sink field
- Data flow status: The current status of your execution
- Cluster startup time: Amount of time to acquire the JIT Spark compute environment for your data flow execution
- Number of transforms: How many transformation steps are being executed in your flow

Total Sink Processing Time vs. Transformation Processing Time
Each transformation stage includes a total time for that stage to complete with each partition execution time totaled together. When you select the Sink, you see "Sink Processing Time". This time includes the total of the transformation time plus the I/O time it took to write your data to your destination store. The difference between the Sink Processing Time and the total of the transformation is the I/O time to write the data.
You can also see detailed timing for each partition transformation step if you open the JSON output from your data flow activity in the pipeline monitoring view. The JSON contains millisecond timing for each partition, whereas the UX monitoring view is an aggregate timing of partitions added together:
 {
     "stage": 4,
     "partitionTimes": [
          14353,
          14914,
          14246,
          14912,
          ...
         ]
}
Sink processing time
When you select a sink transformation icon in your map, the slide-in panel on the right shows an extra data point called "post processing time" at the bottom. This is the amount time spent executing your job on the Spark cluster after your data has been loaded, transformed, and written. This time can include closing connection pools, driver shutdown, deleting files, coalescing files, etc. When you perform actions in your flow like "move files" and "output to single file", you likely see an increase in the post processing time value.
- Write stage duration: The time to write the data to a staging location for Synapse SQL
- Table operation SQL duration: The time spent moving data from temp tables to target table
- Pre SQL duration & Post SQL duration: The time spent running pre/post SQL commands
- Pre commands duration & post commands duration: The time spent running any pre/post operations for file based source/sinks. For example move or, delete files after processing.
- Merge duration: The time spent merging the file, merge files are used for file based sinks when writing to single file or when "File name as column data" is used. If significant time is spent in this metric, you should avoid using these options.
- Stage time: Total amount of time spent inside of Spark to complete the operation as a stage.
- Temporary staging stable: Name of the temporary table used by data flows to stage data in the database.
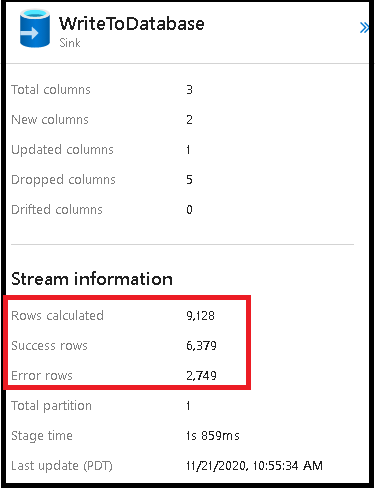
Error rows
Enabling error row handling in your data flow sink will be reflected in the monitoring output. When you set the sink to "report success on error", the monitoring output shows the number of success and failed rows when you select the sink monitoring node.
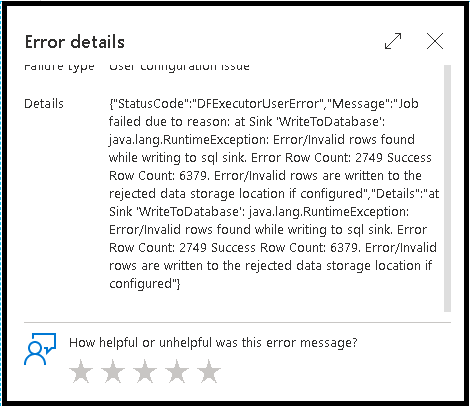
When you select "report failure on error", the same output is shown only in the activity monitoring output text. This is because the data flow activity returns failure for execution and the detailed monitoring view is unavailable.
Monitor Icons
This icon means that the transformation data was already cached on the cluster, so the timings and execution path have taken that into account:
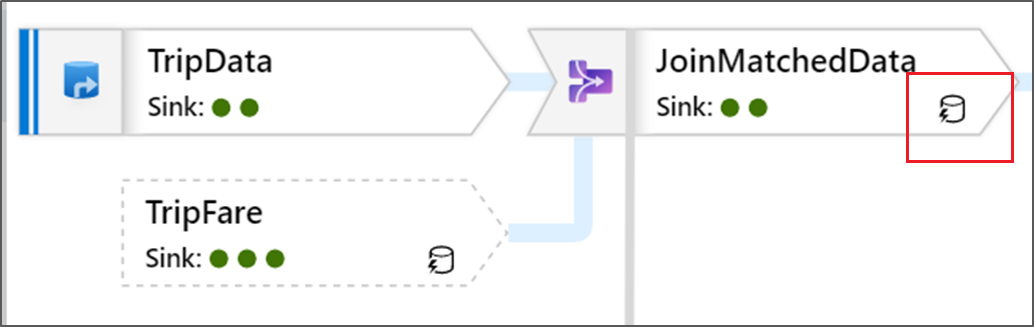
You also see green circle icons in the transformation. They represent a count of the number of sinks that data is flowing into.
Feedback
Coming soon: Throughout 2024 we will be phasing out GitHub Issues as the feedback mechanism for content and replacing it with a new feedback system. For more information see: https://aka.ms/ContentUserFeedback.
Submit and view feedback for