Training
Module
Create dashboards in Azure Data Explorer - Training
Learn how to create dashboards in Azure Data Explorer. You add tiles and visualizations, and then share the dashboard with others.
This browser is no longer supported.
Upgrade to Microsoft Edge to take advantage of the latest features, security updates, and technical support.
You can use the SQL editor to build a legacy dashboard that combines visualizations and text boxes that provide context with your data.
Important
End of support timeline:
April 7, 2025: Official support for the legacy version of dashboards will end. Only critical security issues and service outages will be addressed.
November 3, 2025: Databricks will begin archiving legacy dashboards that have not been accessed in the past six months. Archived dashboards will no longer be accessible, and the archival process will occur on a rolling basis. Access to actively used dashboards will remain unchanged.
Databricks will work with customers to develop migration plans for active legacy dashboards after November 3, 2025.
Convert legacy dashboards using the migration tool or REST API. See Clone a legacy dashboard to an AI/BI dashboard for instructions on using the built-in migration tool. See Dashboard tutorials for tutorials on creating and managing dashboards using the REST API.
You can access dashboards from the workspace browser along with other Azure Databricks objects.
Click ![]() Workspace in the sidebar to view dashboards from the workspace browser. Dashboards are stored in the
Workspace in the sidebar to view dashboards from the workspace browser. Dashboards are stored in the /Workspace/Users/<username> directory by default. Users can organize dashboards into folders in the workspace browser along with other Azure Databricks objects.
To view the dashboard listing page, click ![]() Dashboards in the sidebar.
Dashboards in the sidebar.
Click the Legacy dashboards tab to view legacy dashboards.
By default, the My dashboards tab is selected and shows dashboards that you own sorted in reverse chronological order. Reorder the list by clicking the Created at heading. Or, use the tabs near the top of the page to view Favorites, or All dashboards. Use the Tags tab to filter by tag.
Organize new and existing dashboards into folders in the workspace browser along with other Azure Databricks objects. See Workspace browser.
Filter the list of all dashboards by dashboards that you created (My Dashboards), by favorites, and by tags.
Follow these steps to create a new legacy dashboard. To clone an existing dashboard, see Clone a legacy dashboard.
Note
If you select and save a warehouse to the dashboard and then it is deleted or otherwise becomes unavailable, a manual refresh will fail until a new warehouse is assigned.
Add content to the dashboard by clicking Add and selecting the type of content to add:
Click Textbox to add commentary.
Enter text. Style the text boxes using Markdown.
. For example, the following markdown inserts an image of the Databricks logo: . To resize the image, resize the widget dimensions.. To resize the image, resize the widget dimensions.Important
Images used in a dashboard that are stored in DBFS will not render when doing an on-demand pdf or subscription
Click Visualization to add a query visualization.
Select a query. Search existing queries or pick a recent one from the pre-populated list. If a query was saved with the Limit 1000 setting, the query in the dashboard limits results to 1000 rows.
In the Choose Visualization drop-down, select the visualization type.
Click Add to legacy dashboard.
Drag and drop content blocks on the dashboard.
Click Done Editing.

You can also create a dashboard with the Databricks Terraform provider and databricks_sql_dashboard. You can create a widget for legacy a dashboard with databricks_sql_widget. You can create a sample legacy dashboard with dbsql-nyc-taxi-trip-analysis.
You can clone the legacy dashboard and all upstream queries if you have the CAN RUN, CAN EDIT, and CAN MANAGE permissions on the dashboard and each of its upstream queries. You become the owner of the new dashboard and queries.
Important
Sharing settings, alerts, and subscriptions are not copied to the new dashboard.
To clone a legacy dashboard:
Note
Cloning is guaranteed to work reliably with fewer than 50 visualizations and fewer than 30 queries, including queries that are used to generate query-based dropdown list parameters. Attempting to clone a dashboard with visualizations or queries that exceed these limits may fail.
For more information about query-based dropdown list parameters, see Query-Based Dropdown List.
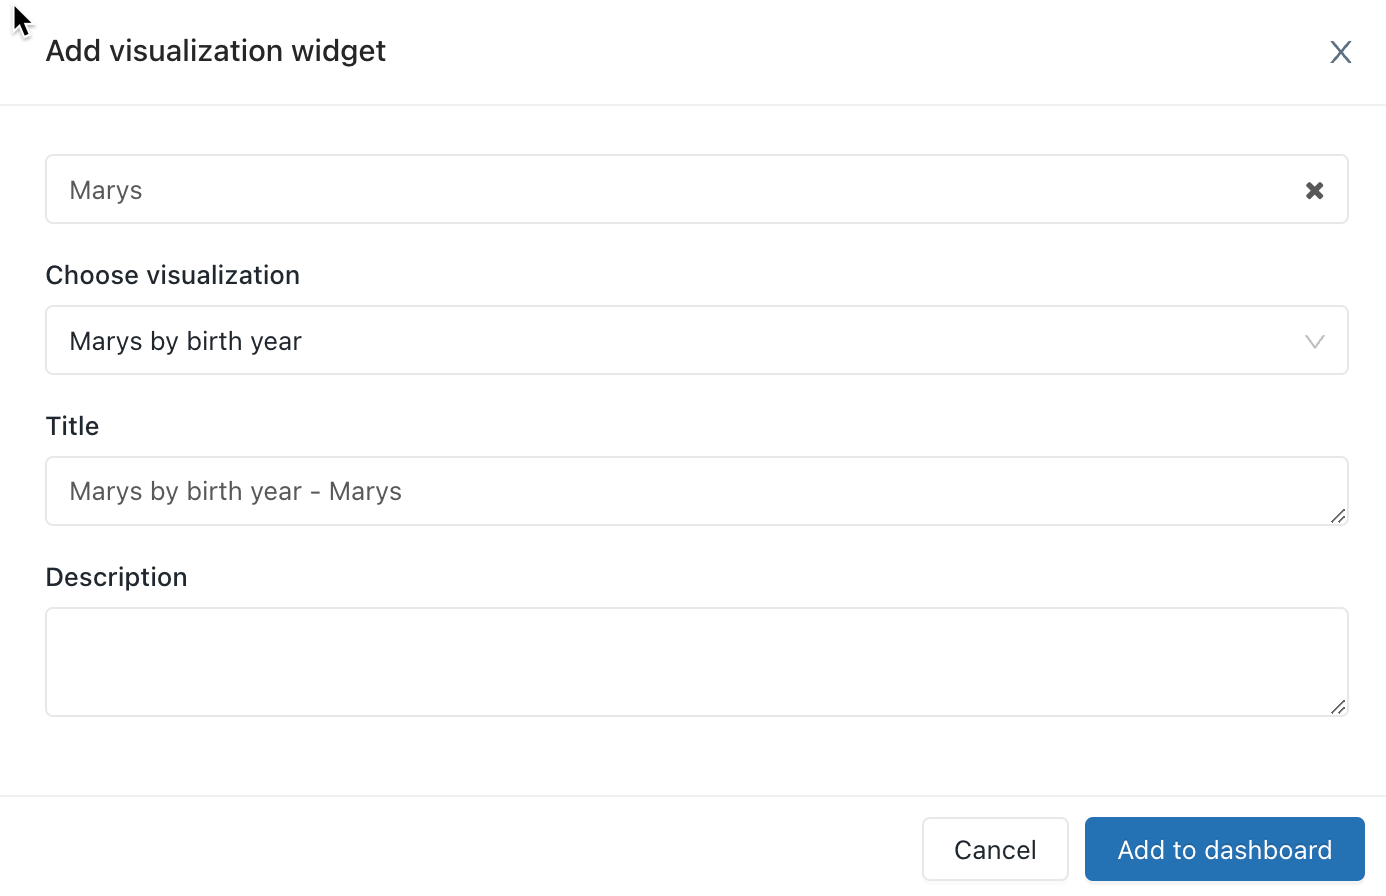
Queries can optionally leverage parameters or static values. When a visualization based on a parameterized query is added to a dashboard, the visualization can either be configured to use a:
When you add a visualization containing a parameterized query, you can choose the title and the source for the parameter in the visualization query by clicking the appropriate pencil icon ![]() . You can also select the keyword and a default value. See Parameter properties.
. You can also select the keyword and a default value. See Parameter properties.
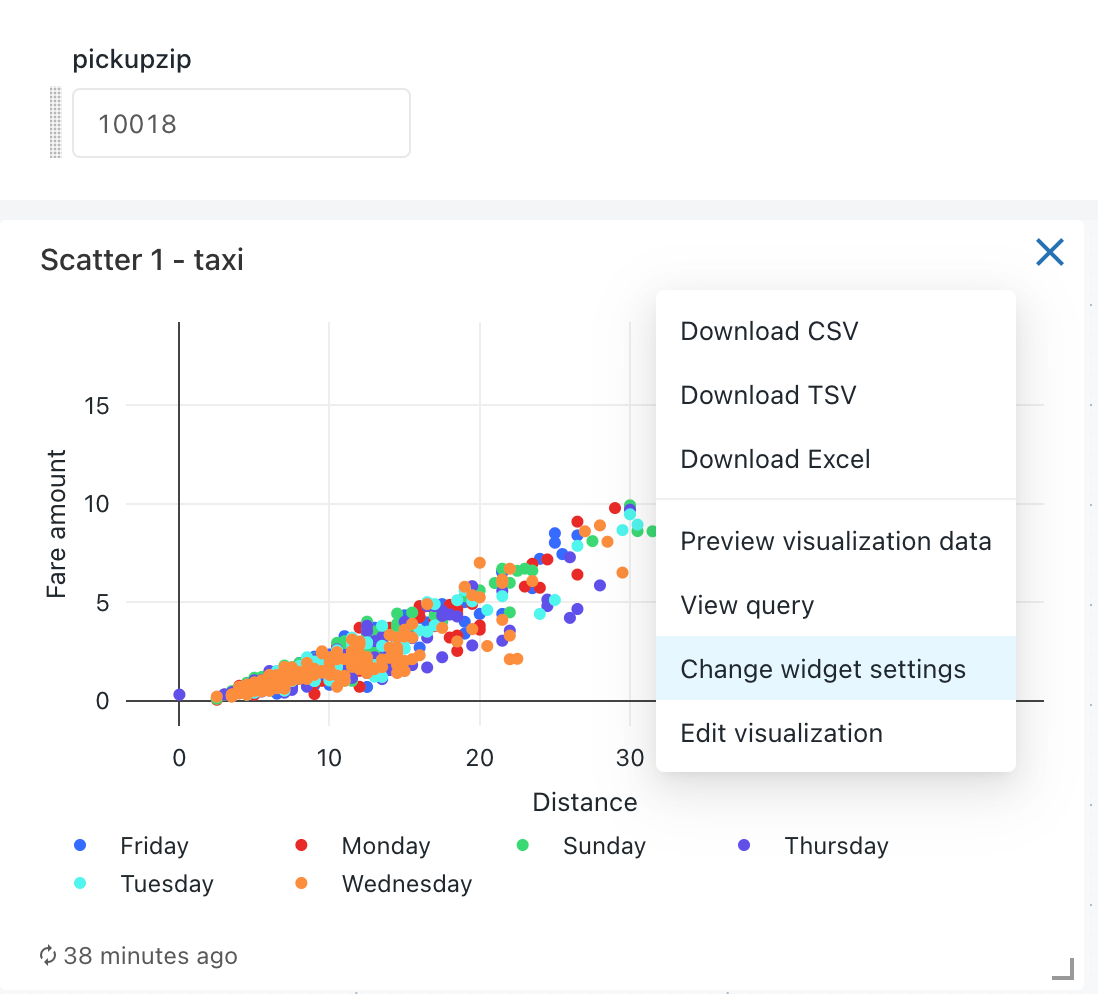
After adding a visualization to a dashboard, you can access the parameter mapping interface by clicking the ![]() kebab menu on the upper-right of a dashboard widget and then clicking Change widget settings.
kebab menu on the upper-right of a dashboard widget and then clicking Change widget settings.
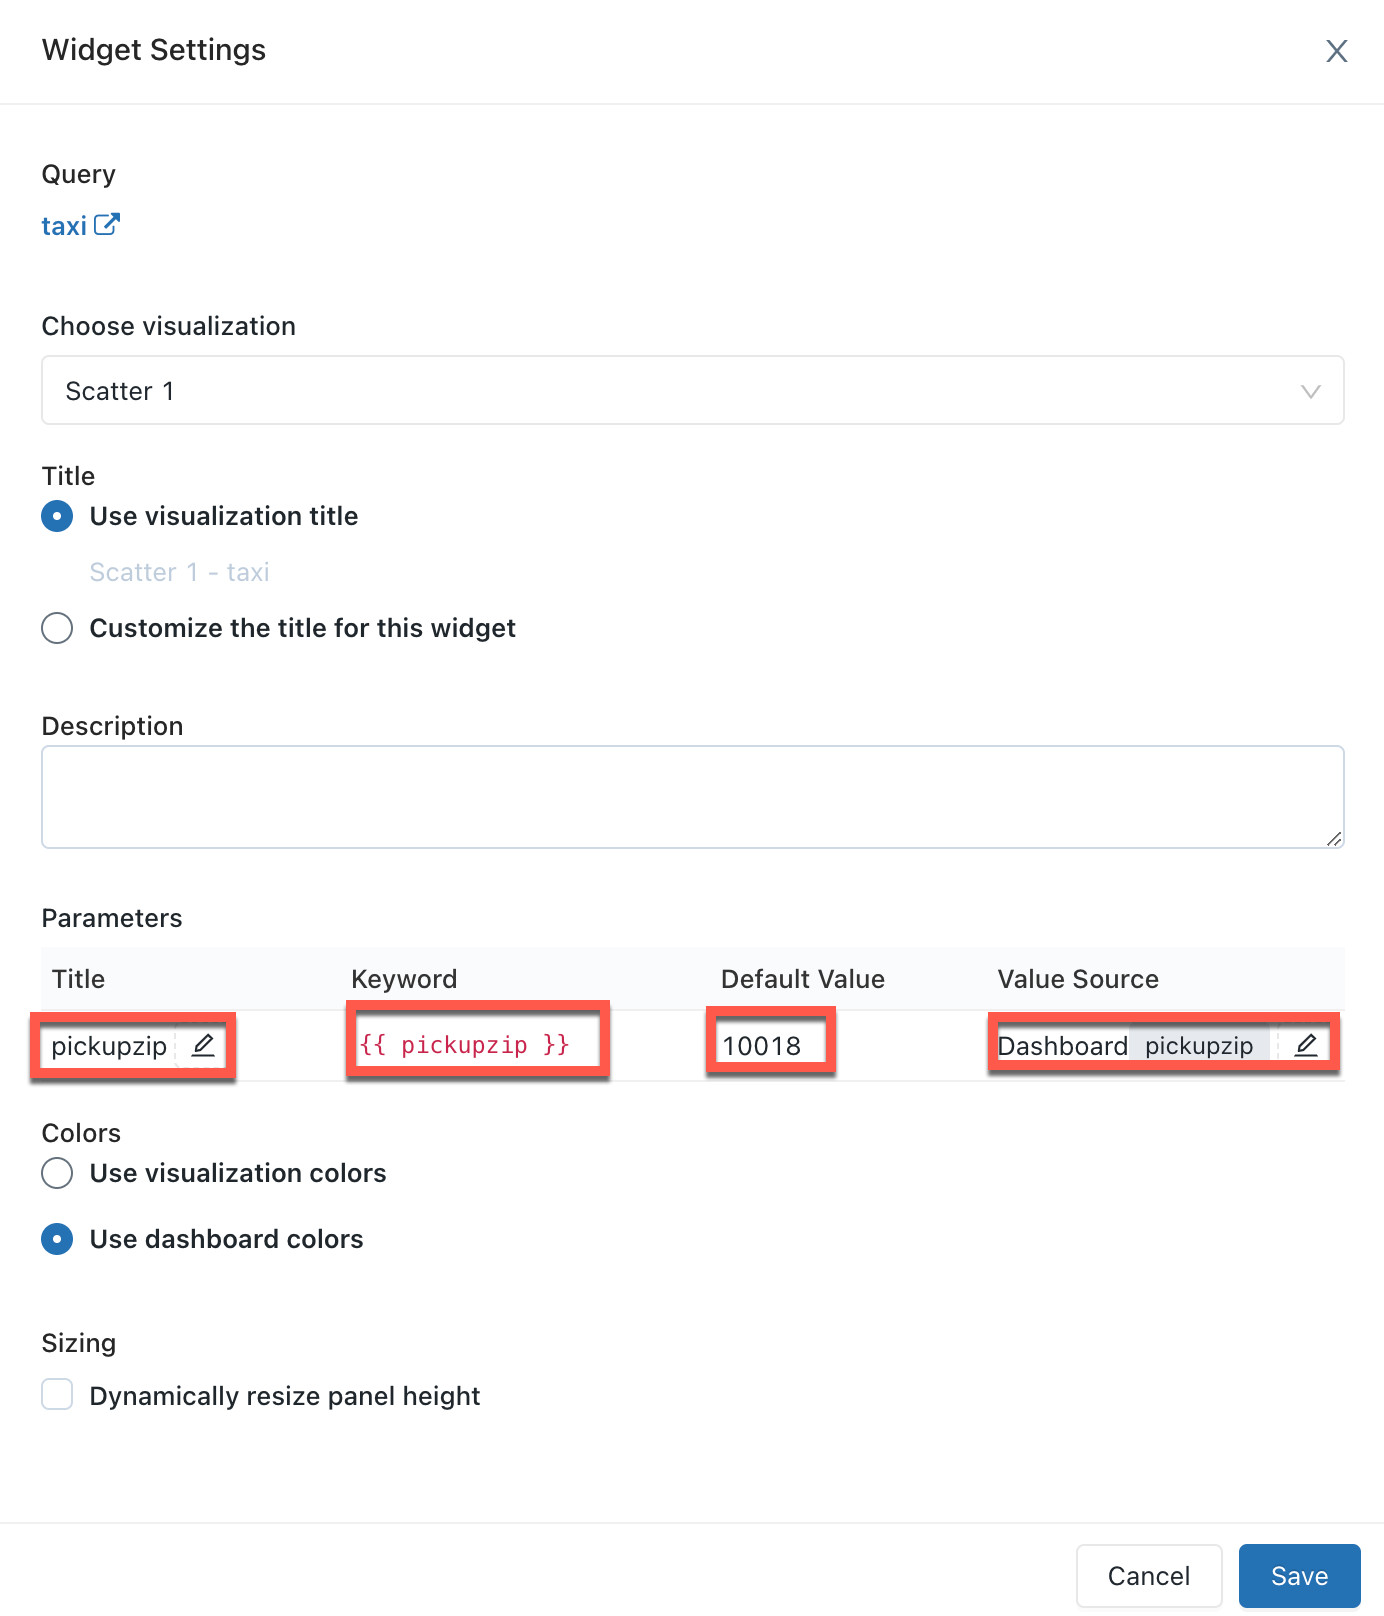
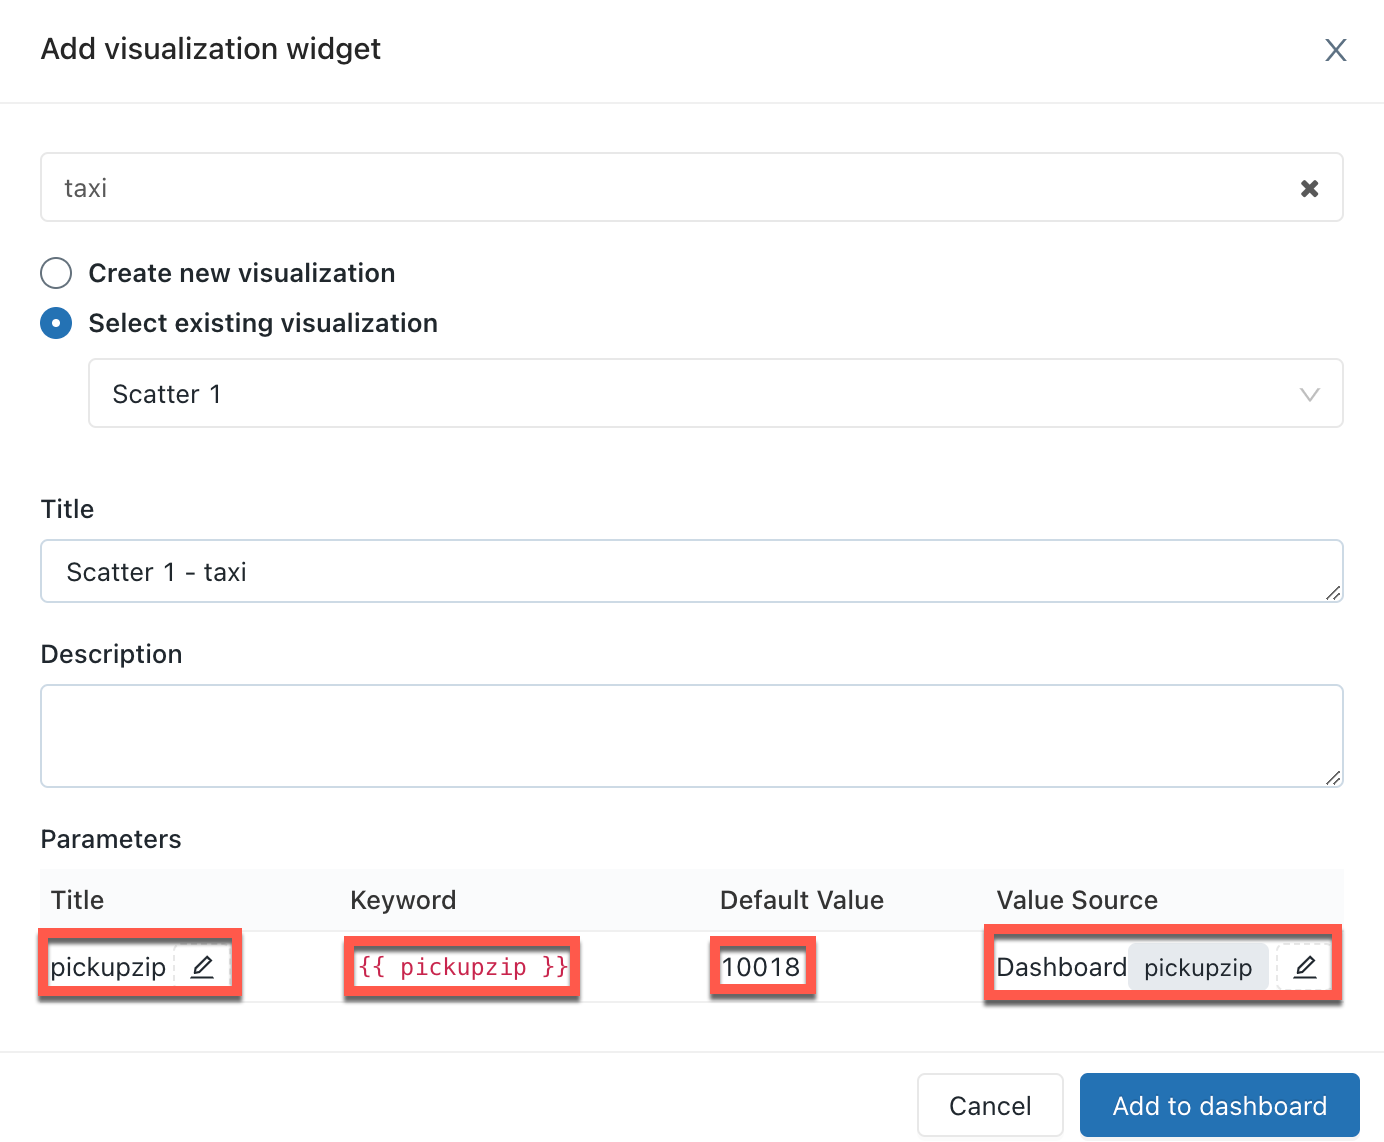
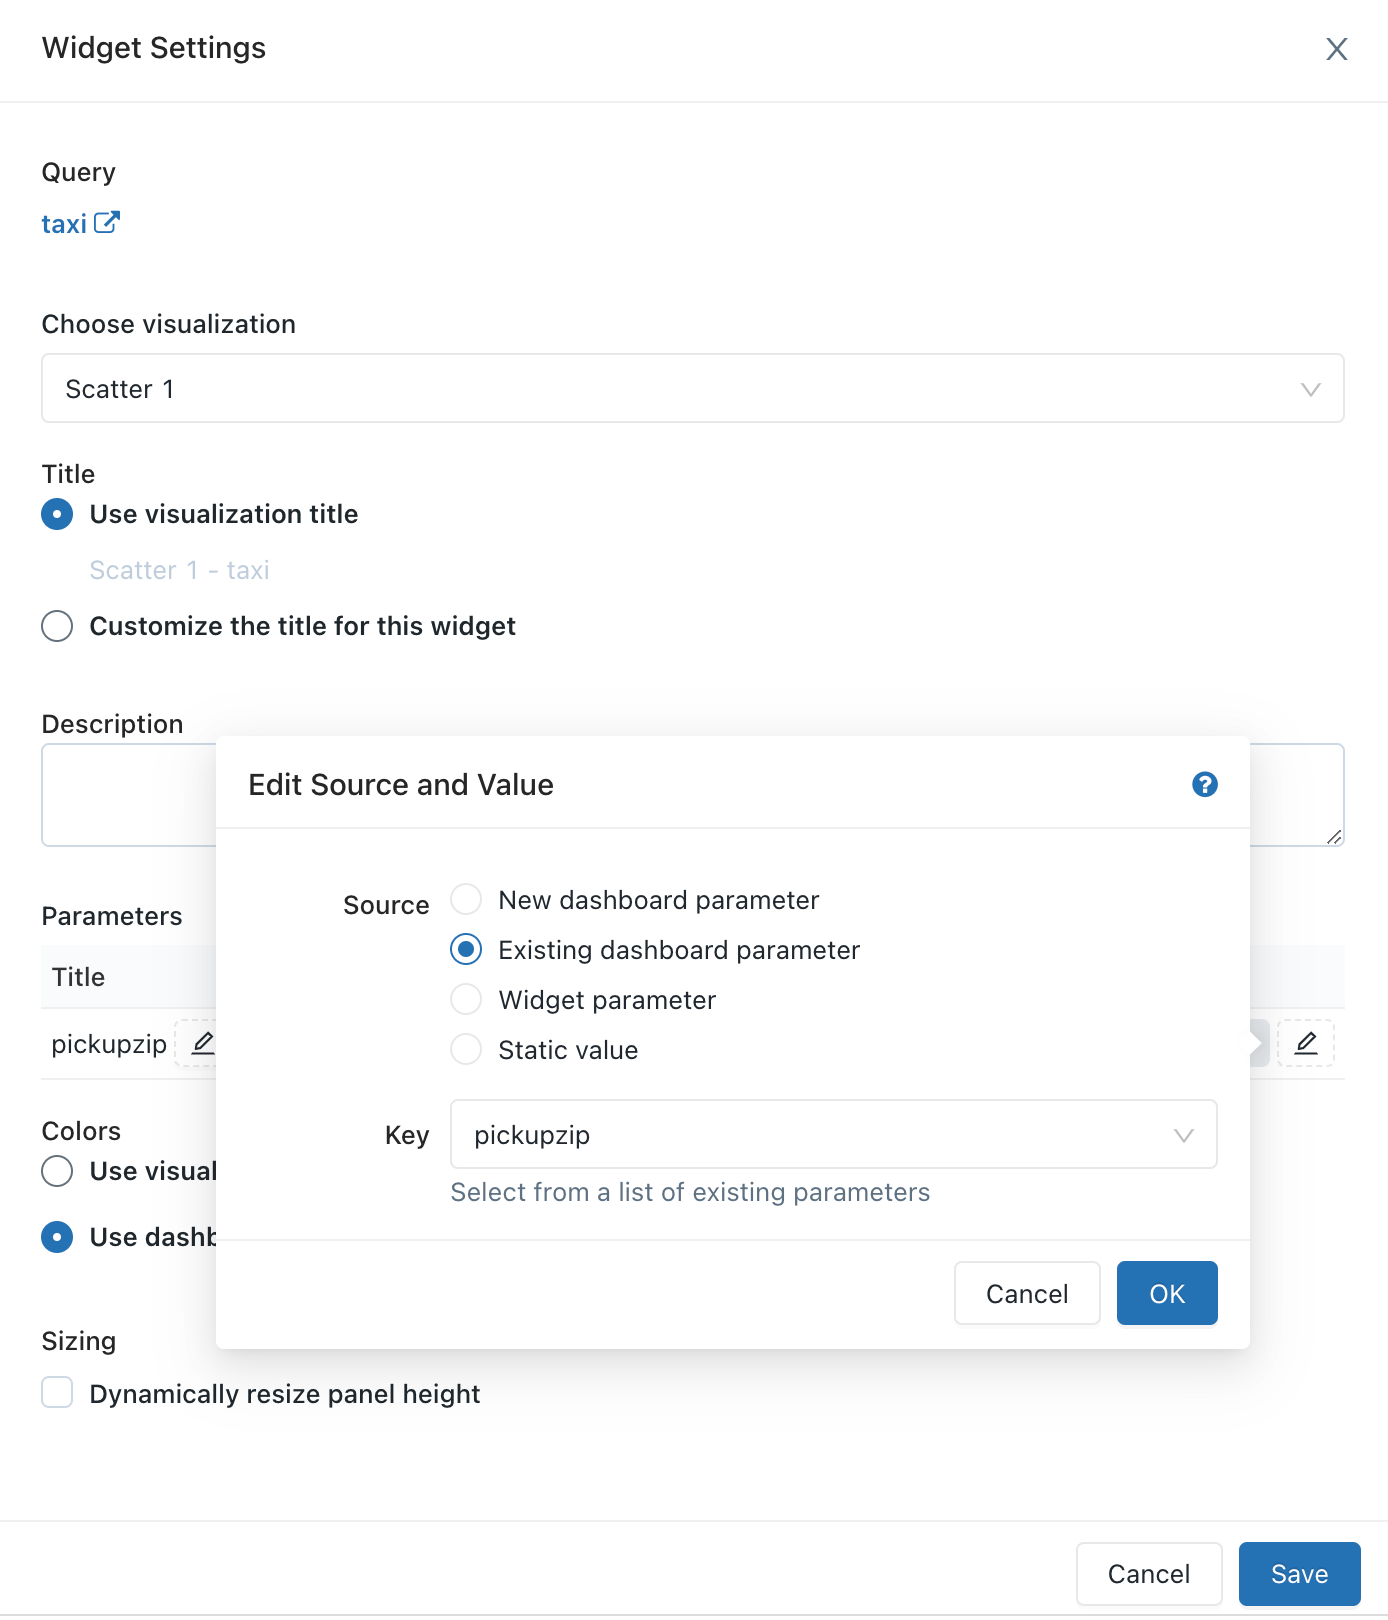
The dashboard widget parameter properties are:
Title: The display name that appears beside the value selector on your dashboard. It defaults to the title set in the query editor. To edit how it appears within the dashboard, click the pencil icon ![]() . Titles are not displayed for static dashboard parameters because the value selector is hidden. If you select Static value as your Value Source then the Title field is grayed out.
. Titles are not displayed for static dashboard parameters because the value selector is hidden. If you select Static value as your Value Source then the Title field is grayed out.
Keyword: The string literal for this parameter in the underlying query. This is useful for debugging if your dashboard does not return the expected results.
Default Value: The value set for that parameter on dashboard load until another is selected and changes applied. To change this default, open the underlying query in the SQL editor, change the parameter to your desired value, and click the Save button.
Value Source: The source of the parameter value. Click the pencil icon ![]() to choose a source.
to choose a source.
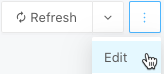
To open the dashboard for editing, open the ![]() kebab menu at the top-right of the dashboard and select Edit.
kebab menu at the top-right of the dashboard and select Edit.
While editing, you can add and remove content, edit visualizations, and apply filters. To change the order in which parameters are shown, you can click and drag each parameter to the desired position.
To filter across multiple queries on a dashboard:
Note
The queries you choose must belong to the same catalog and schema. Some old queries may not be compatible with filtering across multiple queries.
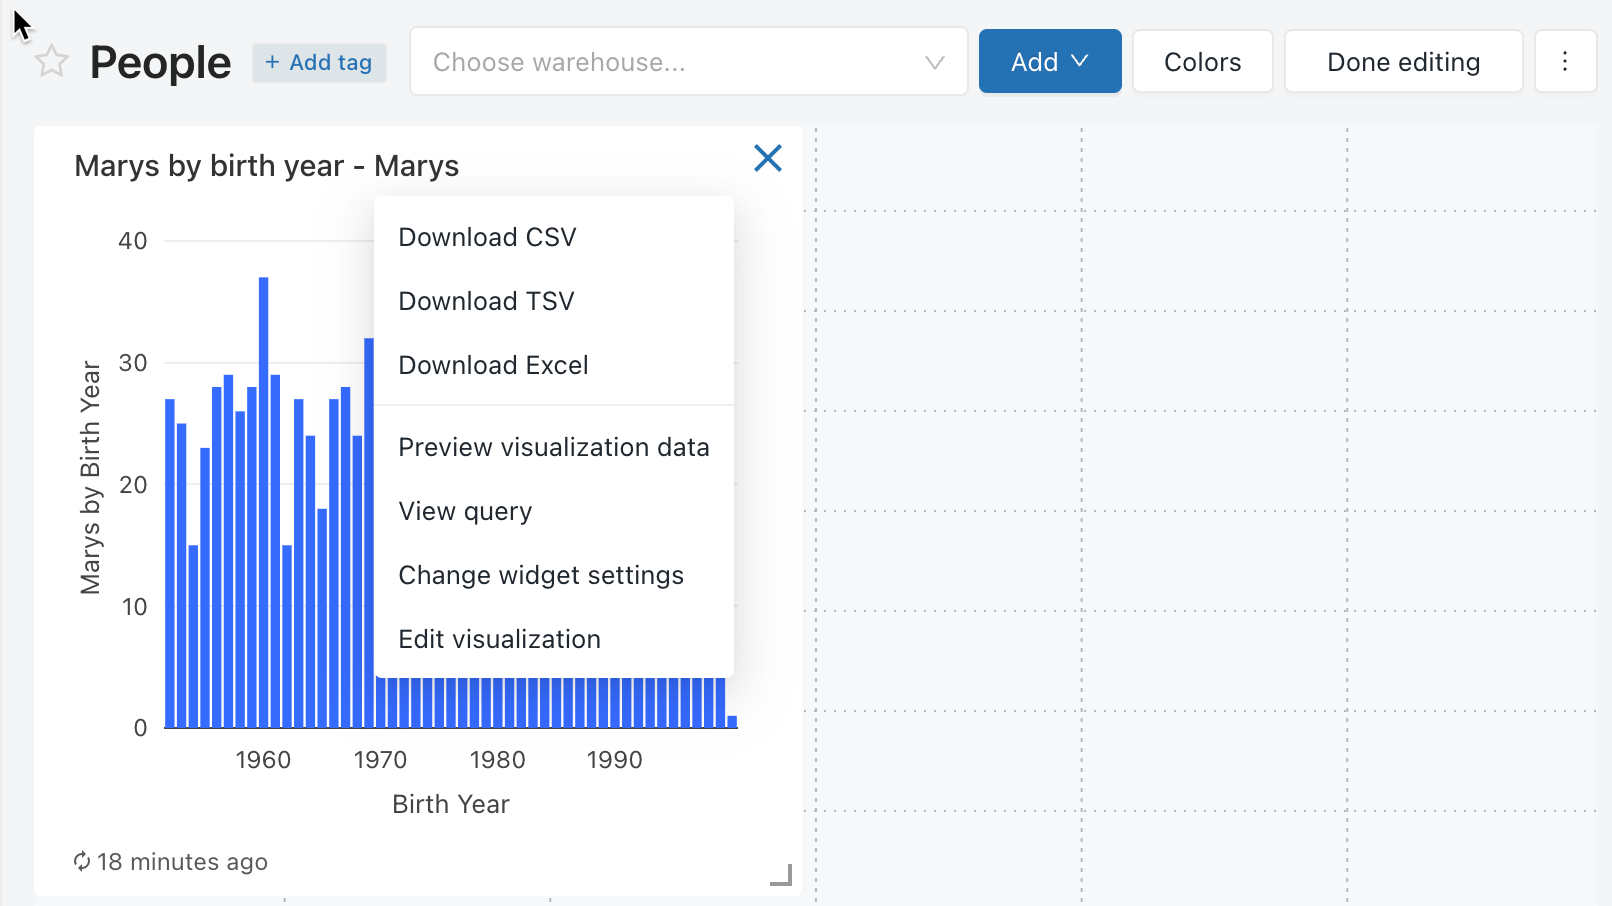
To edit a visualization on the dashboard while in edit mode, select the visualization you wish to edit and then click the ![]() kebab menu at the top-right of the visualization. In the displayed list, select Edit visualization.
kebab menu at the top-right of the visualization. In the displayed list, select Edit visualization.
You can also add a visualization to a dashboard in the SQL editor.
When queries have filters, you must also apply filters at the dashboard level. Select the Use Dashboard Level Filters checkbox to apply the filter to all queries.
You can customize the dashboard color palette, including creating a color palette.
To create a custom color palette for a dashboard:
To remove a custom color palette:
By default, if a color palette has been applied in a dashboard, all visualizations will use that color palette. If you’d like to use different colors for a visualization, you can override this behavior:
Legacy dashboards are designed for efficient loading as they retrieve data from a cache that renews each time a query runs. However, your dashboards can become outdated if you don’t run the associated queries regularly. To prevent your dashboards from becoming stale, you can refresh the dashboard to rerun the associated queries.
Each time a dashboard is refreshed, either manually or on a schedule, all queries referenced in the dashboard are refreshed. When an individual visualization is refreshed, the upstream query is refreshed. Manually refreshing the dashboard or individual visualization does not refresh queries used in Query Based Dropdown Lists. For details on Query Based Dropdown Lists, see Query-Based Dropdown List.
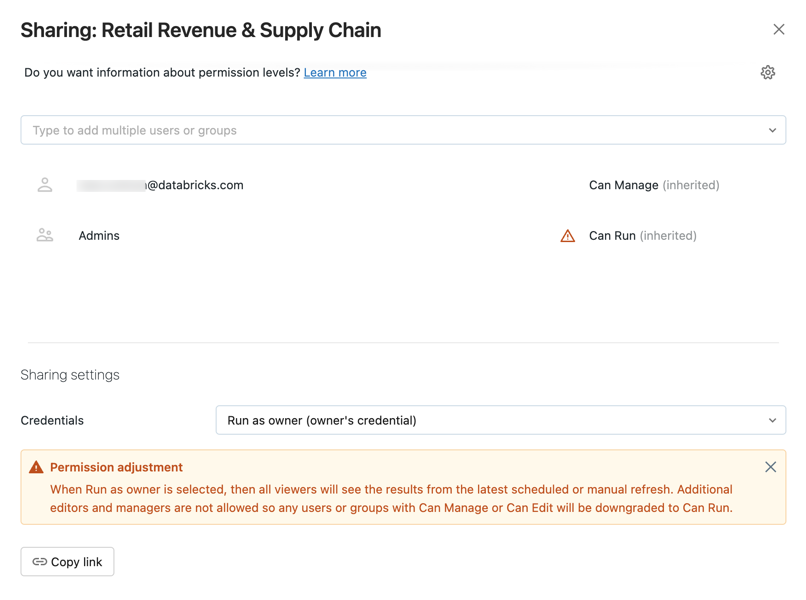
When a dashboard is “Run as Owner” and a schedule is added, the owner’s credential is used for execution, and anyone with at least CAN RUN permission sees the results of those refreshed queries.
When a dashboard is “Run as Viewer” and a schedule is added, the owner’s credential is used for execution, but only the owner sees the results of the refreshed queries; all other viewers must manually refresh to see updated query results.
To force a refresh, click Refresh on the upper-right of the dashboard. This runs all the dashboard queries and updates its visualizations.
A dashboard’s owner and users with the CAN EDIT permission can configure a dashboard to automatically refresh on a schedule. To automatically refresh a dashboard:
Click Schedule at the upper-right corner of the dashboard. Then, click Add schedule.
Use the dropdown pickers to specify the frequency, period, starting time, and time zone. Optionally, select the Show cron syntax checkbox to edit the schedule in Quartz Cron Syntax.
Choose More options to show optional settings. You can choose:
Note
This warehouse can be different than the one used for manual refresh.
Optional: In the Subscribers tab, enter a list of email addresses to notify when the dashboard is automatically updated. Each email address must be associated with an Azure Databricks account with workspace access or defined as a notification destination in the workspace settings. Notification destinations are configured by a workspace admin.
Click Create. The Schedule label changes to Schedule(1).
Edit sharing settings.
Note
Dashboard permissions are not linked to schedule permissions. After creating your scheduled refresh interval, edit the schedule permissions to provide access to other users. Only users with CAN MANAGE permission can edit the schedule or edit the subscriber list.
CAN VIEW or CAN RUN permission allows the assigned recipient to see that a schedule exists, as well as other properties like report cadence and number of subscribers. CAN MANAGE allows the recipient to modify the schedule, subscriber list, and schedule permission. CAN MANAGE permission also allows the recipient to pause or unpause the schedule.
When you open a dashboard set to Run as Owner, it displays data from the latest dashboard update, regardless of whether it was scheduled or manually refreshed. If a dashboard is open in a browser window, and a query is modified or a scheduled run updates dashboard results, the changes won’t be reflected immediately. The updated results will appear the next time you open the dashboard or refresh the open browser window.
You can periodically export and email dashboard snapshots. Dashboard snapshots are taken from the default dashboard state, meaning that any interaction with the filters and visualizations is not included in the snapshot.
If you have at least CAN EDIT permission, you can create a refresh schedule and subscribe other users, who will receive email snapshots of the dashboard every time it’s refreshed. To add subscribers, enter users or groups in the Subscribers tab as described above. Eligible subscribers include workspace users and notification destinations.
Note
Notification destinations are configured by a workspace admin. To learn how to configure a notification destination, see Manage notification destinations.
There is a 6 MB file size limit for email attachments. If a dashboard subscription email exceeds the 6 MB size limit, the email will omit the inline dashboard snapshot and include only a PDF of the dashboard snapshot.
If the PDF snapshot file exceeds 6 MB, the subscription email will omit the PDF and instead include a link to the refreshed dashboard. The email will have a warning note detailing the current dashboard size. (Users can test the PDF snapshot size by manually downloading a PDF of the dashboard.)
If a dashboard is configured for automatic updates, and you have at least CAN VIEW permission on the schedule, the label on the Schedule button reads Schedule(#), where the # is the number of scheduled events that are visible to you. Additionally, if you have at least CAN MANAGE permission on the schedule, you can temporarily pause the schedule. This is helpful to avoid sending updates while testing changes to the dashboard. To temporarily pause scheduled dashboard updates without modifying the list of subscribers:
To stop automatically updating the dashboard and remove its subscriptions:
Note
You must have at least CAN MANAGE permission on a schedule to delete it.
Legacy dashboard subscription emails include the following base64 encoded files:
A maximum limit of 6MB is imposed on the combined size of the two files. The following descriptions outline the expected behavior when the combined file size exceeds the limit:
To download a dashboard as a PDF file, click the ![]() kebab menu at the top-right of the dashboard and select Download as PDF.
kebab menu at the top-right of the dashboard and select Download as PDF.
To move a dashboard to ![]() Trash, do the following:
Trash, do the following:
Note
Legacy dashboards moved to trash on or around 9/3/2024 might still appear in the legacy dashboard listing page. Permanently deleted dashboards are not shown.
Note
By default, dashboards in the trash folder are permanently deleted after 30 days. Use this option to permanently delete your dashboard immediately.
To open the query displayed in a widget in the SQL editor, click the ![]() kebab menu at the top-right of the widget and select View Query.
kebab menu at the top-right of the widget and select View Query.
You must have CAN MANAGE on a dashboard to configure permissions For dashboard permission levels, see Legacy dashboard ACLs.
 button at the top right to open the Sharing dialog.
You can quickly share all queries associated with your dashboard by clicking the gear icon and selecting Share all queries. Queries referenced by the dashboard have separate permissions and are not shared by default when you share the dashboard.
If a dashboard’s owner is removed from a workspace, the dashboard no longer has an owner. A workspace admin user can transfer ownership of any dashboard, including one without an owner, to a different user. Groups cannot be assigned ownership of a dashboard. You can also transfer ownership using the Permissions API.
As a workspace admin, log in to your Azure Databricks workspace.
In the sidebar, click Dashboards.
Click a dashboard.
Click the Share button at the top right to open the Sharing dialog.
Click on the gear icon at the top right and click Assign new owner.
Select the user to assign ownership to.
Click Confirm.
An Azure Databricks workspace admin user has view access to all dashboards in the workspace. In this view a workspace admin can view and delete any dashboard. However, a workspace admin can’t edit a dashboard when sharing setting credentials are set to Run as owner.
To view all legacy dashboards:
Training
Module
Create dashboards in Azure Data Explorer - Training
Learn how to create dashboards in Azure Data Explorer. You add tiles and visualizations, and then share the dashboard with others.