Access and manage saved queries
This article outlines how to use the Azure Databricks UI to access and manage queries.
View queries
You can view queries using the following methods:
- Click
 Workspace in the sidebar. Queries are viewable, by default, in the Home folder. Users can organize queries into folders in the workspace browser along with other Databricks objects.
 - Click
 Queries in the sidebar. Objects in the Queries windows are sorted in reverse chronological order by default. You can reorder the list by clicking the Created at column heading. Type into the Filter queries text box to filter by Name, Tag, or Owner.
Organize queries into folders in the workspace browser
You can organize queries into folders in the workspace browser and other Databricks objects. See Workspace browser.
Transfer ownership of a query
You must be a workspace admin to transfer ownership of a query. Service principals and groups cannot be assigned ownership of a query. You can also transfer ownership using the Permissions API.
As a workspace admin, log in to your Azure Databricks workspace.
In the sidebar, click Queries.
Click a query.
Click the Share button at the top right to open the Sharing dialog.
Click on the gear icon at the top right and click Assign new owner.

Select the user to assign ownership to.
Click Confirm.
Configure query permissions
Workspace admins and the query creator are automatically granted permissions to control which users can manage and run queries. You must have at least CAN MANAGE permission on a query to share queries.
Queries support two types of sharing settings:
Run as viewer: The viewer’s credential is used to run the query. The viewer must also have at least CAN USE permissions on the warehouse.
Users can only be granted the CAN EDIT permission when the sharing setting is set to Run as viewer.
Run as owner: The owner’s credential is used to run the query.
For more information on query permission levels, see Query ACLs.
In the sidebar, click Queries.
Click a query.
Click the
 button at the top right to open the Sharing dialog.
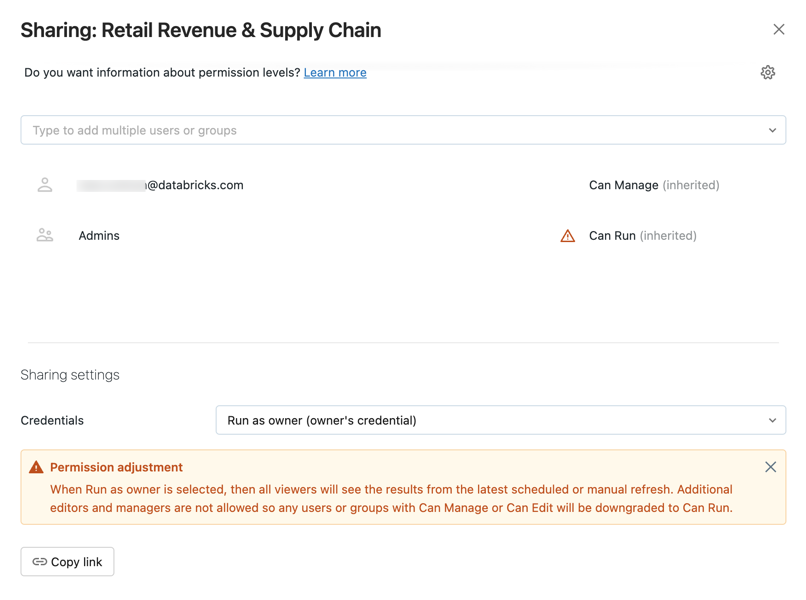
Follow the steps based on the permission type you want to grant:
Search for and select the groups and users, and assign the permission level.
Click Add.
In the Sharing settings > Credentials field at the bottom, select either Run as viewer or Run as owner.
You can also copy the link to the query in the Sharing dialog.
Admin access to all queries
An Azure Databricks workspace admin user has view access to all queries in the workspace. When the All Queries tab is selected, a workspace admin can view and delete any queries. However, a workspace admin can’t edit a query when sharing setting credentials are set to Run as owner.
To view all queries:
- Click Queries in the sidebar.
- Click the All queries tab near the top of the screen.
Creating queries in other environments
You can create queries without using the Azure Databricks UI using the Rest API, a JDBC/ODBC connector, or a partner tool.
See Use a SQL database tool to run SQL commands and browse database objects in Azure Databricks.
You can also create a query with the Databricks Terraform provider and databricks_sql_query.
See Technology partners to learn about partner tools you can use through Partner Connect.
Feedback
Coming soon: Throughout 2024 we will be phasing out GitHub Issues as the feedback mechanism for content and replacing it with a new feedback system. For more information see: https://aka.ms/ContentUserFeedback.
Submit and view feedback for