Visualize Microsoft Defender for IoT data with Azure Monitor workbooks
Azure Monitor workbooks provide graphs, charts, and dashboards that visually reflect data stored in your Azure Resource Graph subscriptions and are available directly in Microsoft Defender for IoT.
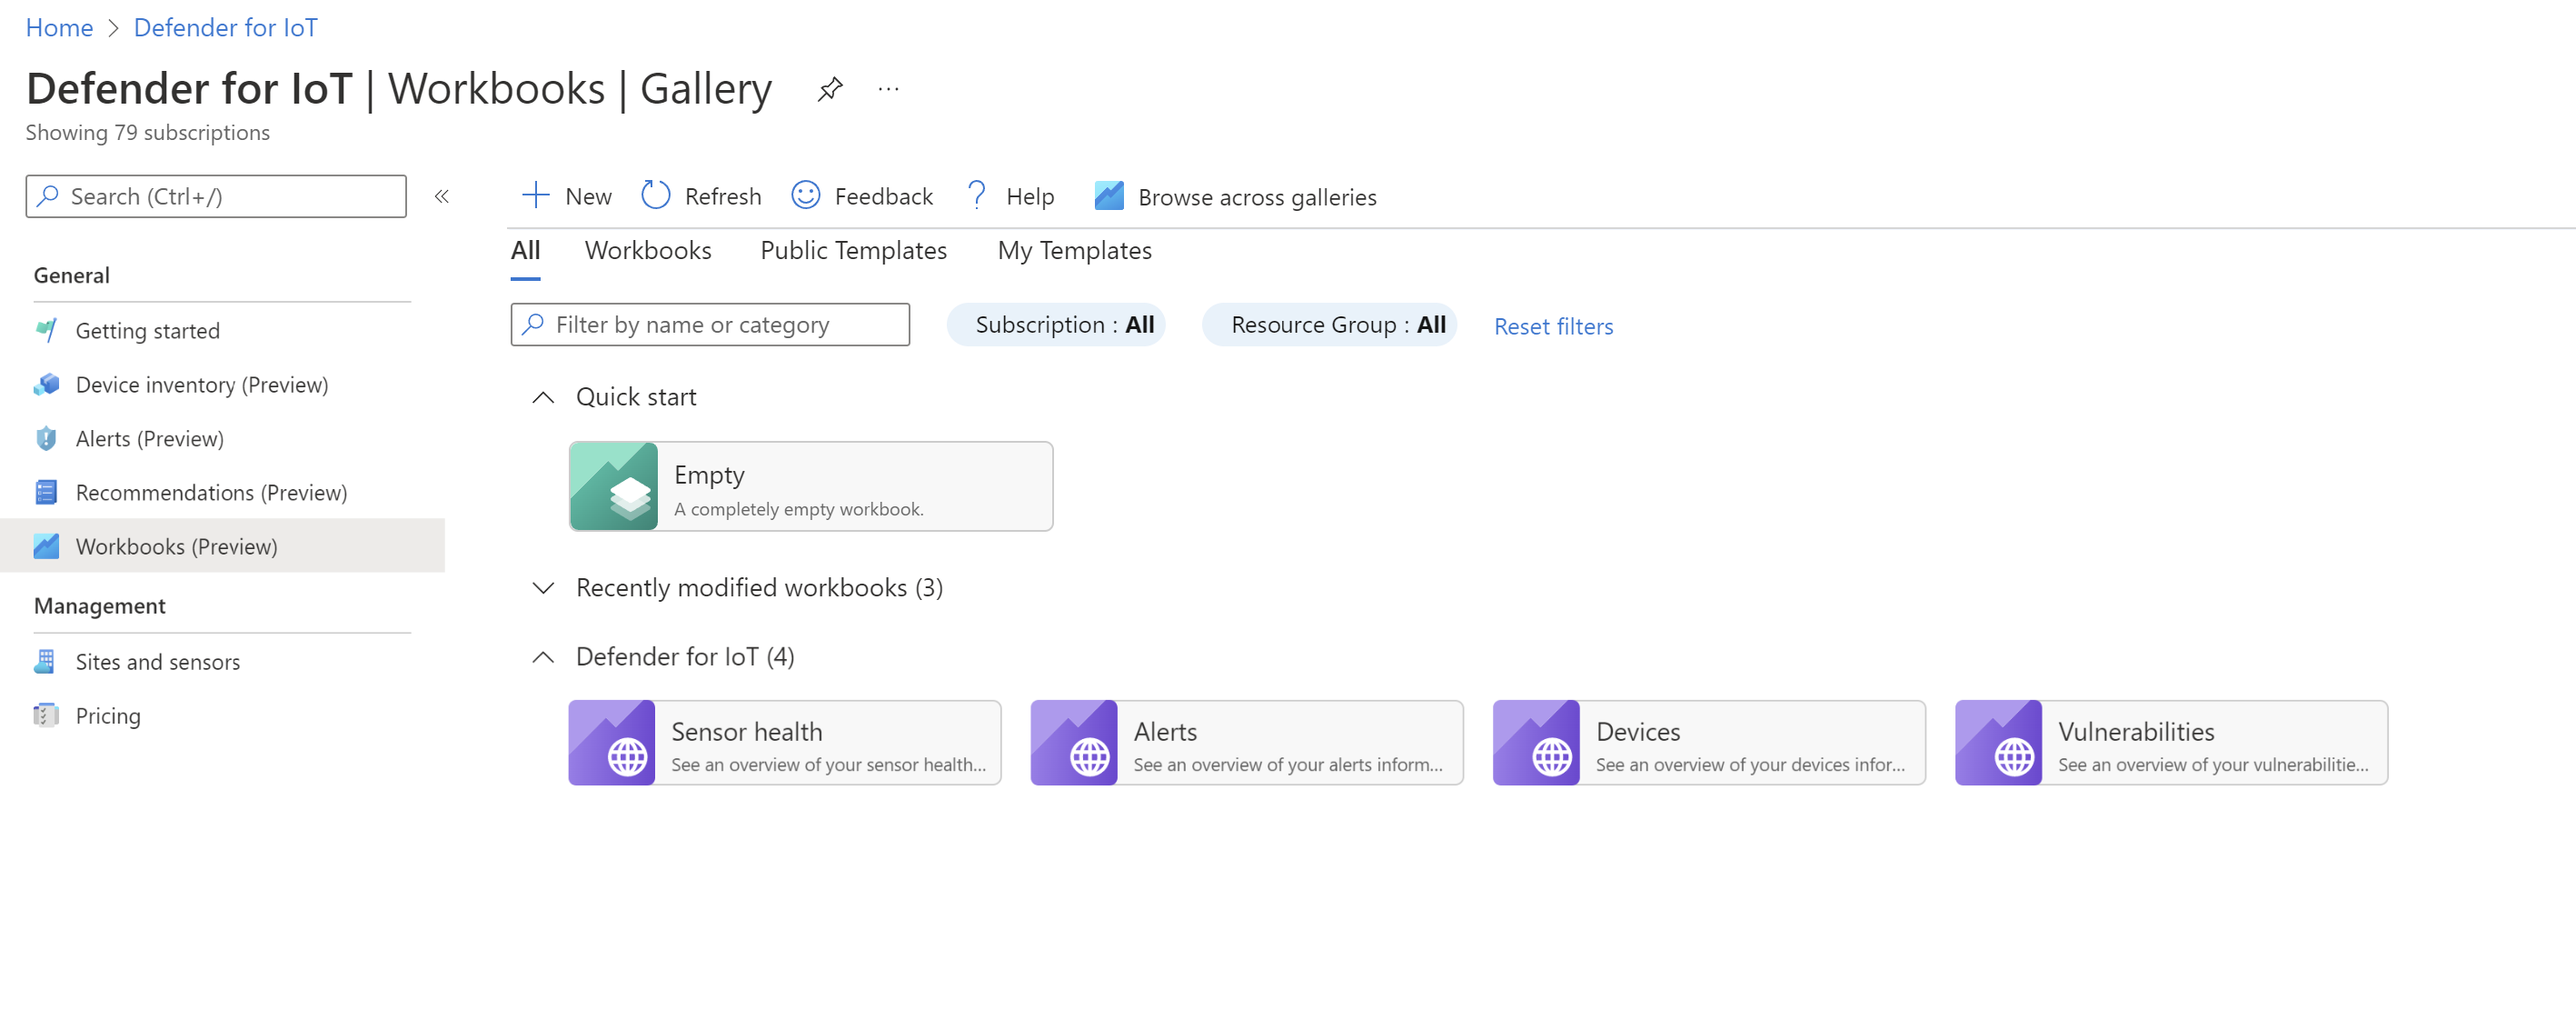
In the Azure portal, use the Defender for IoT Workbooks page to view workbooks created by Microsoft and provided out-of-the-box, or created by customers and shared across the community.
Each workbook graph or chart is based on an Azure Resource Graph (ARG) query running on your data. In Defender for IoT, you might use ARG queries to:
- Gather sensor statuses
- Identify new devices in your network
- Find alerts related to specific IP addresses
- Understand which alerts are seen by each sensor
View workbooks
To view out-of-the-box workbooks created by Microsoft, or other workbooks already saved to your subscription:
In the Azure portal, go to Defender for IoT and select Workbooks on the left.
Modify your filtering options if needed, and select a workbook to open it.

Defender for IoT provides the following workbooks out-of-the-box:
- Sensor health. Displays data about your sensor health, such as the sensor console software versions installed on your sensors.
- Alerts. Displays data about alerts occurring on your sensors, including alerts by sensor, alert types, recent alerts generated, and more.
- Devices. Displays data about your device inventory, including devices by vendor, subtype, and new devices identified.
- Vulnerabilities. Displays data about the Vulnerabilities detected in OT devices across your network. Select an item in the Device vulnerabilities, Vulnerable devices, or Vulnerable components tables to view related information in the tables on the right.
Create custom workbooks
Use the Defender for IoT Workbooks page to create custom Azure Monitor workbooks directly in Defender for IoT.
On the Workbooks page, select New, or to start from another template, open the template workbook and select Edit.
In your new workbook, select Add, and select the option you want to add to your workbook. If you're editing an existing workbook or template, select the options (...) button on the right to access the Add menu.
You can add any of the following elements to your workbook:
Option Description Text Add text to describe the graphs shown on your workbook or any additional action required. Parameters Define parameters to use in your workbook text and queries. Links / tabs Add navigational elements to your workbook, including lists, links to other targets, extra tabs, or toolbars. Query Add a query to use when creating your workbook graphs and charts.
- Make sure to select Azure Resource Graph as your Data source and select all of your relevant subscriptions.
- Add a graphical representation for your data by selecting a type from the Visualization options.Metric Add metrics to use when creating workbook graphs and charts. Group Add groups to organize your workbooks into sub-areas. For each option, after you've defined all available settings, select the Add... or Run... button to create that workbook element. For example, Add parameter or Run Query.
Tip
You can build your queries in the Azure Resource Graph Explorer and copy them into your workbook query.
In the toolbar, select Save
 or Save as
  to save your workbook, and then select Done editing.
Select Workbooks to go back to the main workbook page with the full workbook listing.
Reference parameters in your queries
Once you've created a parameter, reference it in your query using the following syntax: {ParameterName}. For example:
iotsecurityresources
| where type == "microsoft.iotsecurity/sensors"
| extend Name=name
| extend Status= properties.sensorStatus
| where Name=={SensorName}
| project Name,Status
Sample queries
This section provides sample queries that are commonly used in Defender for IoT workbooks.
Alert queries
Distribution of alerts across sensors
iotsecurityresources
| where type == "microsoft.iotsecurity/locations/devicegroups/alerts"
| extend Sensor=properties.extendedProperties.SensorId
| where properties.status!='Closed'
| summarize Alerts=count() by tostring(Sensor)
| sort by Alerts desc
New alerts from the last 24 hours
iotsecurityresources
| where type == "microsoft.iotsecurity/locations/devicegroups/alerts"
| where properties.status!='Closed'
| extend AlertTime=properties.startTimeUtc
| extend Type=properties.displayName
| where AlertTime > ago(1d)
| project AlertTime, Type
Alerts by source IP address
iotsecurityresources
| where type == "microsoft.iotsecurity/locations/devicegroups/alerts"
| extend Type=properties.displayName
| extend Source_IP=properties.extendedProperties.SourceDeviceAddress
| extend Destination_IP=properties.extendedProperties.DestinationDeviceAddress
| where Source_IP=='192.168.10.1'
| project Source_IP, Destination_IP, Type
Device queries
OT device inventory by vendor
iotsecurityresources
| extend Vendor= properties.hardware.vendor
| where properties.deviceDataSource=='OtSensor'
| summarize Devices=count() by tostring(Vendor)
| sort by Devices
OT device inventory by sub-type, such as PLC, embedded device, UPS, and so on
iotsecurityresources
| where type == "microsoft.iotsecurity/locations/devicegroups/devices"
| extend SubType=properties.deviceSubTypeDisplayName
| summarize Devices=count() by tostring(SubType)
| sort by Devices
New OT devices by sensor, site, and IPv4 address
iotsecurityresources
| where type == "microsoft.iotsecurity/locations/devicegroups/devices"
| extend TimeFirstSeen=properties.firstSeen
| where TimeFirstSeen > ago(1d)
| extend DeviceName=properties.deviceName
| extend Site=properties.sensor.site
| extend Sensor=properties.sensor.name
| extend IPv4=properties.nics.[0].ipv4Address
| where properties.deviceDataSource=='OtSensor'
| project TimeFirstSeen, Site, Sensor, DeviceName, IPv4
Summarize alerts by Purdue level
iotsecurityresources
    | where type == "microsoft.iotsecurity/locations/devicegroups/alerts"
    | project
        resourceId = id,
        affectedResource = tostring(properties.extendedProperties.DeviceResourceIds),
        id = properties.systemAlertId
    | join kind=leftouter (
        iotsecurityresources | where type == "microsoft.iotsecurity/locations/devicegroups/devices"
        | project
            sensor = properties.sensor.name,
            zone = properties.sensor.zone,
            site = properties.sensor.site,
            deviceProperties=properties,
            affectedResource = tostring(id)
    ) on affectedResource
    | project-away affectedResource1
    | where deviceProperties.deviceDataSource == 'OtSensor'
    | summarize Alerts=count() by tostring(deviceProperties.purdueLevel)
Next steps
Learn more about viewing dashboards and reports on the sensor console:
Learn more about Azure Monitor workbooks and Azure Resource Graph:
Feedback
Coming soon: Throughout 2024 we will be phasing out GitHub Issues as the feedback mechanism for content and replacing it with a new feedback system. For more information see: https://aka.ms/ContentUserFeedback.
Submit and view feedback for