New Analytics reports and Azure Boards app for Slack - Sprint 155 Update
In the Sprint 155 Update of Azure DevOps, we are introducing new Azure Boards reports to make it easier for you to track important team metrics. You will see the new reports under the Analytics tab in the Boards, Backlog and Sprint hubs. These reports are fully interactive and allow you to adjust them to meet your needs.
In addition, we are excited to announce the new Azure Boards app for Slack. The app will let you monitor work item activity and create work items from your Slack channel.
Check out the Features list below for more.
What’s new in Azure DevOps
Features
General:
Azure Boards:
- Get insights into your team’s health with three new Azure Boards reports
- Azure Boards app for Slack
- Customize taskboard columns
- Toggle to show or hide completed child work items on the backlog
- Search for boards, backlogs, queries and sprint from the instant search box
- Most recent tags displayed when tagging a work item
Azure Repos:
- Improved code search filtering options
- Code coverage metrics and branch policy for pull requests
- Filter comment notifications from pull requests
- Service hooks for pull request comments
Azure Artifacts:
Azure Pipelines:
Multi-stage YAML pipelines
- Approvals in multi-stage YAML pipelines
- Manage pipeline variables in YAML editor
- New predefined variables in YAML pipeline
- Cancel stage in a multi-stage YAML pipeline run
- Show correct pool information on each job
- Link work items with multi-stage YAML pipelines
- CI triggers for new branches
- Pipeline caching (public preview)
Hosted VMs
Kubernetes
- kustomize and kompose as bake options in KubernetesManifest task
- Support for cluster admin credentials in HelmDeploy task
Test
Azure experiences
- Improvements to the Deployment Center for WebApp in the Azure Portal
- Enhancements to DevOps Project for virtual machine
Integrations
General
Invite GitHub collaborators into Azure DevOps
You can now invite collaborators from GitHub to Azure DevOps when you are signed in with your GitHub identity. You can search and invite other GitHub users from the Project homepage and from the Users page in the Organization settings.
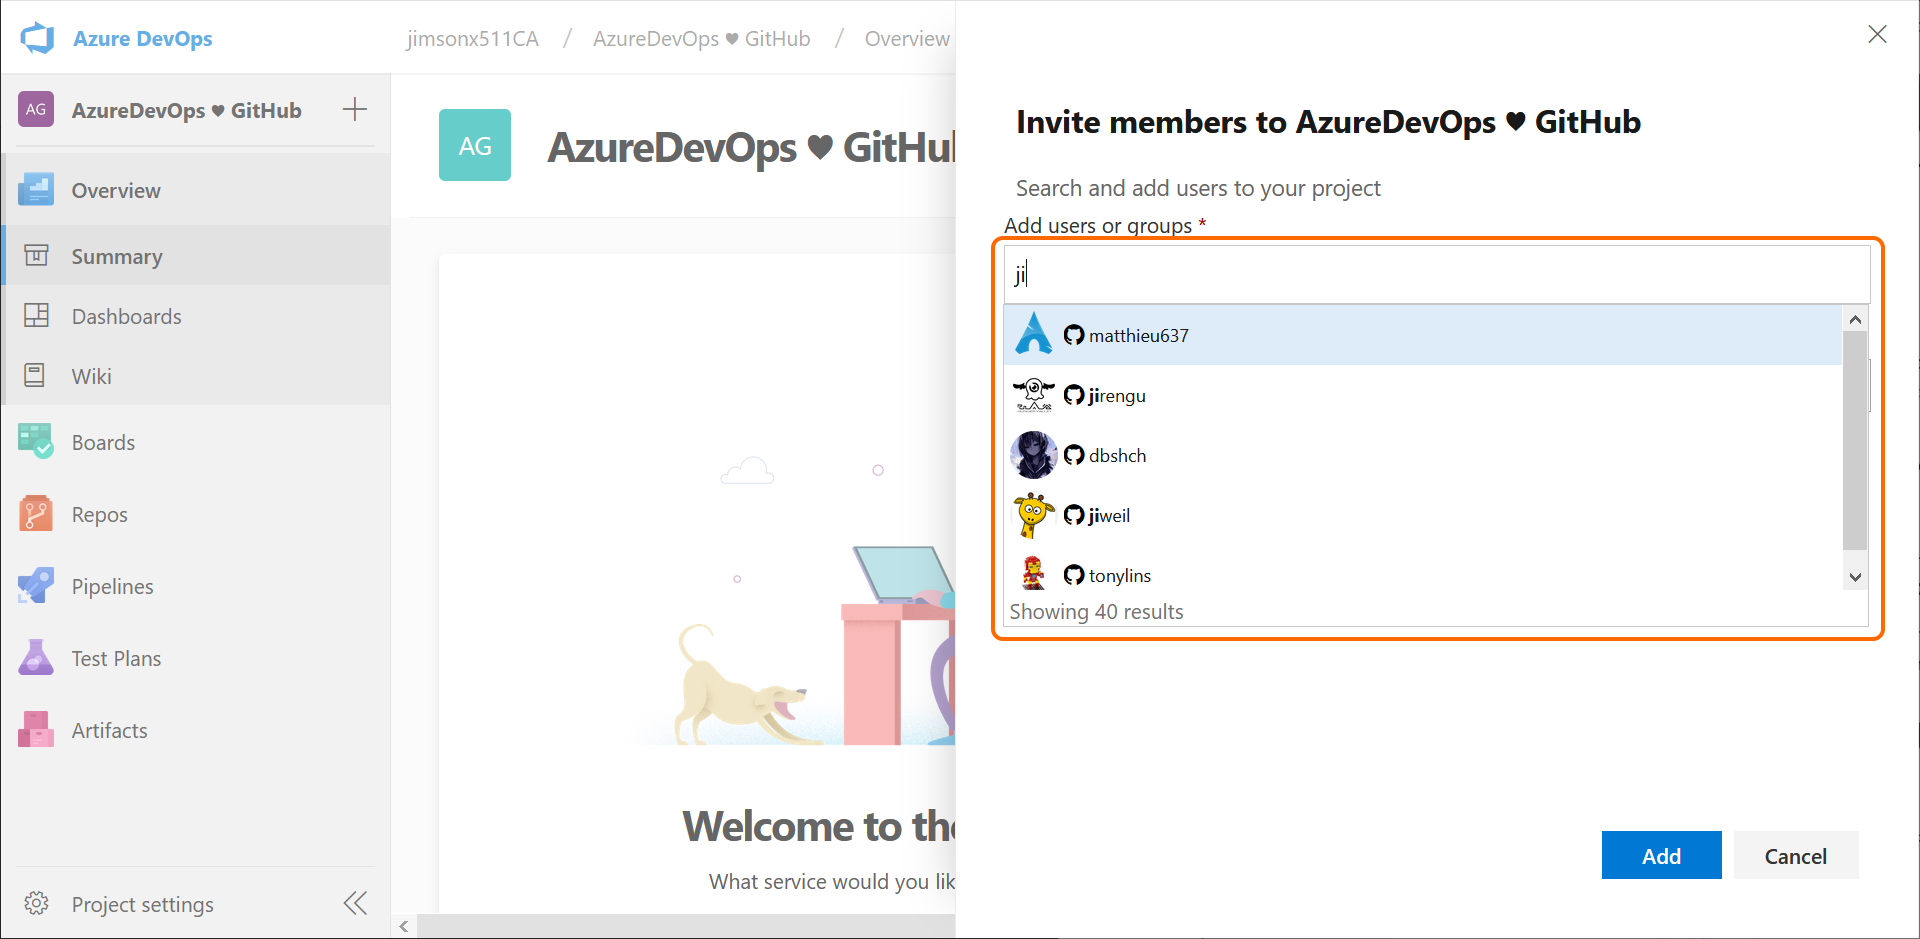
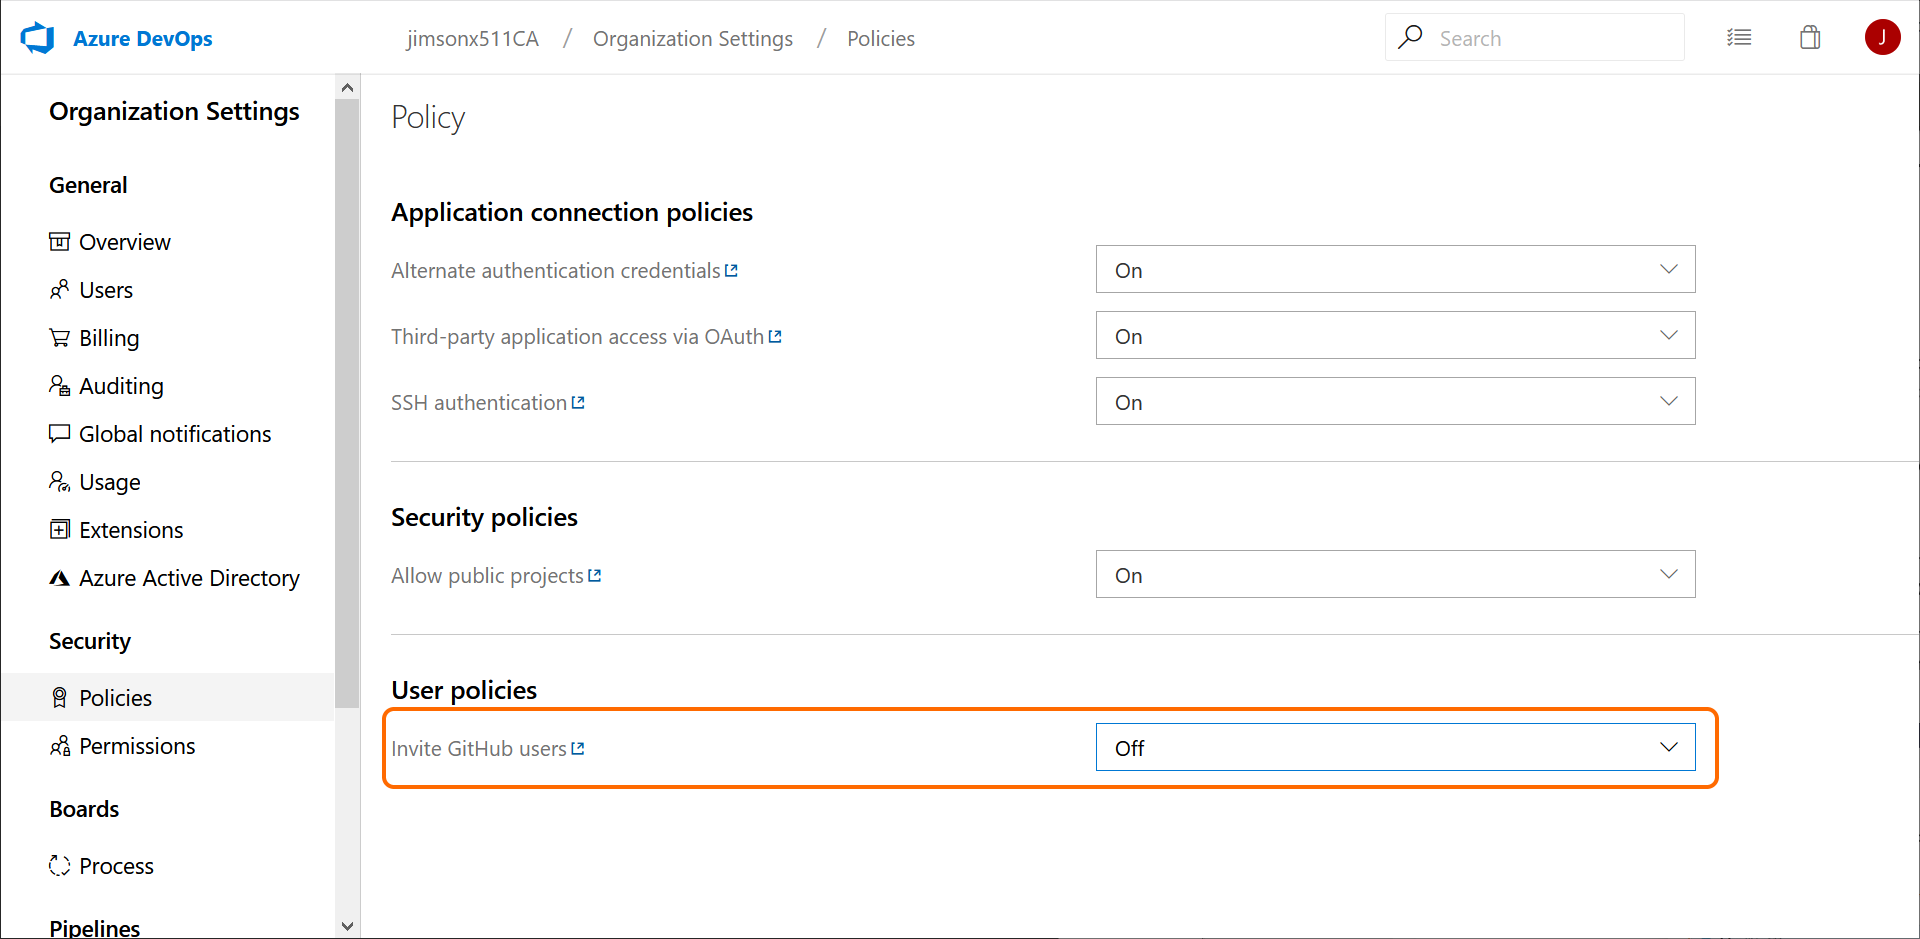
This capability must be enabled for existing organizations via a setting under Policies in the Organization settings. However, it is turned on by default for organizations created by a GitHub identity.
Note
This feature is not available for non-GitHub users, even if the policy is turned on.
To learn more about inviting team members, see the documentation here. If you are having issues connecting to Azure DevOps using GitHub, see the troubleshooting authenticating & inviting GitHub users FAQs.
Azure Boards
Get insights into your team’s health with three new Azure Boards reports
You can’t fix what you can’t see. Therefore, you want to keep a close eye on the state and health of their work processes. With these reports, we are making it easier for you to track important metrics with minimal effort in Azure Boards.
The three new interactive reports are: Burndown, Cumulative Flow Diagram (CFD) and Velocity. You can see the reports in the new analytics tab.
Metrics like sprint burndown, flow of work and team velocity give you the visibility into your team's progress and help answer questions such as:
- How much work do we have left in this sprint? Are we on track to complete it?
- What step of the development process is taking the longest? Can we do something about it?
- Based on previous iterations, how much work should we plan for next the sprint?
Note
The charts previously shown in the headers have been replaced with these enhanced reports.
The new reports are fully interactive and allow you to adjust them for your needs. You can find the new reports under the Analytics tab in each hub.
The burndown chart can be found under the Sprints hub.

The CFD and Velocity reports can be accessed from the Analytics tab under Boards and Backlogs by clicking on the relevant card.

With the new reports you have more control and information about your team. Here are some examples:
- The Sprint Burndown and the Velocity reports can be set to use count of work items or sum of remaining work.
- You can adjust the timeframe of the sprint burndown without affecting the project dates. So, if your team usually spends the first day of each sprint planning, you can now match the chart to reflect that.
- The Burndown chart now has a watermark showing weekends.
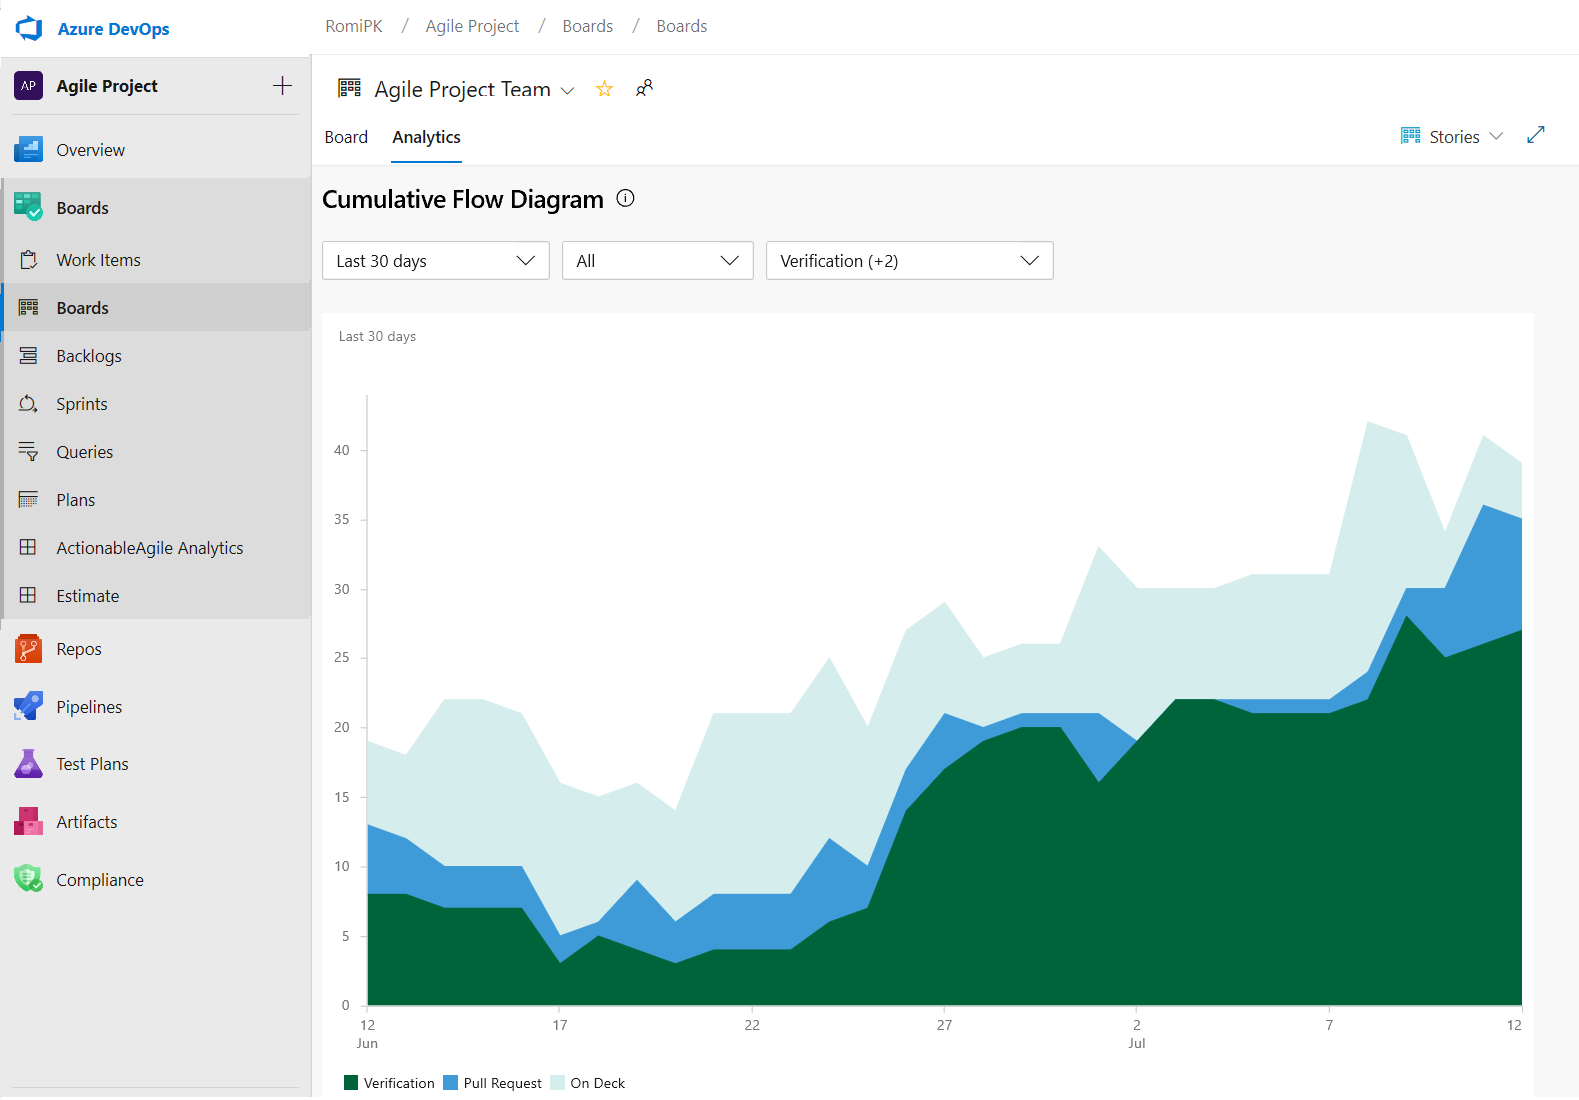
- The CFD report lets you remove board columns like Design to gain more focus on the flow the teams have control on.
Here is an example of the CFD report showing the flow for the last 30 days of the Stories backlog.
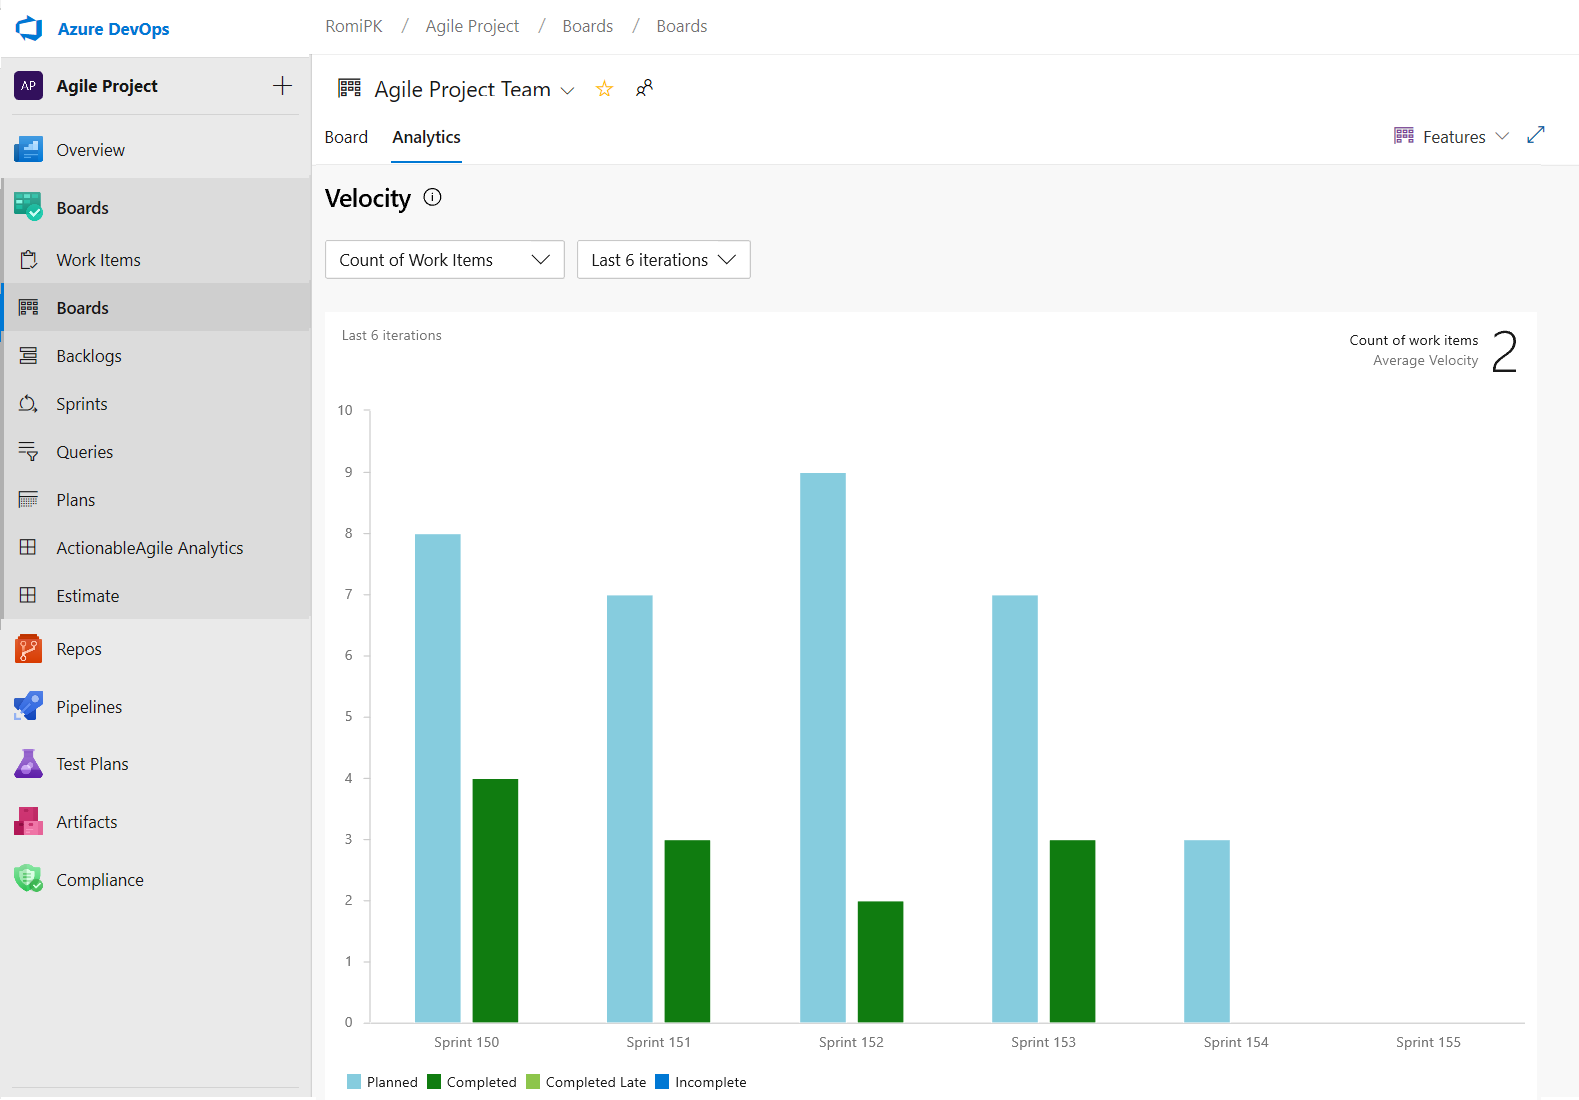
The Velocity chart can now be tracked for all backlog levels. For example, you can now add both Features and Epics whereas before the previous chart supported only Requirements. Here is an example of a velocity report for the last 6 iterations of the Features backlog.
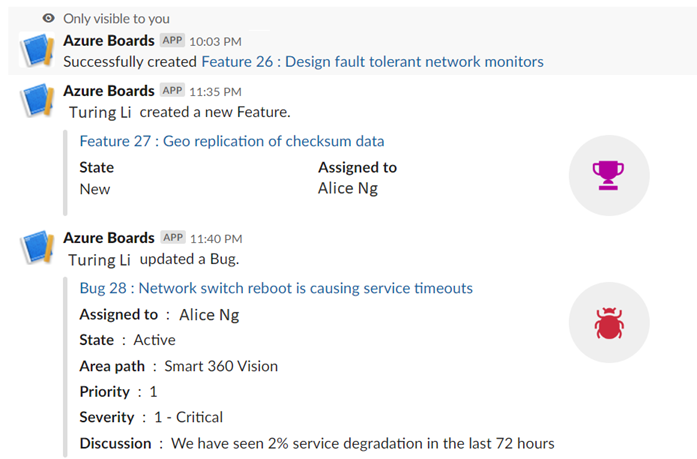
Azure Boards app for Slack
We're happy to announce the new Azure Boards app for Slack. With this app you can monitor work item activity and create work items from your Slack channel.
The app allows you to set up and manage event subscriptions including creation, and work item updates, and to get notifications for these events in your Slack channel. The conversations in the Slack channel can be used to create work items. You will also get personal notifications when work items are assigned to you. In addition, previews for work item URLs will let you initiate discussions.
To install the Azure Boards app, click here.
Customize Taskboard columns
We're excited to announce that we added an option to let you customize the columns on the Taskboard. You can now add, remove, rename, and reorder the columns.
To configure the columns on your Taskboard, go to Column Options.

This feature was prioritized based on a suggestion from the Developer Community.
Toggle to show or hide completed child work items on the backlog
Many times, when refining the backlog, you only want to see items that have not been completed. Now, you have the ability to show or hide completed child items on the backlog.
If the toggle is on, you will see all child items in a completed state. When the toggle is off, all child items in a completed state will be hidden from the backlog.

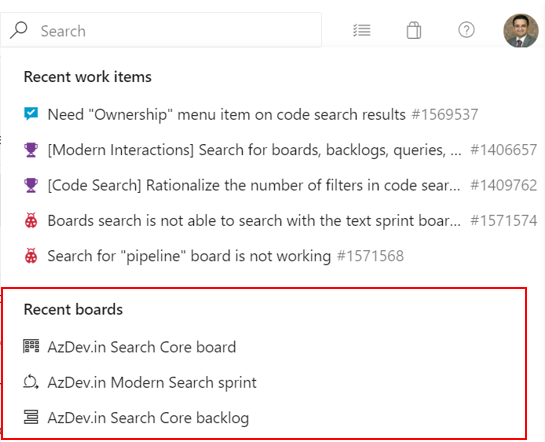
Search for boards, backlogs, queries and sprint from the instant search box
Now you can easily access your recently visited boards, backlogs, queries and sprints from the search box by activating the search box in Azure Boards.
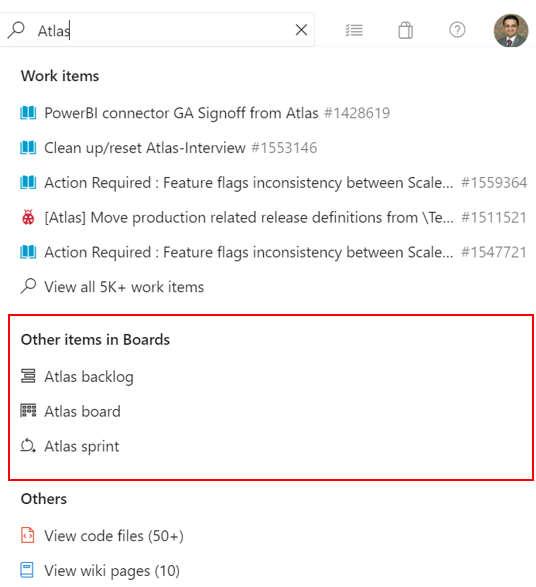
In addition, you can search for the boards, backlogs, queries and sprints across your project by typing the board name in the search box. Now, the boards that matter most to you are just a click away.
Most recent tags displayed when tagging a work item
When tagging a work item, the auto-complete option will now display up to five of your most recently used tags. This will make it easier to add the right information to your work items.

Azure Repos
Improved code search filtering options
Previously, code search supported 39 code search filters such as comment: and def:. Data suggested that there were many filters not being used, therefore we are removing a few filters and merging others. With this update we reduced the number of filters to 19. This will help by making code search queries more efficient and reduce clutter in the interface.

For example, now func: maps to method:, i.e. if you search for func:AccountAdmin, the results will be mapped to method:AccountAdmin. Similarly macrodef: and macroref: are mapped to macro:. On the other hand, filters such as union: and org: have been deprecated due to lack of use.
Code coverage metrics and branch policy for pull requests
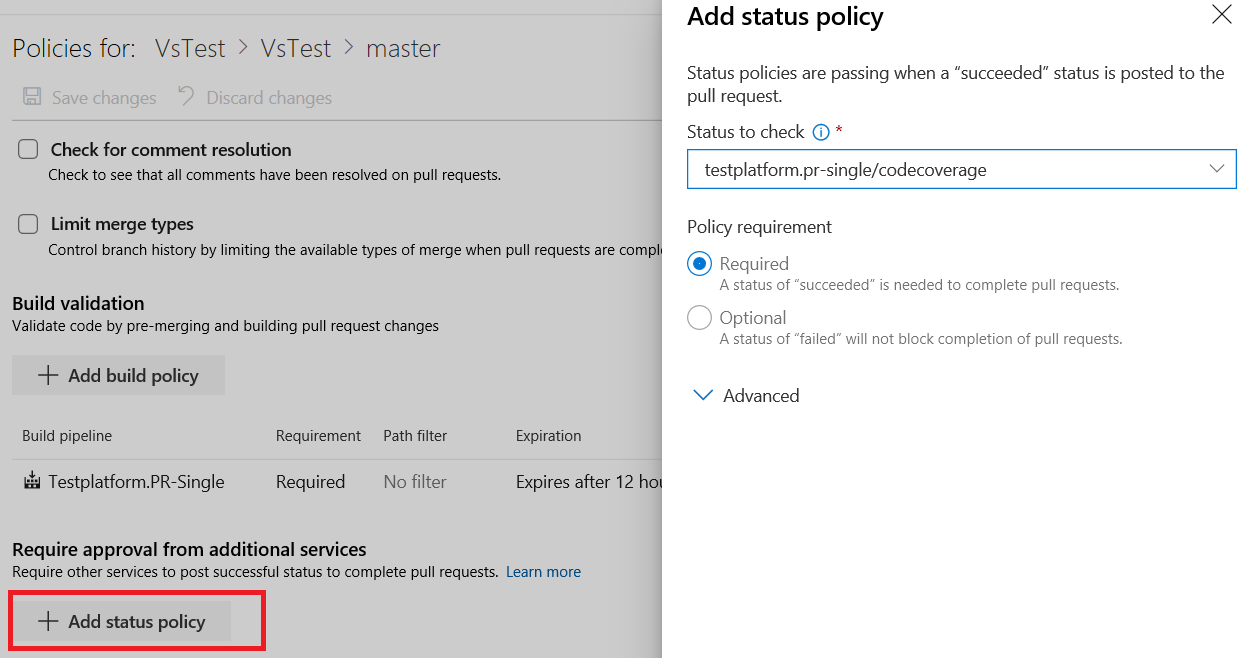
You can now see code coverage metrics for changes within the pull request (PR) view. This ensures that you have adequately tested your changes through automated tests. Coverage status will appear as a comment in the PR overview. You can view details of coverage information for every code line that is changed in the file diff view.
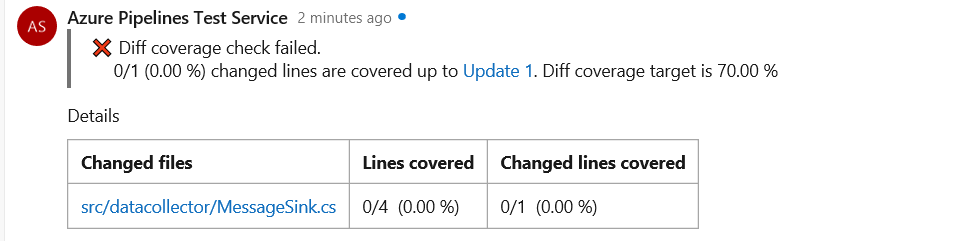
Additionally, repo owners can now set code coverage policies and prevent large, untested changes from being merged into a branch. Desired coverage thresholds can be defined in an azurepipelines-coverage.yml settings file that is checked in at the root of the repo and coverage policy can be defined using the existing configure a branch policy for additional services capability in Azure Repos.
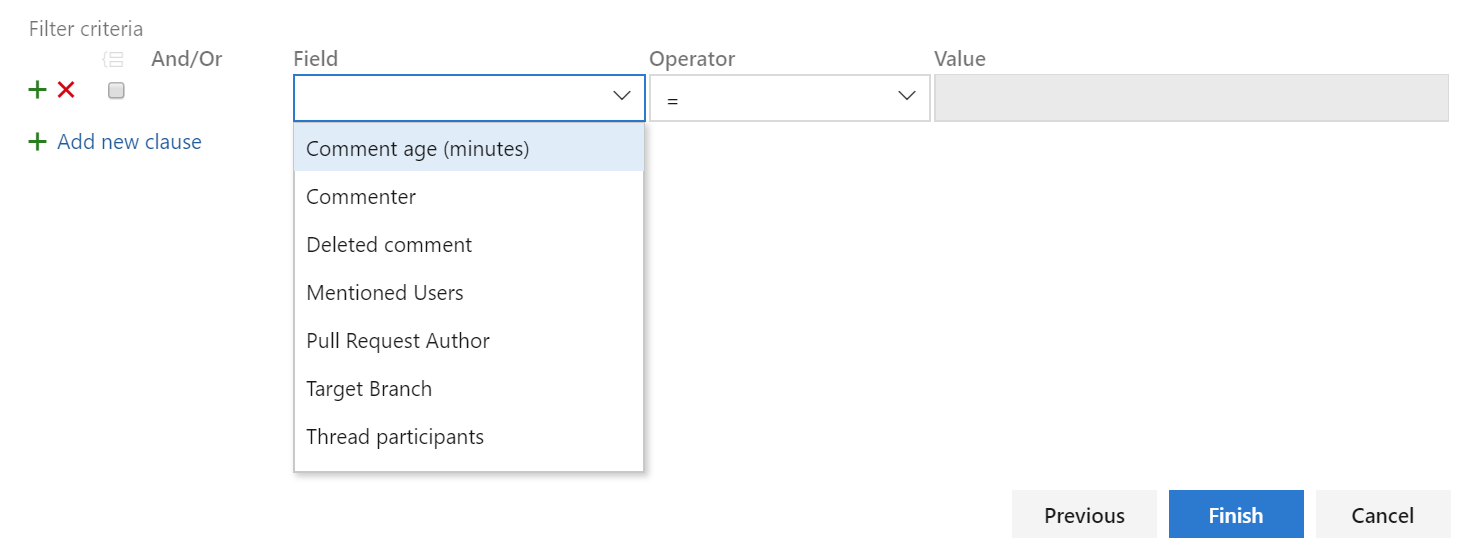
Filter comment notifications from pull requests
Comments in pull requests can often generate a lot of noise due to notifications. We've added a custom subscription that allows you to filter which comment notifications you subscribe to by comment age, commenter, deleted comment, mentioned users, pull request author, target branch and thread participants. You can create these notification subscriptions by clicking the user icon on the top right corner and navigating to User settings.

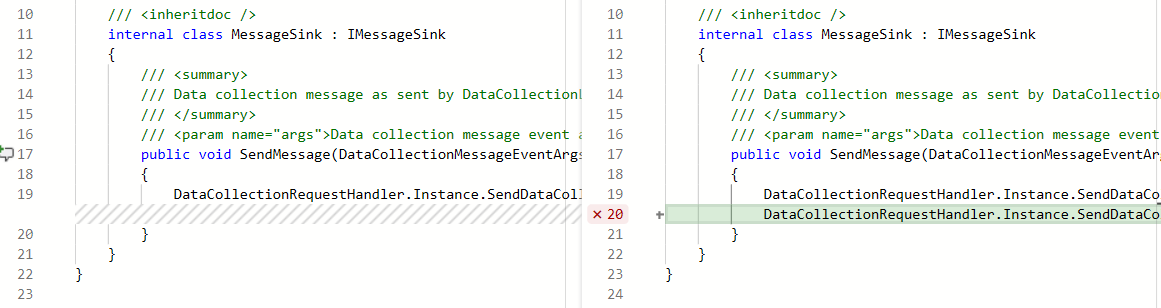
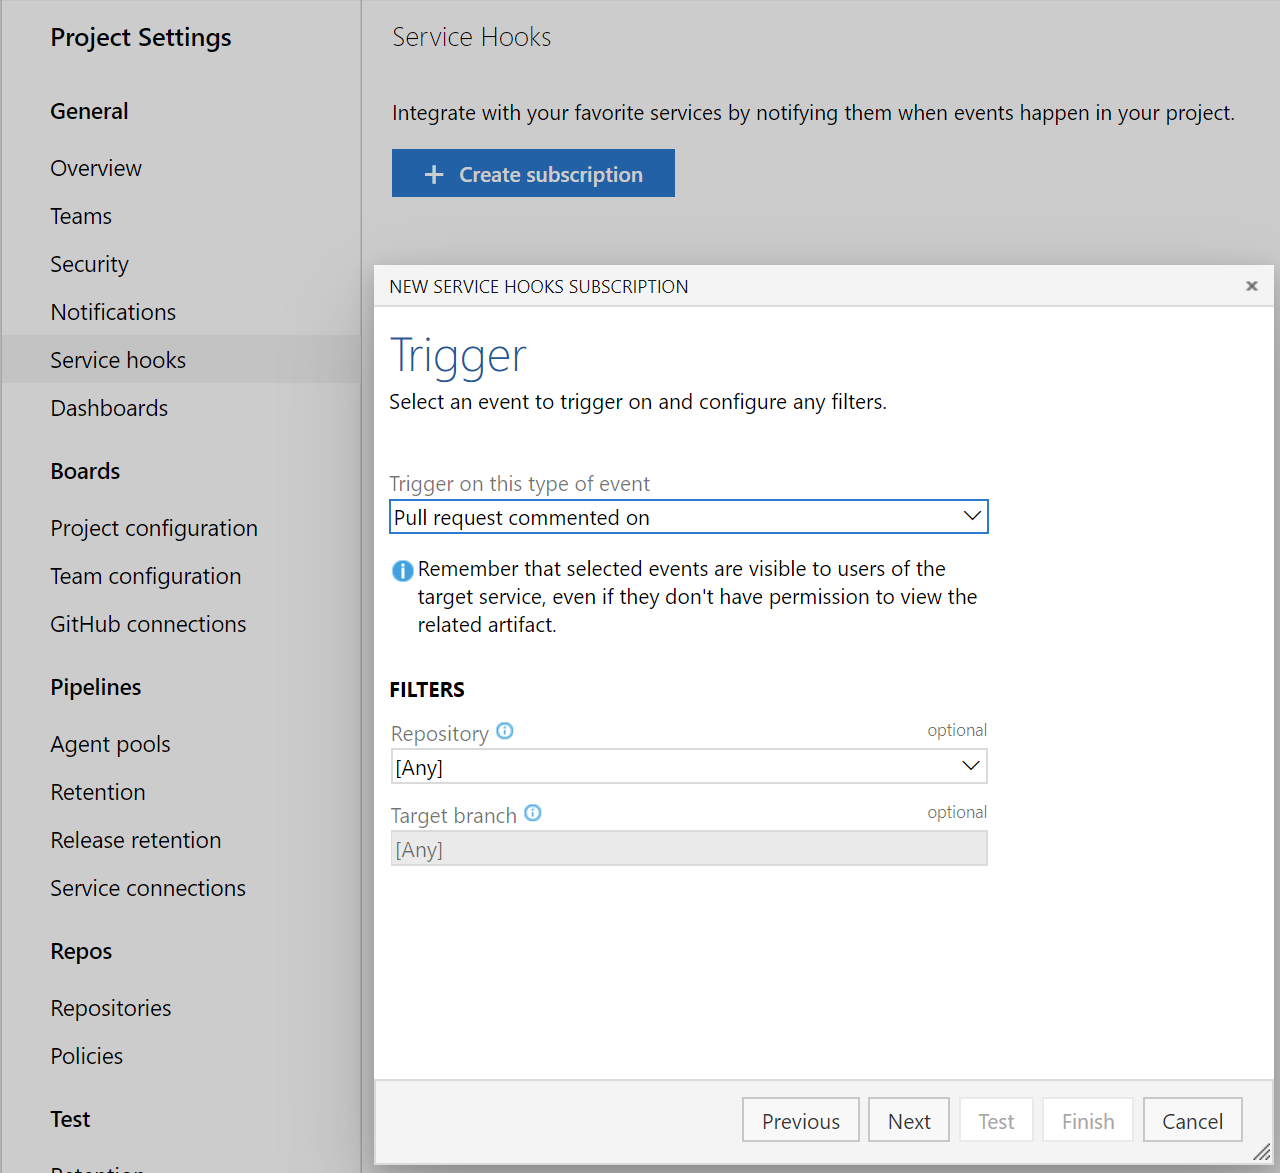
Service hooks for pull request comments
You can now create service hooks for comments in a pull request based on repository and target branch.
Azure Artifacts
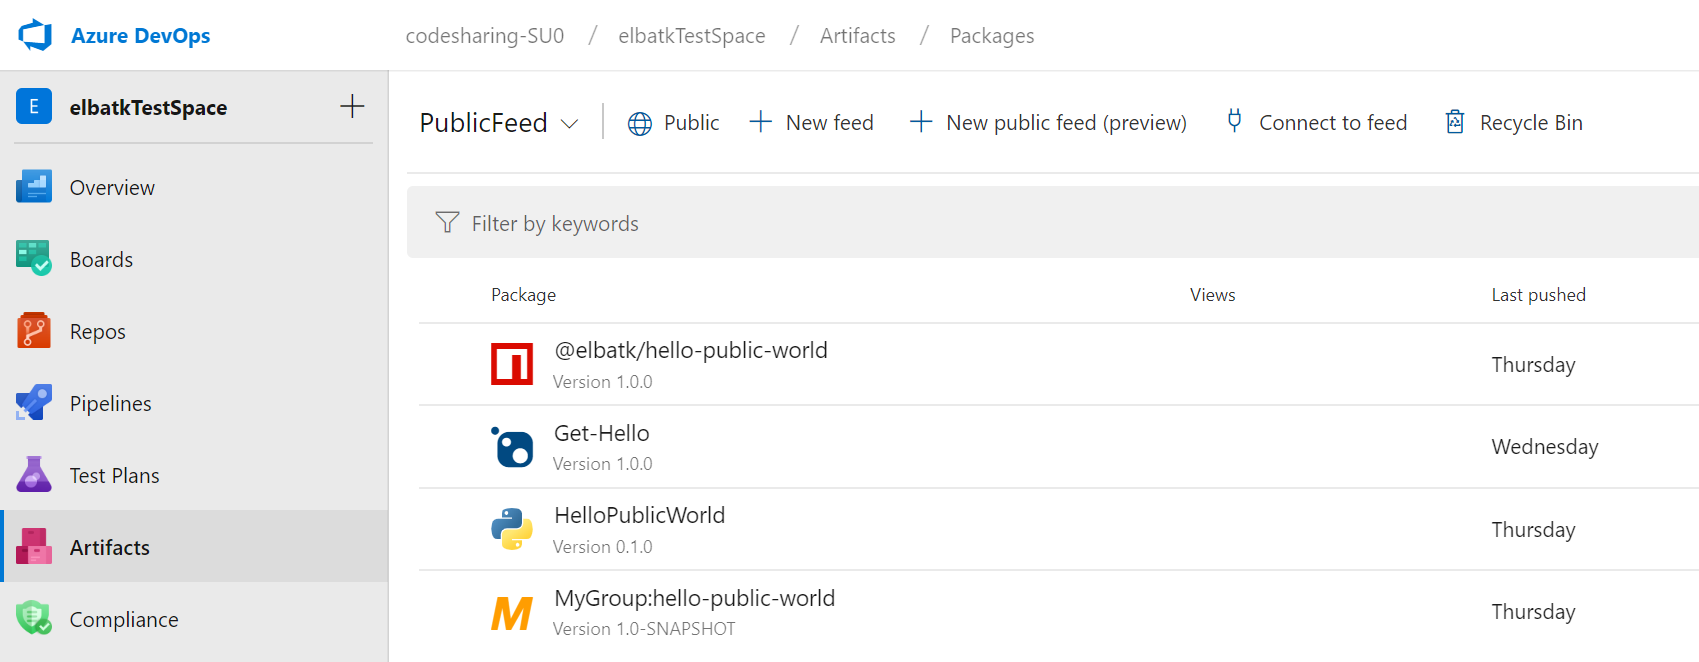
Share your packages publicly with public feeds (preview)
You can now create and store your packages inside public feeds. Packages stored within public feeds are available to everyone on the internet without authentication, whether or not they're in your organization, or even logged into an Azure DevOps organization. Learn more about public feeds in our feeds documentation or jump right into our tutorial for sharing packages publicly.
Azure Pipelines
kustomize and kompose as bake options in KubernetesManifest task
kustomize (part of Kubernetes sig-cli) let you customize raw, template-free YAML files for multiple purposes and leaves the original YAML untouched. An option for kustomize has been added under bake action of KubernetesManifest task so that any folder containing kustomization.yaml files can be used for generating the manifest files used in the deploy action of the KubernetesManifest task.
steps:
- task: KubernetesManifest@0
  name: bake
  displayName: Bake K8s manifests from Helm chart
  inputs:
    action: bake
    renderType: kustomize
    kustomizationPath: folderContainingKustomizationFile

- task: KubernetesManifest@0
  displayName: Deploy K8s manifests
  inputs:
    kubernetesServiceConnection: k8sSC1
    manifests: $(bake.manifestsBundle)
kompose will transform a Docker Compose files into a Kubernetes resource.
steps:
- task: KubernetesManifest@0
  name: bake
  displayName: Bake K8s manifests from Helm chart
  inputs:
    action: bake
    renderType: kompose
    dockerComposeFile: docker-compose.yaml

- task: KubernetesManifest@0
  displayName: Deploy K8s manifests
  inputs:
    kubernetesServiceConnection: k8sSC1
    manifests: $(bake.manifestsBundle)
Support for cluster admin credentials in HelmDeploy task
Previously, the HelmDeploy task used the cluster user credentials for deployments. This resulted in interactive login prompts and failing pipelines for an Azure Active Directory based RBAC enabled cluster. To address this issue, we added a checkbox that lets you use cluster admin credentials instead of a cluster user credentials.

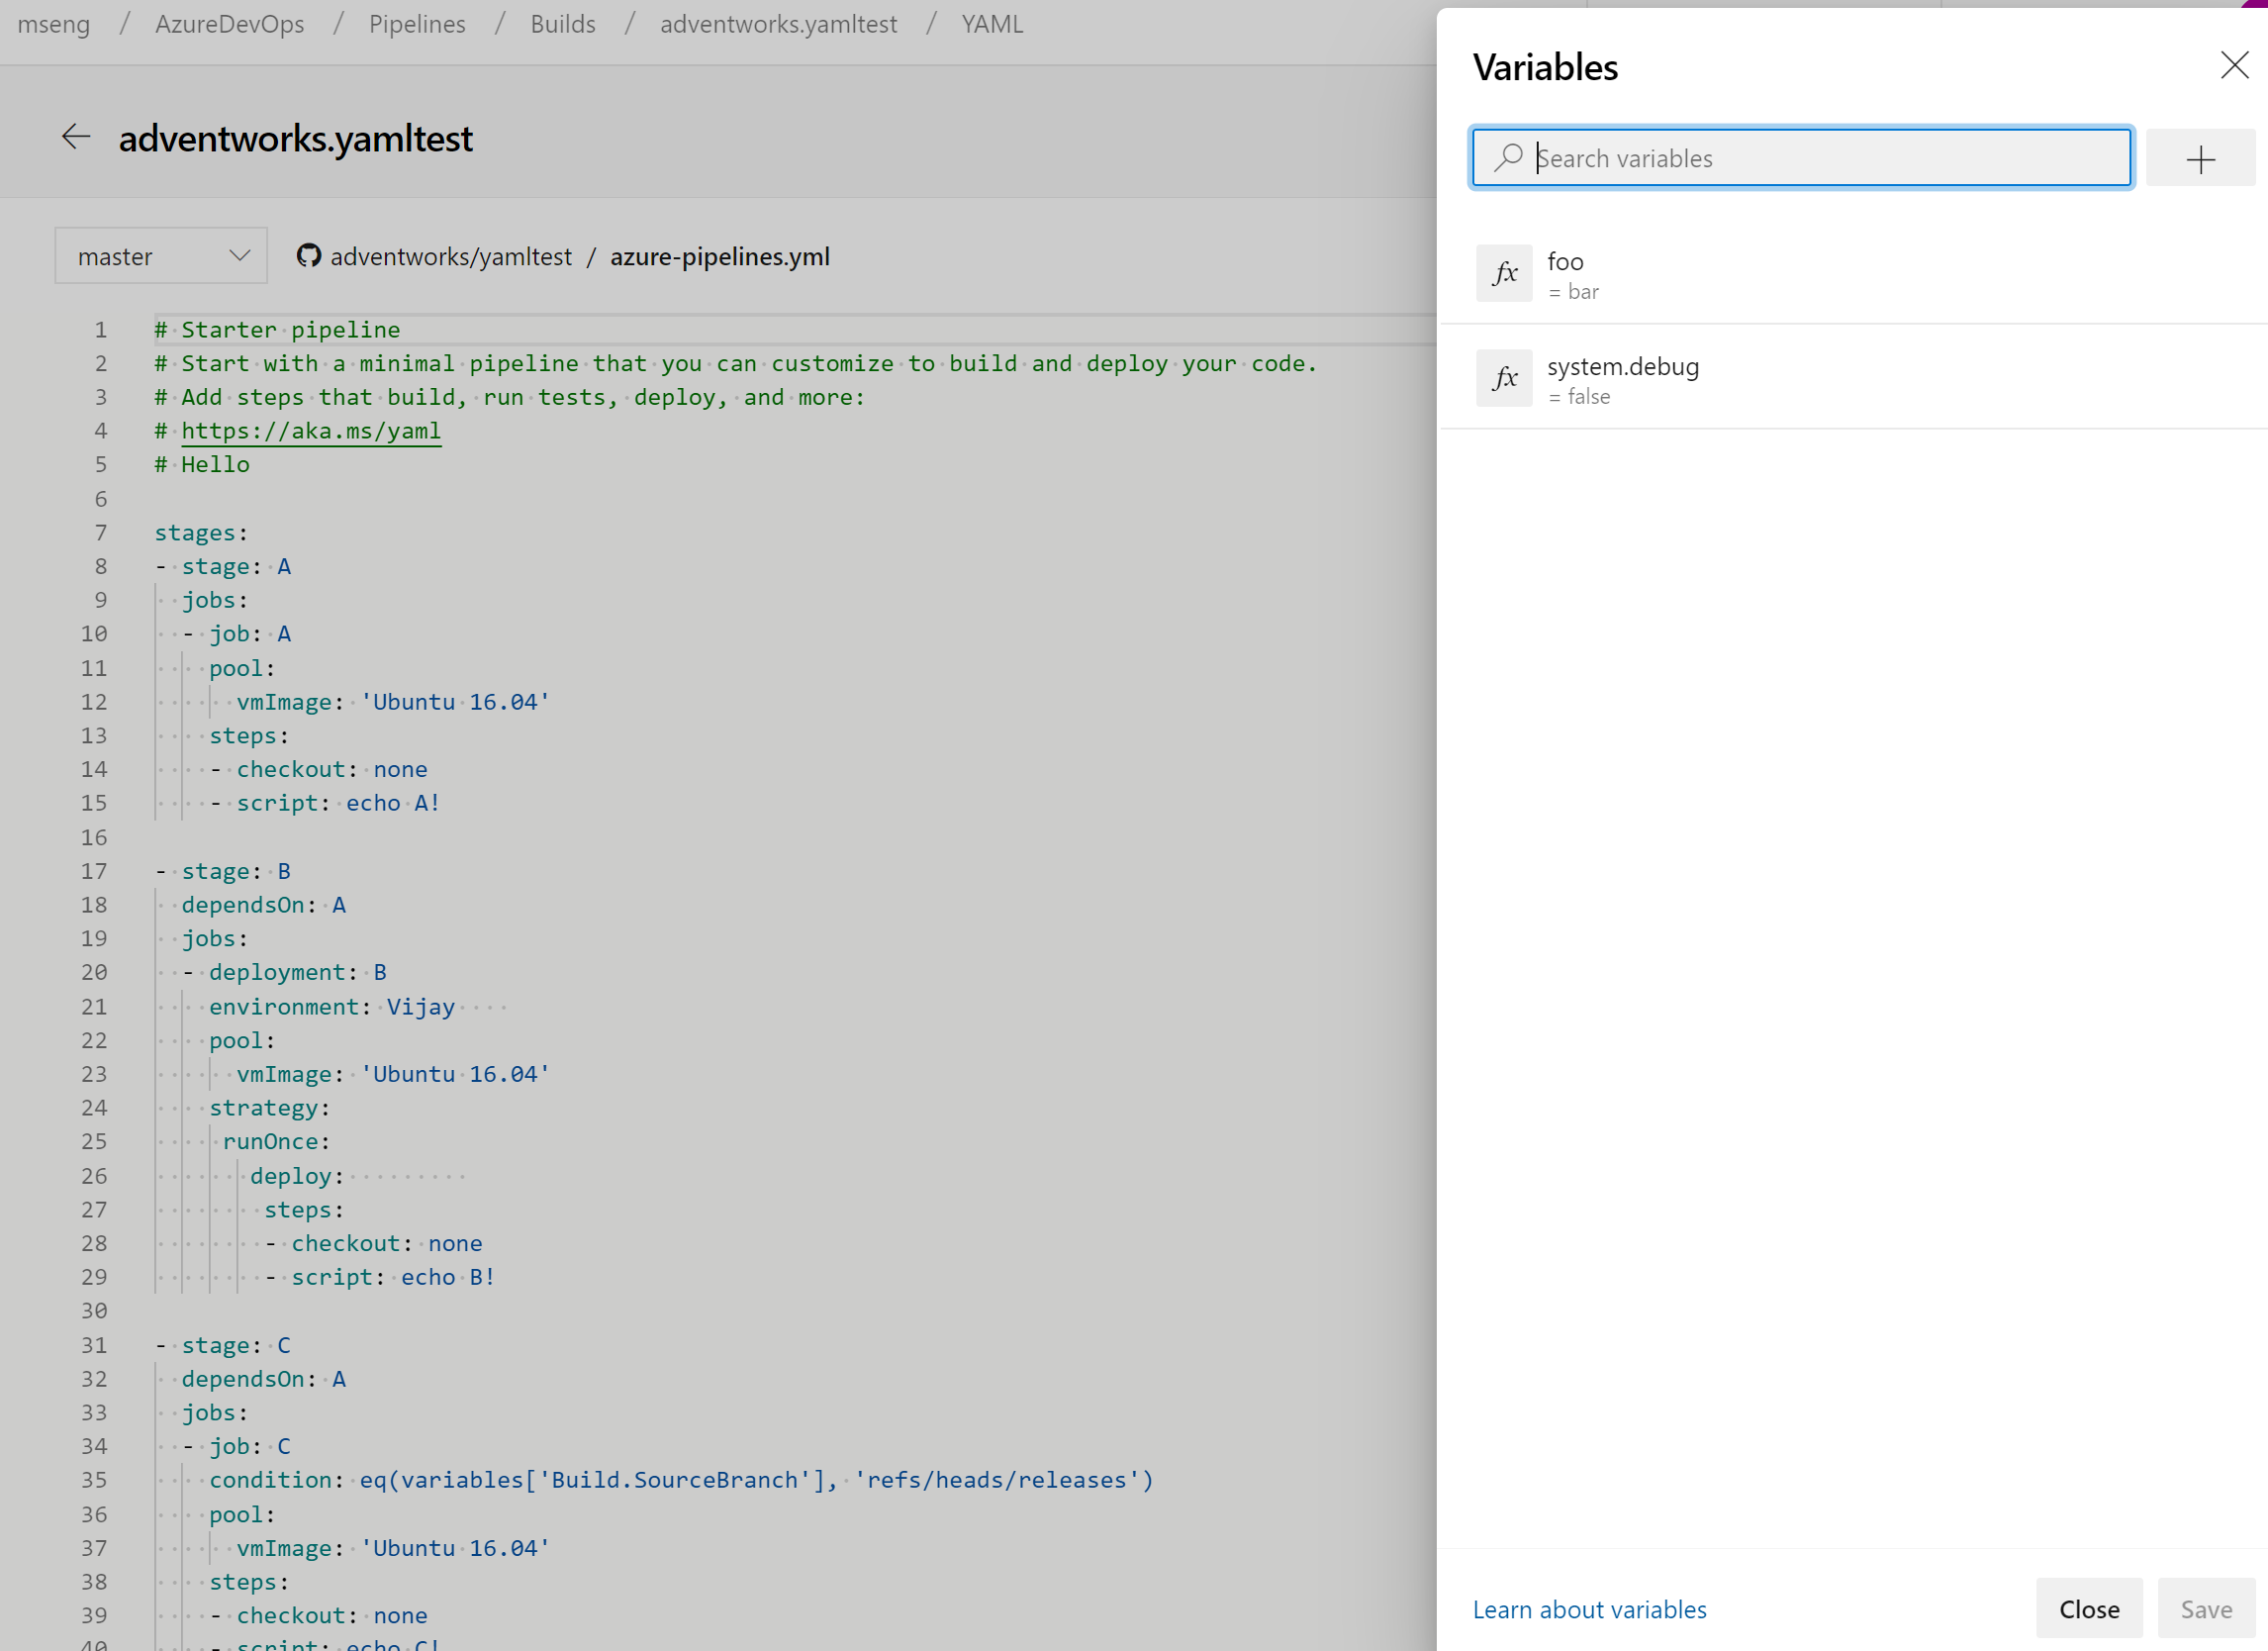
Manage pipeline variables in YAML editor
We updated the experience for managing pipeline variables in the YAML editor. You no longer have to go to the classic editor to add or update variables in your YAML pipelines.
New predefined variables in YAML pipeline
Variables give you a convenient way to get key bits of data into various parts of your pipeline. With this update, we've added a few predefined variables to a deployment job. These variables are automatically set by the system, scoped to the specific deployment job and are read-only.
- Environment.Id - The ID of the environment.
- Environment.Name - The name of the environment targeted by the deployment job.
- Environment.ResourceId - The ID of the resource in the environment targeted by the deployment job.
- Environment.ResourceName - The name of the resource in the environment targeted by the deployment job.
Link work items with multi-stage YAML pipelines
Currently, you can automatically link work items with classic builds. However, this wasn't possible with YAML pipelines. With this update, we've addressed this gap. When you run a pipeline successfully using code from a specified branch, Azure Pipelines will automatically associate the run with all the work items (which are inferred through the commits in that code). When you open the work item, you'll be able to see the runs in which the code for that work item was built. To configure this, use the settings panel of a pipeline.
Cancel stage in a multi-stage YAML pipeline run
When running a multi-stage YAML pipeline, you can now cancel the execution of a stage while it is in progress. This is helpful if you know that the stage is going to fail or if you have another run that you want to start. This feature is also a pre-requisite for us to support retrying a failed stage in the future.
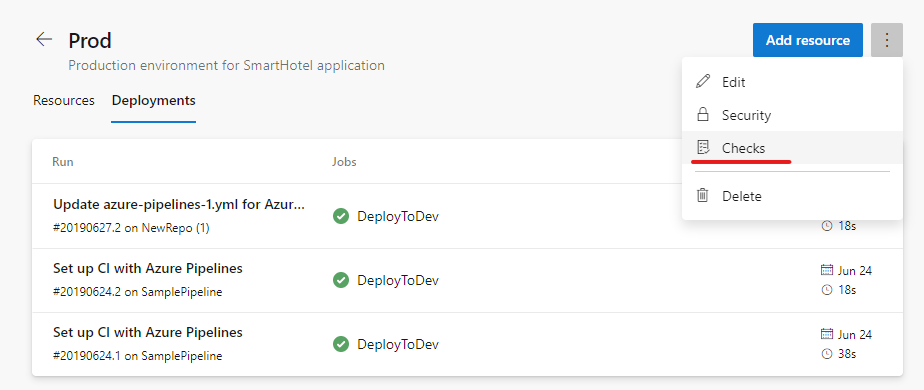
Approvals in multi-stage YAML pipelines
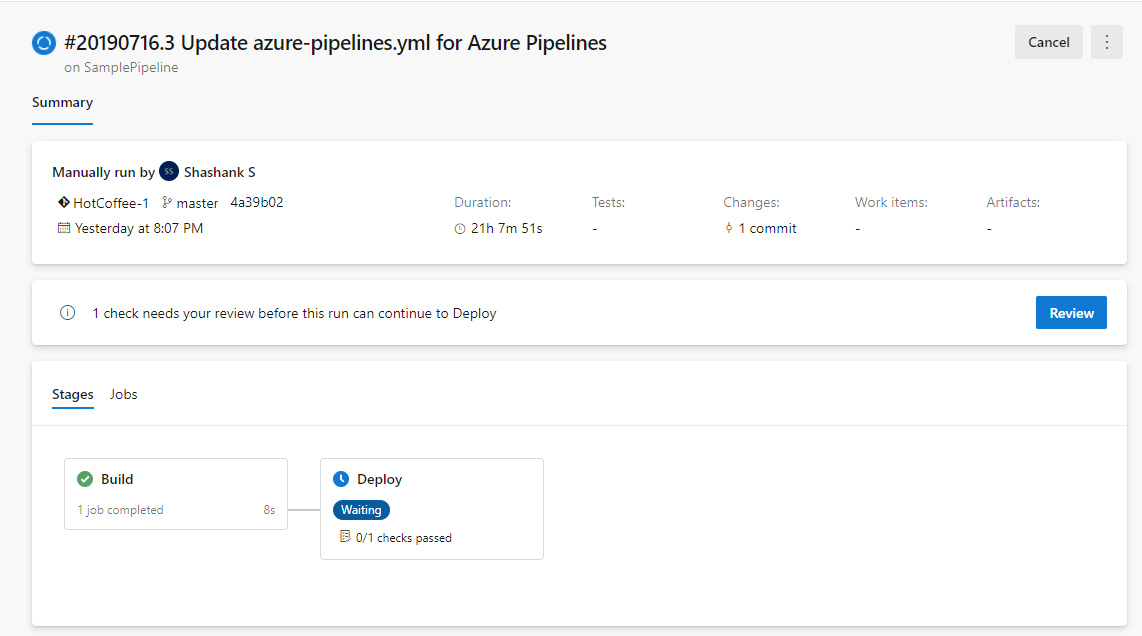
We continue to improve multi-stage YAML pipelines, we now let you add manual approvals to these pipelines. Infrastructure owners can protect their environments and seek manual approvals before a stage in any pipeline deploys to them. With complete segregation of roles between infrastructure (environment) and application (pipeline) owners, you'll ensure manual sign off for deployment in a particular pipeline and get central control in applying the same checks across all deployments to the environment.
The pipeline runs deploying to dev will stop for approval at the start of the stage.
Updates to hosted pipelines images
We've made updates to several of the Azure Pipelines hosted VM images. You can find more details about the latest releases here. The following changes were added as part of this update:
For VS2017 and VS2019:
- Added Azul Java 7
- Pinned cached Docker images to match host kernel version
- Added Az PowerShell module v2.3.2
- Pinned Mercurial to v5.0.0
- Updated Python to versions 2.7.16, 3.4.4, 3.5.4, 3.6.8, 3.7.4
- Added Portable Class Library (VS 2019 only)
- Changed Rust default paths and environment variables
For Ubuntu 16.04:
- Updated helm to always pull latest (no longer pinned at v2.14.0)
- Added several popular Docker containers
- Updated Python to versions 2.7.16, 3.4.10, 3.5.7, 3.6.9, 3.7.4
- Changed Rust default paths and environment variables
For all images, added an
ImageVersionenvironment variable for the version of the image
For a full list of tools available for a particular image, go to Settings > Agent pools > Details.
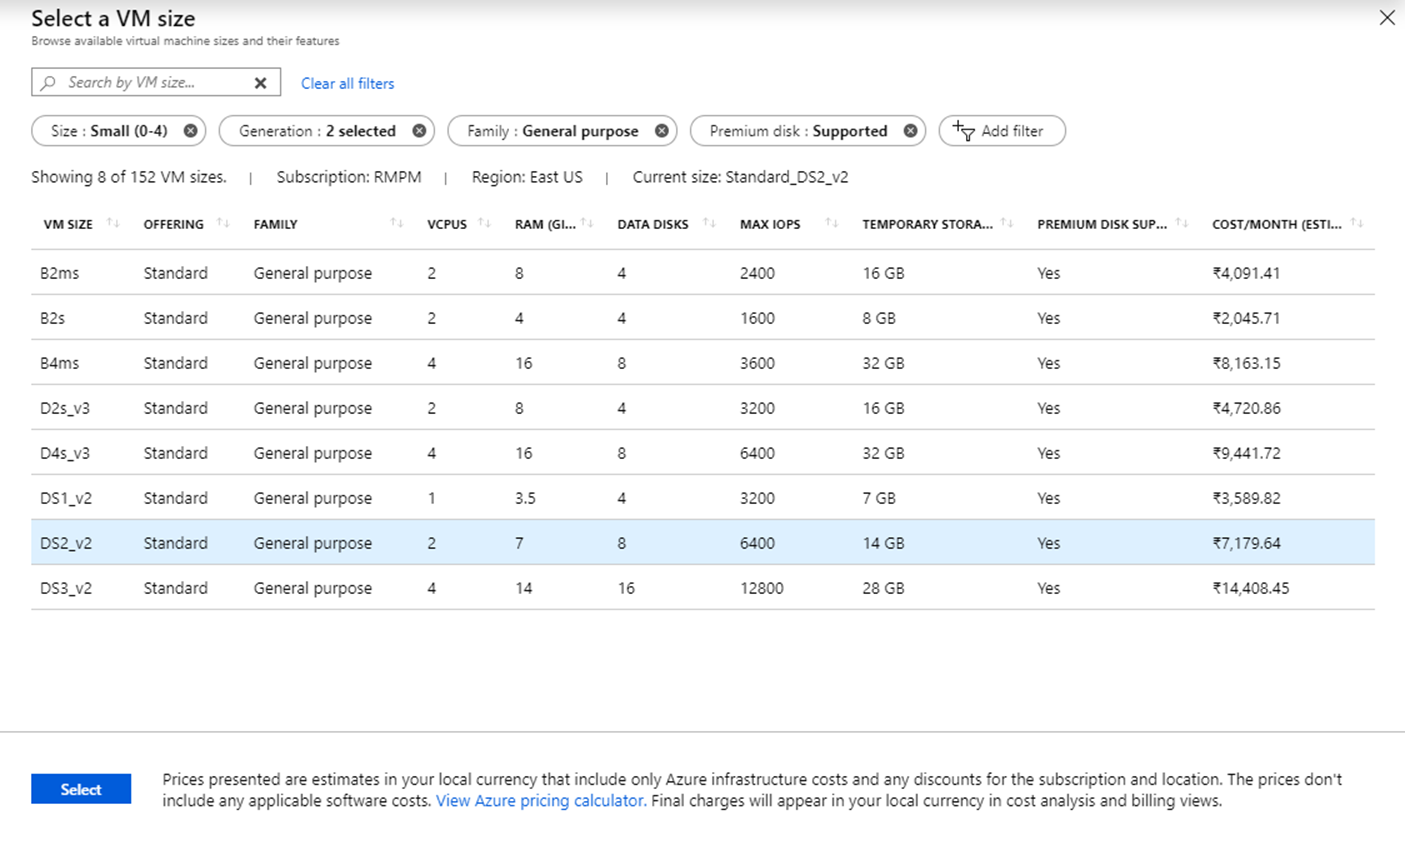
Enhancements to DevOps Project for virtual machine
In this update, we enhanced the DevOps Projects virtual machine (VM) workflow to include the VMs that don't comply with the per location quota restriction. Previously, you had to choose the VM by name and offering. Now, you have an on-demand view with more details about the VM offerings such as cost/month, RAM, data disks etc. This makes it easier for you to select the virtual machine that you need.
Single hosted pool
In the last sprint, we communicated that we're rolling out a new hosted pool called Azure Pipelines to replace all the other hosted pools - Hosted, Hosted VS2017, Hosted Ubuntu 1604, Hosted Windows 2019 with VS2019, Hosted macOS, and Hosted macOS High Sierra. This change will be implemented with this release.
Having multiple hosted pools can be confusing at times. You don't get an accurate picture of where concurrency is being consumed. For example, if you have a concurrency of 10 parallel jobs, you see 10 virtual agents in each of the hosted pools, which isn't accurate. When your job is waiting on a specific hosted pool (e.g. Hosted VS2017) with all idle agents, you may think that Azure Pipelines service is broken without realizing that the concurrency is possibly consumed in other hosted pools (e.g. Hosted Ubuntu 1604).
With this change, you'll see a single hosted pool that will give you an accurate picture of how many jobs are running in that pool. We plan to roll out this change over the next few sprints. You won't have to make any changes to your pipelines since we'll automatically redirect jobs from the old hosted pools to the appropriate image in the new unified pool.
Show correct pool information on each job
Previously, when you used a matrix to expand jobs or a variable to identify a pool, we had trouble showing correct pool information in the logs pages. With this update, we fixed the issues causing incorrect pool information to be shown for certain jobs.
In-product support for flaky test management
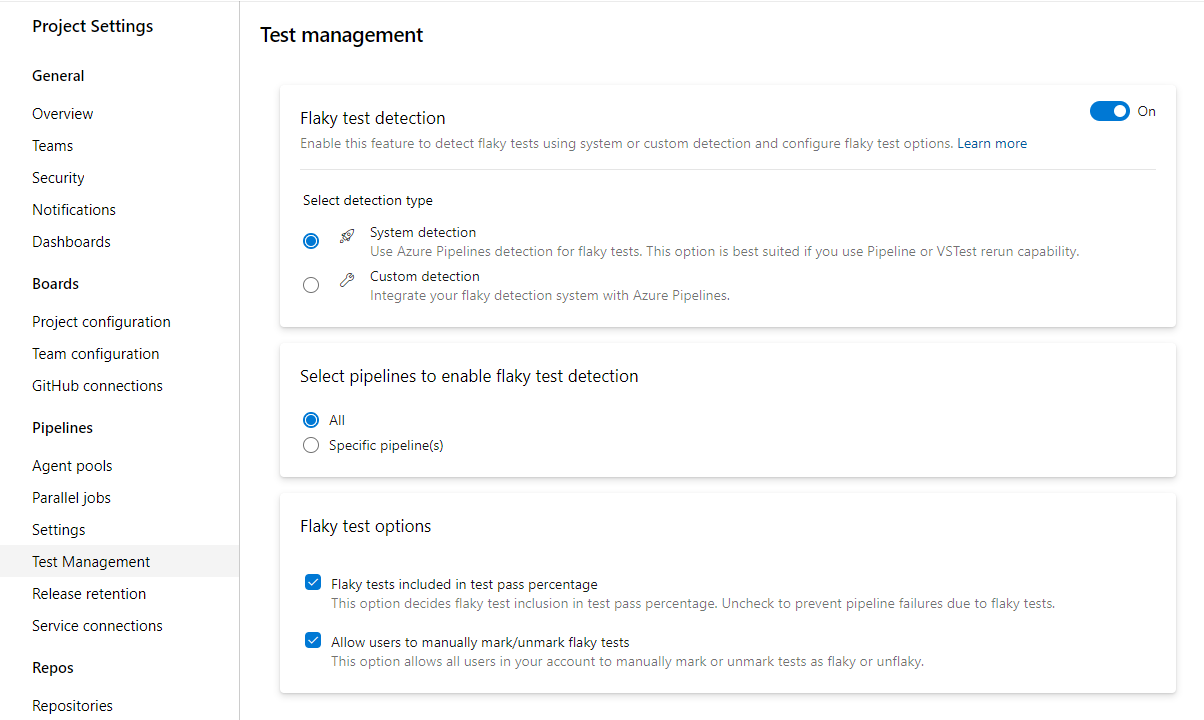
Flaky tests can affect developers' productivity since test failures may not be related to the changes under test. They can also impact the quality of shipped code. This is why we added in-product support for flaky test management. This functionality supports end-to-end lifecycle with detection, reporting and resolution. Flaky test management supports system and custom detection.
System detection is available via VSTest task rerun capability. A flaky test is a test that provides different outcomes, such as pass or fail, even when there are no changes in the source code or execution environment. All further executions of test for the same branch are also marked flaky until it's resolved and unmarked. You can also plug in your custom detection mechanism using our APIs. Once a test is identified as flaky, you can get the details in the in-context test report in the pipeline. You can then decide whether the flaky tests impact your pipeline failure. By default, flaky test information is available as additional meta-data.
Here's an example of a report with the test summary.
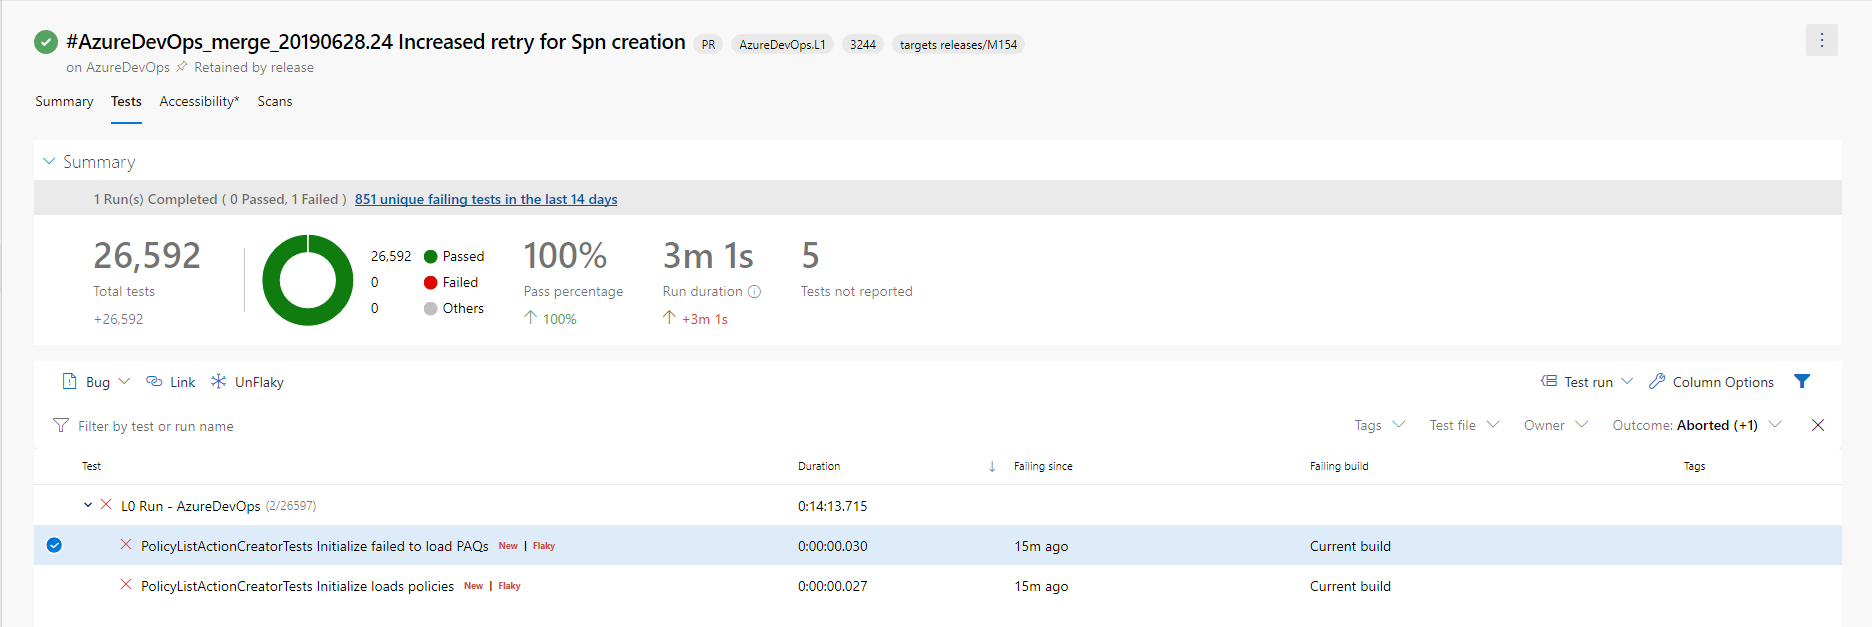
For more details about flaky test management, see the documentation here.
Improvements to the Deployment Center for WebApp in the Azure portal
We've improved the Deployment Center for WebApp in the Azure portal with support for pipelines with multiple artifacts. Now, if a non-primary artifact of Azure Pipelines is deployed on the web app, you'll get relevant details from the Azure portal. You'll also have a deep link to the deployed repo to navigate directly to the repo from the Azure portal. The repo can be hosted in Azure Repos or in GitHub.
CI triggers for new branches
It has been a long pending request to not trigger CI builds when a new branch is created and when that branch doesn't have changes. Consider the following examples:
- You use the web interface to create a new branch based on an existing branch. This would immediately trigger a new CI build if your branch filter matches the name of the new branch. This is unwanted because the content of the new branch is the same when compared to the existing branch.
- You have a repository with two folders - app and docs. You set up a path filter for CI to match "app". In other words, you don't want to create a new build if a change has been pushed to docs. You create a new branch locally, make some changes to docs, and then push that branch to the server. We used to trigger a new CI build. This is unwanted since you explicitly asked not to look for changes in docs folder. However, because of the way we handled a new branch event, it would seem as if a change has been made to the app folder as well.
Now, we have a better way of handling CI for new branches to address these problems. When you publish a new branch, we explicitly look for new commits in that branch, and check whether they match the path filters.
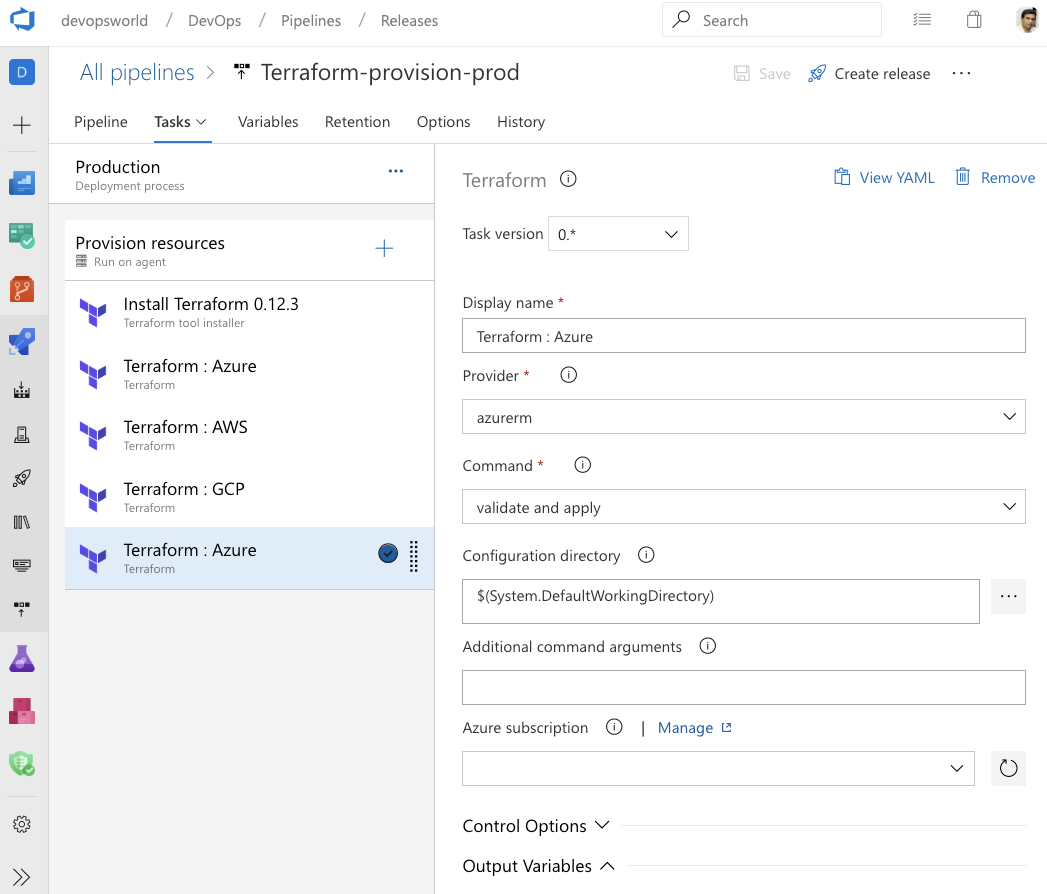
Terraform integration with Azure Pipelines
Terraform is an open-source tool for developing, changing and versioning infrastructure safely and efficiently. Terraform codifies APIs into declarative configuration files allowing you to define and provision infrastructure using a high-level configuration language. You can use the Terraform extension to create resources across all major infrastructure providers: Azure, Amazon Web Services (AWS) and Google Cloud Platform (GCP).
To learn more about the Terraform extension, see the documentation here.
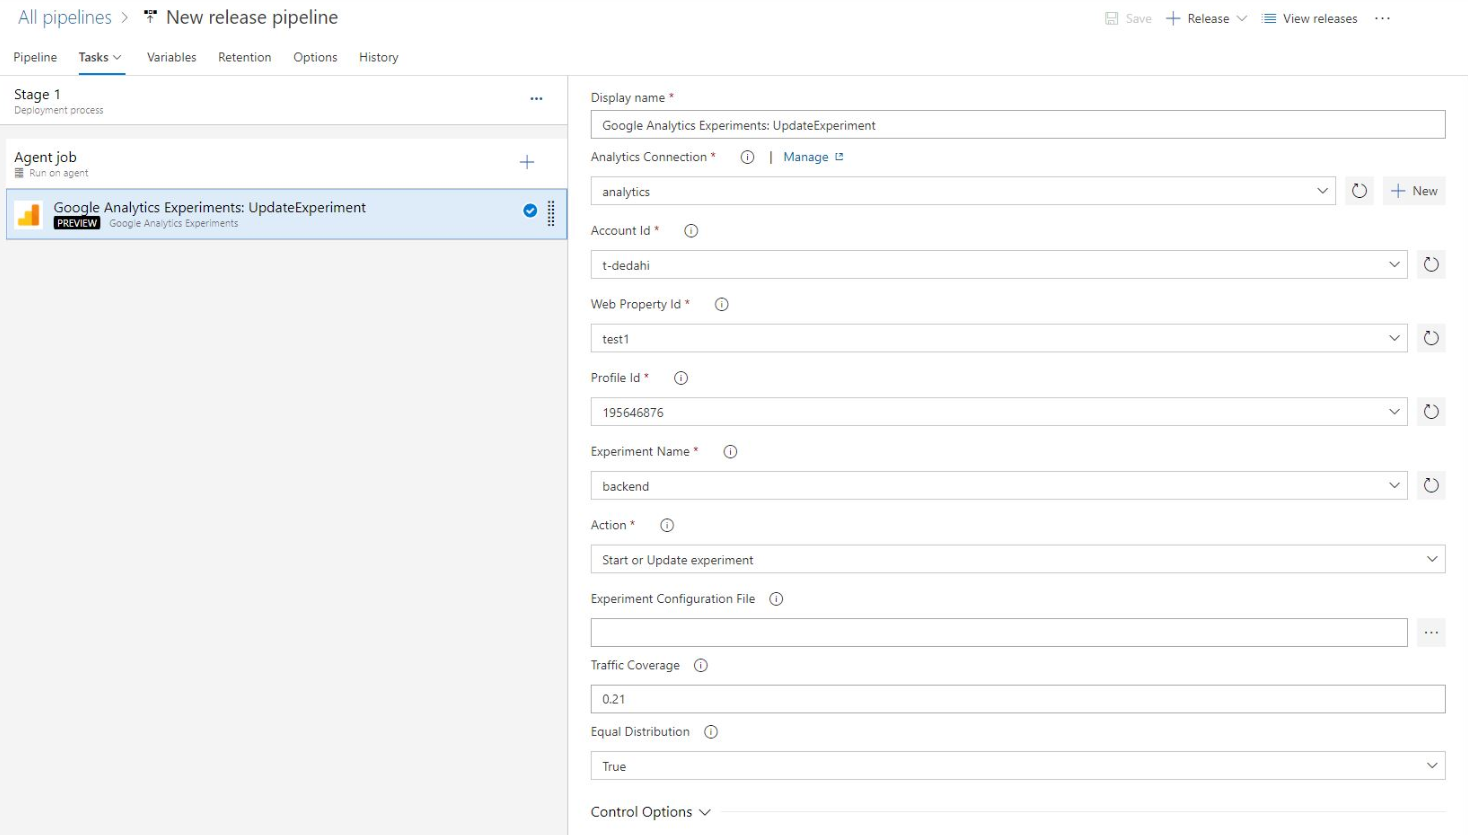
Integration with Google Analytics
The Google Analytics experiments framework lets you test almost any change or variation to a website or app to measure its impact on a specific objective. For example, you might have activities that you want your users to complete (e.g., make a purchase, sign up for a newsletter) and/or metrics that you want to improve (e.g., revenue, session duration, bounce rate). These activities let you identify changes worth implementing based on the direct impact they have on the performance of your feature.
The Google Analytics experiments extension for Azure DevOps adds experimentation steps to the build and release pipelines, so you can continuously iterate, learn and deploy at an accelerated pace by managing the experiments on a continuous basis while gaining all the DevOps benefits from Azure Pipelines.
You can download the Google Analytics experiments extension from the Marketplace.
Pipeline caching (public preview)
Pipeline caching lets you save the results of a long-running operation, like a package restore or a dependency compilation, and restore it back during the next run of a pipeline. This can result in faster builds.
For more details, see the blog post with the full announcement here.
Pipeline variable group and variable management commands
It can be challenging to port YAML based pipelines from one project to another as you need to manually set up the pipeline variables and variable groups. However, with the pipeline variable group and variable management commands, you can now script the set up and management of pipeline variables and variable groups which can in turn be version controlled, allowing you to easily share the instructions to move and set up pipelines from one project to another.
Run pipeline for a PR branch
When creating a PR, it can be challenging to validate if the changes might break the pipeline run on the target branch. However, with the capability to trigger a pipeline run or queue a build for a PR branch, you can now validate and visualize the changes going in by running it against the target pipeline. Refer az pipelines run and az pipelines build queue command documentation for more information.
Skip the first pipeline run
When creating pipelines, sometimes you want to create and commit a YAML file and not trigger the pipeline run as it may result in a faulty run due to a variety of reasons - infrastructure isn't ready or need to create and update variable/variable groups etc. With Azure DevOps CLI, you can now to skip the first automated pipeline run on creating a pipeline by including the --skip-first-run parameter. Refer az pipeline create command documentation for more information.
Service endpoint command enhancement
Service endpoint CLI commands supported only azure rm and github service endpoint set up and management. However, with this release, service endpoint commands allow you to create any service endpoint by providing the configuration via file and provides optimized commands - az devops service-endpoint github and az devops service-endpoint azurerm, which provide first class support to create service endpoints of these types. Refer the command documentation for more information.
Next steps
Note
These features will roll out over the next two to three weeks.
Head over to Azure DevOps and take a look.
How to provide feedback
We would love to hear what you think about these features. Use the feedback menu to report a problem or provide a suggestion.
You can also get advice and your questions answered by the community on Stack Overflow.
Thanks,
Sam Guckenheimer
Feedback
Coming soon: Throughout 2024 we will be phasing out GitHub Issues as the feedback mechanism for content and replacing it with a new feedback system. For more information see: https://aka.ms/ContentUserFeedback.
Submit and view feedback for