Five steps to develop actionable dashboards in Azure DevOps
Azure DevOps Services | Azure DevOps Server 2022 - Azure DevOps Server 2019
You want to provide your team and stakeholders the information they need to meet business objectives and keep projects moving forward. Well-crafted dashboards can help you achieve these goals. This article provides some examples of dashboards you can adapt to create your own.
To create a well-crafted dashboard, perform the following tasks:
- Choose a dashboard focus
- Choose the dashboard type and create your dashboard
- Add and configure your dashboard widgets
- Share the dashboard with your team and stakeholders
- Review and fine tune
- Choose a dashboard focus
- Create your dashboard
- Add and configure the widgets
- Share the dashboard with your team and stakeholders
- Review and fine tune
Choose a dashboard focus
When determining the focus of a dashboard, identify the information needs of its intended audience. You want your dashboards to provide insights and identity actions to take.
Your dashboard focus determines the type of dashboard you create, team or project, as indicated in the following table.
| Focus | Description | Dashboard type |
|---|---|---|
| Stakeholder | Use to share team and organizational goals, information, links to work item templates to create bugs or new feature requests, and more. | Team or Project |
| Personal | Helps each team member to focus on their backlog and current work. | Project or Team |
| Team | Provides information for a team to monitor status, track progress, identify bottlenecks, and ensure backlog items are well defined. | Team |
| Sprint | Useful for each team to review in daily stand-ups to ensure the team is on track to meet sprint goals and address any issues that impact those goals. | Team |
| Release | Use to monitor status and track progress toward a major release that may involve contributions from several teams. | Project |
| Test and deploy | Use to monitor continuous integration, builds, deployments, and releases. | Project or Team |
The following table lists several types of dashboards you may want to create.
| Focus | Description |
|---|---|
| Stakeholder | Used to share team and organizational goals, information, links to work item templates to create bugs or new feature requests, and more. |
| Personal | Helps each team member to focus on their backlog and current work. |
| Team | Provides information for a team to monitor status, track progress, identify bottlenecks, and ensure backlog items are well defined. |
| Sprint | Useful for each team to review in daily standups to ensure the team is on track to meet sprint goals and address any issues that impact those goals. |
| Release | Used to monitor status and track progress toward a major release which may involve contributions from several teams. |
| Test and deploy | Use to monitor continuous integration, builds, deployments, and releases. |
Choose the dashboard type and create your dashboard
When a team is created, a default dashboard named Overview is created which doesn't contain any widgets. This default dashboard is always a Team dashboard that you can edit and rename. When you add a dashboard, choose the type based on the following guidance.
- Project: Choose this type when you want to include information for more than one team or if the content isn't team-focused.
- Team: Choose this type when you plan to include team-specific widgets.
Review the Out Of Box widget catalog to determine which widgets are configurable for a single team or multiple teams.
To create the dashboard, see Add, rename, and delete dashboards. Streamline your process by copying another team's dashboard and updating it for your team. For details, see Copy a dashboard.
To create the dashboard, see Add, rename, and delete dashboards.
Create your dashboard
When a team is created, a default dashboard named Overview is created which doesn't contain any widgets. This default dashboard is always a Team dashboard which you can edit and rename. Review the Out Of Box widget catalog to determine which widgets are configurable for a single team or multiple teams.
To create the dashboard, see Add, rename, and delete dashboards.
Share the dashboard with your team and stakeholders
Once you've created your dashboard, share the URL with your team and stakeholders. Let them know what kind of actions you want them to take. Request their feedback to support your efforts to make it as actionable and insightful as you can.
To view or edit dashboards, the following conditions must be met.
- All project members have access to view all dashboards, unless specific restrictions have been placed on dashboards using a security command line tool. See Security namespace and permission reference, Object-level namespaces and permissions, Dashboards.
- All project members with Basic access can create a dashboard.
- All team members with Basic access can create a team dashboard unless permissions have been revoked for the team. For details, see [Set dashboard permissions, Set default team dashboard permissions](dashboard-permissions.md#set-default-team-dashboard permissions).
- All team members have permissions to edit all team dashboards, unless the Edit dashboard permission has been revoked for a specific dashboard or all team dashboards. For details, see Set dashboard permissions.
- Select dashboard charts and widgets contain data that is subject to their own permissions and access levels. To learn more, see FAQs on Azure DevOps dashboards, charts, and reports, Are their restrictions on what charts or data project members can view in a dashboard?
Review and fine tune
After you create your dashboard, you'll want to fine-tune it based on feedback you receive. Often, you find you need to update one or more queries used in your dashboard to refine the query results. Periodically review your dashboards to make sure it delivers the information you, your team, and stakeholders need.
Stakeholder dashboard
Stakeholders are any project members that have an interest in the work you're doing. You can use a combination of markdown widgets and other team-focused widgets to address the following information:
- Team goals
- Team information
- Team members and key contacts
- Links to work item templates
- Team guidance that you can link to wiki content
Personal dashboard
You can set up a personal focus dashboard for all team members to use using the Assigned to me widget and other query tile or query charts that reference an Assigned To = @Me query clause.
The following image shows a personal dashboard titled My Work Focus. Each team member can review this dashboard for work assigned to them, work they're following, or work where they're mentioned.

The following table provides more information for each widget shown in the dashboard. For details on constructing queries for each of these examples, see Example query charts.
| Title | Description | Widget type |
|---|---|---|
| Current Sprint | Work assigned to @Me for the current sprint. |
Query tile |
| Next Sprint | Work assigned to @Me for the current sprint. |
Query tile |
| Completed Last Sprint | Work completed last sprint assigned to @Me. |
Query tile |
| My Backlog | Work assigned to @Me new, proposed, or active. |
Query tile |
| I Created last 30 days | Active work with the following clauses: Created By = @Me and Created Date >= @Today-30. |
Query tile |
| I Recently Updated | Active work whose ID In @MyRecentActivity. |
Query tile |
| Work I'm Following | Active work whose ID In @MyFollows. |
Query tile |
| My Backlog by State | Stacked area chart showing work assigned to @Me by for the past four weeks. |
Query chart |
| My Work - Current Sprint by Work Item Type | Active work by type assigned to @Me for the current sprint. |
Query chart |
| My Backlog by Work Item Type | Work assigned to @Me by type. |
Query chart |
| New Work < 7 Days | Active work assigned to @Me and Created Date >= @Today-7. |
Query chart |
Tip
Remember that you can quickly navigate to the query and view a complete list of work items behind each query tile or widget by clicking the tile or widget.
Also, consider adding the following widgets to the personal focus dashboard:
- New Work Item: Supports creating new work items
- Work Links: Provides links to a team's Backlog, Board, current sprint Taskboard, and the queries page
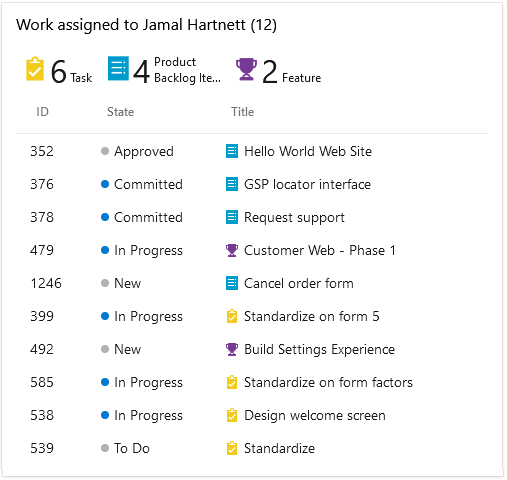
- Assigned to Me: Provides a list of work items assigned to the currently signed in user, as shown in the following image.
Team dashboard
What information is most important for your team? What goals, objectives, or guidance do you want all team members to follow?
Create your team dashboard to support your team members to meet team goals, monitor status, track progress, identify bottlenecks, and ensure backlog items are well defined. Consider including one or more of the following team-scoped widgets to a team dashboard. Velocity can help teams learn how well they're planning and executing on their sprint plans. Lead and cycle time can help teams learn the average time it takes for work to move from inception to completion.
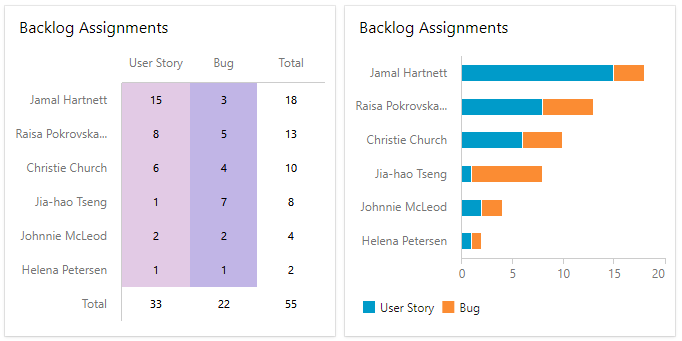
Consider adding a Chart for work item widget, Pivot table to quickly see the number of work items and their assignments as illustrated in the following images. Use these charts to determine if the team needs of better load balance the work.
If your team manages their code, tests, builds, and releases using Azure DevOps, then consider adding the following widgets to your team dashboard.
- Code tile
- Test results trend (Advanced)
- Pull request (Team)
- Build history
- Deployment status (Build pipeline)
Sprint dashboard
Azure DevOps provides several sprint and team-specific widgets to help track sprint progress. These widgets include Sprint overview, Sprint capacity, and Sprint burndown. Sprint capacity is only useful if your team tracks work using tasks and sets the Sprint capacity for the team as described in Determine and set sprint capacity.
The following image shows a sample of a sprint focus dashboard.
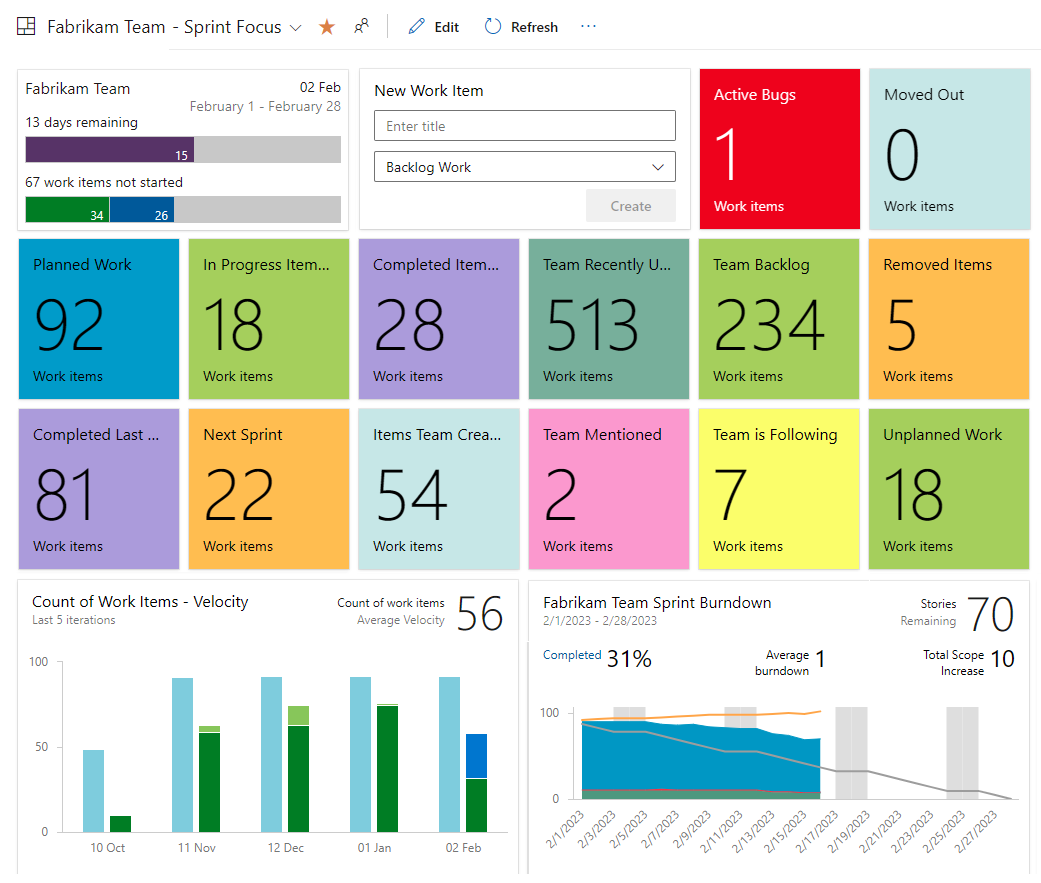
This sprint dashboard includes several query tiles and the following widgets:
- Sprint overview chart
- New work items
- Velocity (team-configurable)
- Sprint burndown chart (team-configurable)
Release dashboard
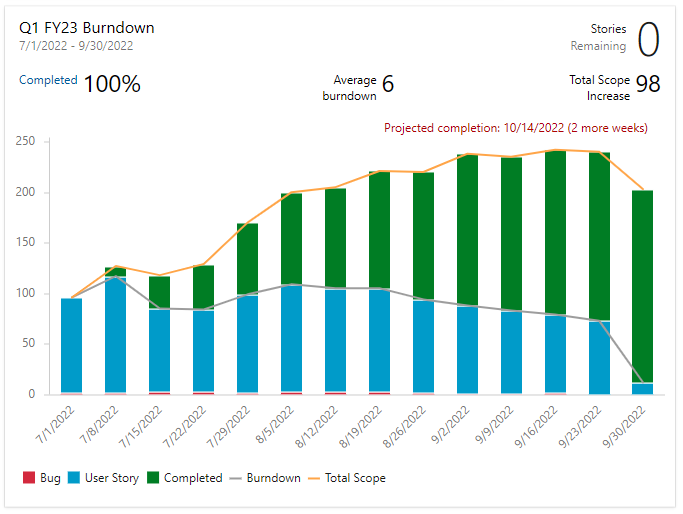
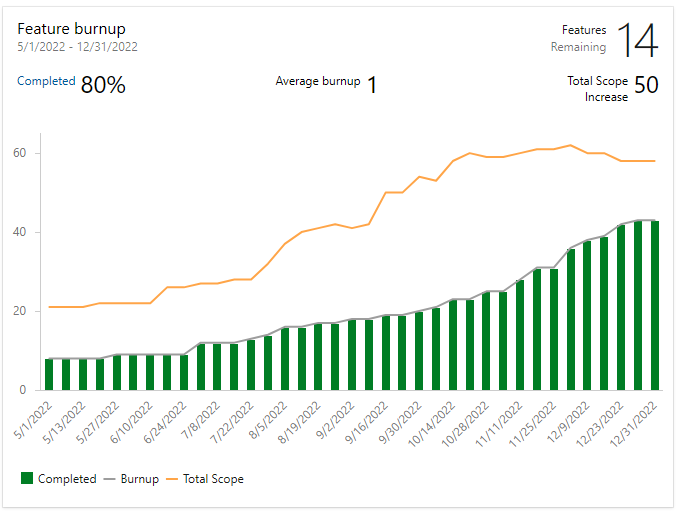
Major software releases often have contributions from one or more teams. Release burndown and burnup charts can help product managers keep track of how work is progressing across a number of teams. Burndown charts are highly configurable. You can choose one or more teams, backlog work items or work item types, field criteria, countdown metrics, and time interval. To learn more, see Configure a burndown or burnup widget.
Burndown chart
The following burndown chart shows the completion of planned work from July 1 through September 30, 2022.
Burnup chart
The following burnup chart shows the completion of work from May 1 through December 31, 2022.
Note
Analytics-based charts are built based on the WorkItemsSnapshot EntitySet. Snapshot entity types are modeled as daily snapshots. Data is aggregated based on assignments made as of the date they're assigned. What this means is that if you want to filter a Burndown/Burnup widget based on field or tag assignments, you must assign those prior to the period you want to monitor. Otherwise, they aren't registered by the widget until the date on which they're applied.
Test and deploy dashboard
Create a dedicated dashboard to review how tests, builds, and deployments are progressing by adding one or more of the following widgets.
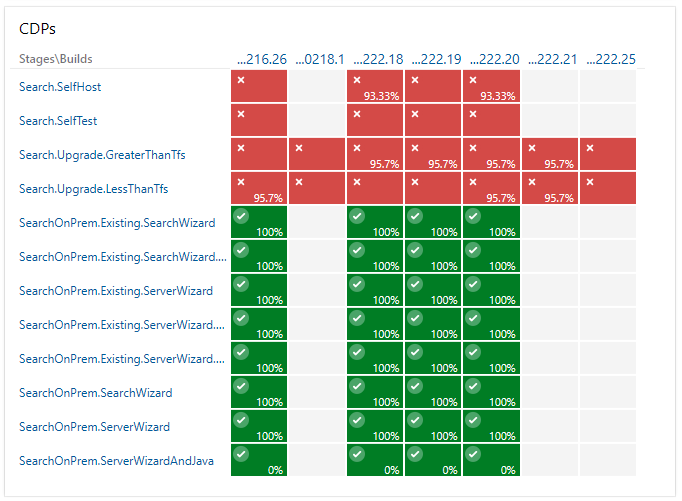
Build History
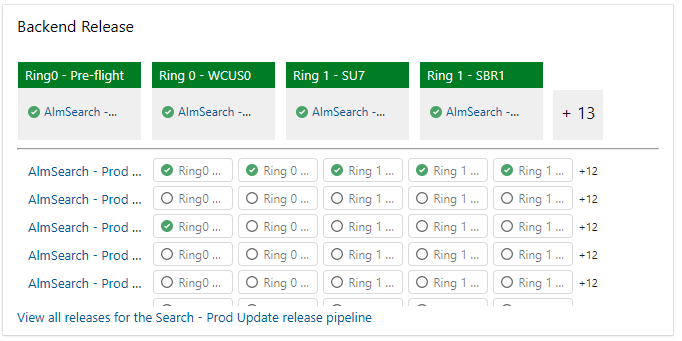
Release pipeline overview
Deployment status
Extend your dashboard visibility
You can add Kanban boards and dashboards as tabs to your Teams channel. Configure Azure DevOps Services tabs in Microsoft Teams
Related articles
Feedback
Coming soon: Throughout 2024 we will be phasing out GitHub Issues as the feedback mechanism for content and replacing it with a new feedback system. For more information see: https://aka.ms/ContentUserFeedback.
Submit and view feedback for