Events
Mar 17, 9 PM - Mar 21, 10 AM
Join the meetup series to build scalable AI solutions based on real-world use cases with fellow developers and experts.
Register nowThis browser is no longer supported.
Upgrade to Microsoft Edge to take advantage of the latest features, security updates, and technical support.
Azure DevOps Services | Azure DevOps Server 2022 - Azure DevOps Server 2019
Adding a last refresh date to a report helps users understand how current the data is. You can display the date and time of the last data update using a card in the report. Regularly refreshing the data models in Power BI ensures that all information is up-to-date.
The steps to add a last refresh date vary based on the source of your Power BI report, whether it's an Analytics view, Power BI, or an OData query.
Note
Several Analytics entity types, such as WorkItemRevision, WorkItem, WorkItemLink, TestRun, and others, include the AnalyticsUpdatedDate property. This property indicates the most recent time that the individual entity references were updated.
| Category | Requirements |
|---|---|
| Access levels | - Project member. - At least Basic access. |
| Permissions | By default, project members have permission to query Analytics and create views. For more information about other prerequisites regarding service and feature enablement and general data tracking activities, see Permissions and prerequisites to access Analytics. |
To add a column with the last refresh date of the dataset, do the following steps.
Load the Power BI .pbix file associated with your view in Power BI Desktop.
In the Queries section of the ribbon, select Transform data > Transform data.

Select Advanced Editor.

If you didn't modify the query, review the following examples with specific table values matching your Analytics view.
let
    Source = AzureDevOps.AnalyticsViews("{OrganizationName}", "{ProjectName}", []),
    #"Private Views_Folder" = Source{[Id="Private Views",Kind="Folder"]}[Data],
    #"{AnalyticsViewsID_Table}" = #"Private Views_Folder"{[Id="{AnalyticsViewsID}",Kind="Table"]}[Data],
    #"Added Refresh Date" = Table.AddColumn(#"{AnalyticsViewsID_Table}", "Refresh Date", each DateTimeZone.FixedUtcNow(), type datetimezone)
in
    #"Added Refresh Date"
Modify the query according to the following syntax.
let
    Source = AzureDevOps.AnalyticsViews("{OrganizationName}", "{ProjectName}", []),
    #"Private Views_Folder" = Source{[Id="Private Views",Kind="Folder"]}[Data],
    #"{AnalyticsViewsID_Table}" = #"Private Views_Folder"{[Id="{AnalyticsViewsID}",Kind="Table"]}[Data],
    #"Added Refresh Date" = Table.AddColumn(#"{AnalyticsViewsID_Table}", "Refresh Date", each DateTimeZone.FixedUtcNow(), type datetimezone)
in
    #"Added Refresh Date"
Note
These examples use UTC. You can adjust the query code based on your specific timezone as described in DateTimeZone functions.
Select Done.
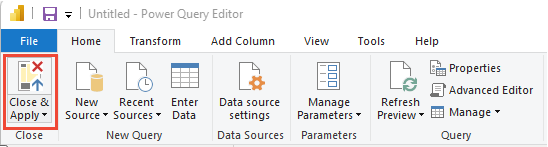
Select Close & Apply to immediately refresh the dataset.
From Power BI, select Get data > Blank Query.
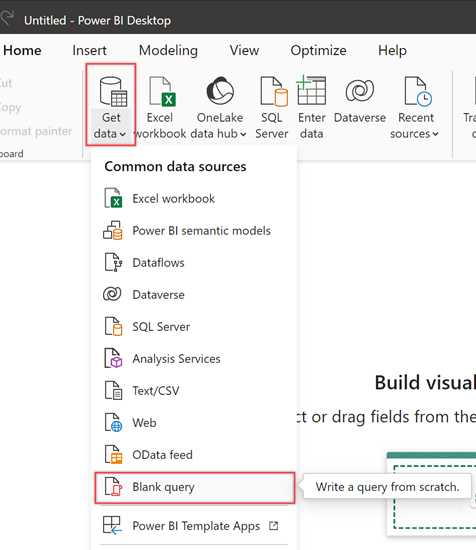
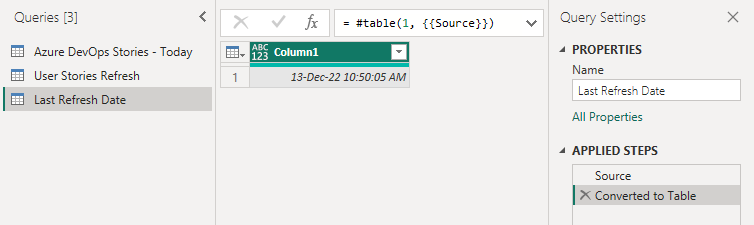
Rename the query to Last Refreshed Date, and then enter the following formula into the function bar.
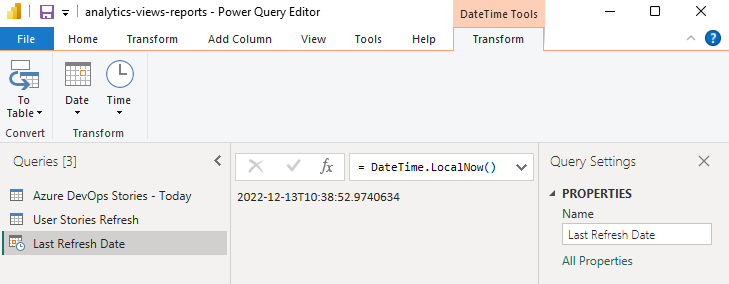
To convert the date data to a table format, choose To Table > To Table.
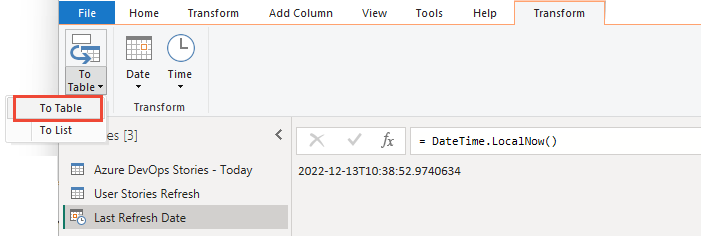
A single column appears with the date.
Tip
If you don't see the To Table option, you can use the following alternative steps to add the last refresh date and time to your reports:
let
Source = #table(
    {"Last Refresh Date"},
    {{DateTime.LocalNow()}}
)
in
Source
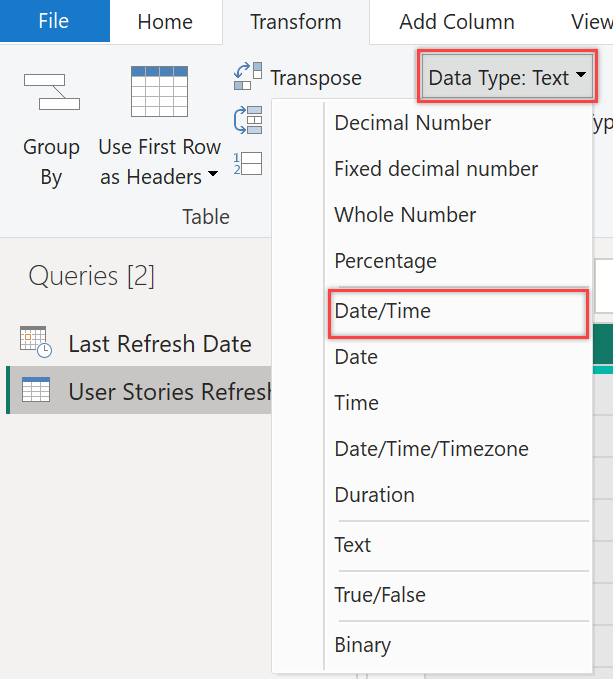
From the Transform menu, select the Data Type dropdown menu and select Date/Time option.
Rename Column1 to something more meaningful, such as Last Refresh Date.
From the Home menu, select Close and Apply.
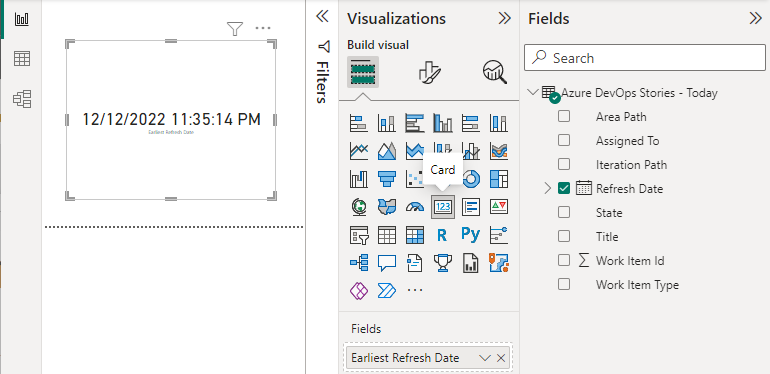
To add a card with the last refresh date to your reports, under Visualizations, choose Card, and add Refresh Date or Last Refresh Date to Fields.
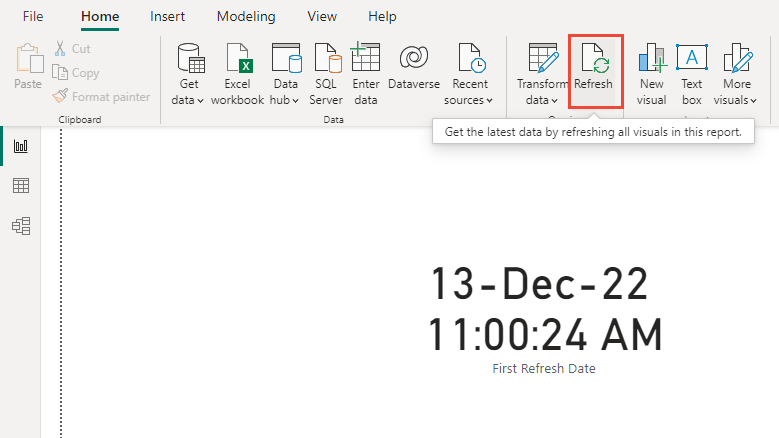
Choose Refresh to refresh report page data and the data model. After all queries are updated, the card refreshes with the latest date.
Events
Mar 17, 9 PM - Mar 21, 10 AM
Join the meetup series to build scalable AI solutions based on real-world use cases with fellow developers and experts.
Register nowTraining
Learning path
Use advance techniques in canvas apps to perform custom updates and optimization - Training
Use advance techniques in canvas apps to perform custom updates and optimization
Certification
Microsoft Certified: Power BI Data Analyst Associate - Certifications
Demonstrate methods and best practices that align with business and technical requirements for modeling, visualizing, and analyzing data with Microsoft Power BI.
Documentation
Add hyperlinks (URLs) to a table or matrix - Power BI
This topic teaches how to add hyperlinks (URLs) to a table. You use Power BI Desktop to add hyperlinks (URLs) to a semantic model. Then, in Power BI Desktop or the Power BI service, you can add those hyperlinks to your report tables and matrixes.
Show items with no data in Power BI - Power BI
Learn how Power BI behaves when determining relevant data, and how it handles and displays items with no data.
Use custom format strings in Power BI Desktop - Power BI
Learn how to use custom format strings in Power BI Desktop to customize how fields appear in visuals.