Bug trends sample report
Azure DevOps Services | Azure DevOps Server 2022 - Azure DevOps Server 2019
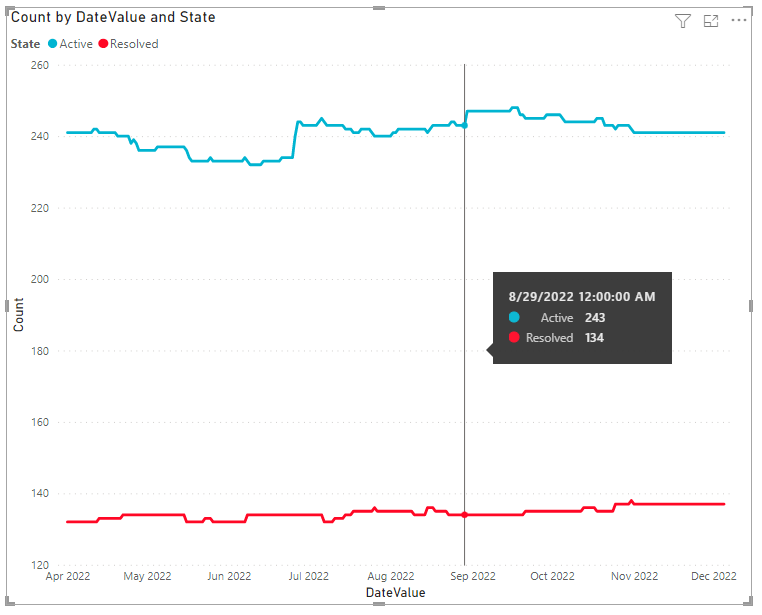
Bug trend reports are useful to see how well a team is closing active bugs. This article shows you how to display the number of bugs in a given state over a period of time. The following image shows an example of a bug trends report.
Note
This article assumes you've read Overview of Sample Reports using OData Queries and have a basic understanding of Power BI.
Prerequisites
- To view Analytics data and query the service, you need to be a member of a project with Basic access or greater. By default, all project members are granted permissions to query Analytics and define Analytics views.
- To learn about other prerequisites regarding service and feature enablement and general data tracking activities, see Permissions and prerequisites to access Analytics.
Sample queries
The following queries return data from the WorkItemSnapshot entity set to support generating trend reports.
Note
To determine available properties for filter or report purposes, see Metadata reference for Azure Boards. You can filter your queries or return properties using any of the Property values under an EntityType or NavigationPropertyBinding Path values available with an EntitySet. Each EntitySet corresponds to an EntityType. To learn more about the data type of each value, review the metadata provided for the corresponding EntityType.
Bug trend filtered by Area Path
The following queries filter bugs by area path and a start date.
You can paste the Power BI query listed below directly into the Get Data->Blank Query window. For more information, review Overview of sample reports using OData queries.
let
   Source = OData.Feed ("https://analytics.dev.azure.com/{organization}/{project}/_odata/v3.0-preview/WorkItemSnapshot? "
        &"$apply=filter( "
            &"WorkItemType eq 'Bug' "
            &"and State ne 'Closed' "
            &"and startswith(Area/AreaPath,'{areapath}') "
            &"and DateValue ge {startdate}  "
            &") "
        &"/groupby( "
            &"(DateValue,State,WorkItemType,Priority,Severity,Area/AreaPath,Iteration/IterationPath,AreaSK), "
            &"aggregate($count as Count) "
            &") "
    ,null, [Implementation="2.0",OmitValues = ODataOmitValues.Nulls,ODataVersion = 4])
in
    Source
Substitution strings and query breakdown
Substitute the following strings with your values. Don't include brackets {} with your substitution. For example if your organization name is "Fabrikam", replace {organization} with Fabrikam, not {Fabrikam}.
{organization}- Your organization name{project}- Your team project name, or omit "/{project}" entirely, for a cross-project query{areapath}- Your Area Path. Example format:Project\Level1\Level2{startdate}- Start your report for items completed on or after a given date with the format:YYYY-MM-DDZ. For example:2022-04-01Zrepresents 2022-April-01. Don't enclose in quotes.
Query breakdown
The following table describes each part of the query.
Query part
Description
$apply=filter(
Start of filter statement clause.
WorkItemType eq 'Bug'
Return Bugs.
and State ne 'Closed'
Omit bugs in a Closed state.
and startswith(Area/AreaPath,'{areapath}')
Return work items under a specific Area Path that you specify in'{areapath}'. To filter by team name, use the filter statement Teams/any(x:x/TeamName eq '{teamname})'.
and DateValue ge {startdate}
Start trend on or after the specified date. Example: 2021-04-01Z represents 2021-April-01.
)
Close filter() clause.
/groupby(
Start groupby() clause.
(DateValue, State, WorkItemType, Priority, Severity, Area/AreaPath, Iteration/IterationPath),
Group by DateValue, used for trending, and any other fields you want to report on.
aggregate($count as Count)
Aggregate by counting bugs that match the criteria on each date.
)
Close groupby() clause.
Bug trend filtered by Teams
You can query for bug trends by team name rather than Area Path.
You can paste the Power BI query listed below directly into the Get Data->Blank Query window. For more information, review Overview of sample reports using OData queries.
let
   Source = OData.Feed ("https://analytics.dev.azure.com/{organization}/{project}/_odata/v3.0-preview/WorkItemSnapshot? "
        &"$apply=filter( "
            &"WorkItemType eq 'Bug' "
            &"and State ne 'Closed' "
            &"and (Teams/any(x:x/TeamName eq '{teamname}') or Teams/any(x:x/TeamName eq '{teamname}') or Teams/any(x:x/TeamName eq '{teamname}')"
            &"and DateValue ge {startdate}  "
            &") "
        &"/groupby( "
            &"(DateValue,State,WorkItemType,Priority,Severity,Area/AreaPath,Iteration/IterationPath,AreaSK), "
            &"aggregate($count as Count) "
            &") "
    ,null, [Implementation="2.0",OmitValues = ODataOmitValues.Nulls,ODataVersion = 4])
in
    Source
Bug trend with a snapshot every Friday
Using a weekly snapshot reduces the amount of data pulled into Power BI, and increases query performance.
You can paste the Power BI query listed below directly into the Get Data->Blank Query window. For more information, review Overview of sample reports using OData queries.
let
   Source = OData.Feed ("https://analytics.dev.azure.com/{organization}/{project}/_odata/v3.0-preview/WorkItemSnapshot? "
        &"$apply=filter( "
            &"WorkItemType eq 'Bug' "
            &"and State ne 'Closed' "
            &"and startswith(Area/AreaPath,'{areapath}') "
            &"and DateValue ge {startdate} "
            &"and Date/DayName eq 'Friday'  "
        &") "
        &"/groupby( "
            &"(DateValue,State,WorkItemType,Priority,Severity,Area/AreaPath,Iteration/IterationPath,AreaSK), "
            &"aggregate($count as Count) "
        &") "
    ,null, [Implementation="2.0",OmitValues = ODataOmitValues.Nulls,ODataVersion = 4])
in
    Source
Bug trend with a snapshot on the first of every month
Using a monthly snapshot reduces the amount of data pulled into Power BI, and increases query performance.
You can paste the Power BI query listed below directly into the Get Data->Blank Query window. For more information, review Overview of sample reports using OData queries.
let
   Source = OData.Feed ("https://analytics.dev.azure.com/{organization}/{project}/_odata/v3.0-preview/WorkItemSnapshot? "
        &"$apply=filter( "
            &"WorkItemType eq 'Bug' "
            &"and State ne 'Closed' "
            &"and startswith(Area/AreaPath,'{areapath}') "
            &"and DateValue ge {startdate} "
            &"and Date/DayOfMonth eq 1  "
        &") "
        &"/groupby( "
            &"(DateValue,State,WorkItemType,Priority,Severity,Area/AreaPath,Iteration/IterationPath,AreaSK), "
            &"aggregate($count as Count) "
        &") "
    ,null, [Implementation="2.0",OmitValues = ODataOmitValues.Nulls,ODataVersion = 4])
in
    Source
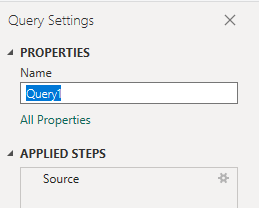
(Optional) Rename query
You can rename the default query label, Query1, to something more meaningful. Simply enter a new name from the Query Settings pane.
Expand columns in Power BI
Expand the Area/AreaPath and Iteration/IterationPath columns. Expanding the columns flattens the record into specific fields. To learn how, see Transform Analytics data to generate Power BI reports.
(Optional) Rename fields
Once you've expanded the columns, you may want to rename one or more fields. For example, you can rename the column AreaPath to Area Path. To learn how, see Rename column fields.
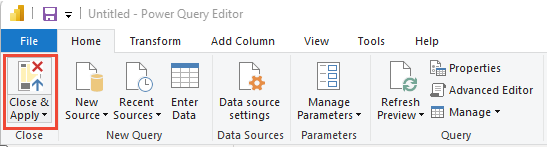
Close the query and apply your changes
Once you've completed all your data transformations, choose Close & Apply from the Home menu to save the query and return to the Report tab in Power BI.
Create the Line chart report
In Power BI, choose the Line chart report under Visualizations.
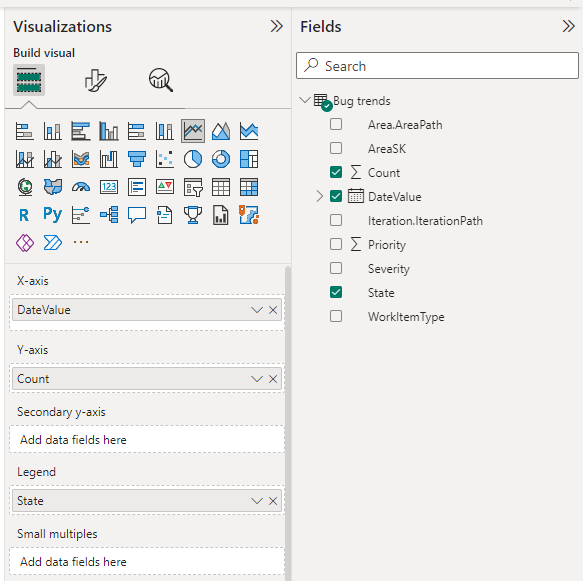
Add
DateValue" to X-axis, and right-clickDateValueand selectDateValuerather thanDate Hierarchy.Add
Countto Y-axis, and right-clickCountand ensure Sum is selected.Add
Stateto Legend.
The example report displays.
Modify report format visuals
To modify format elements of the report, choose the Format your visual (paintbrush) icon and modify one or more available settings. For example, you can modify the line colors used in the trend chart.
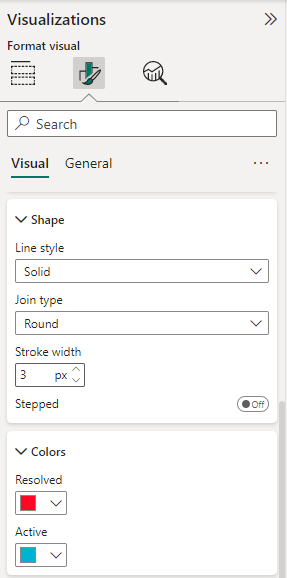
To learn more, see Get started with the formatting pane.
Related articles
Feedback
Coming soon: Throughout 2024 we will be phasing out GitHub Issues as the feedback mechanism for content and replacing it with a new feedback system. For more information see: https://aka.ms/ContentUserFeedback.
Submit and view feedback for