Events
Mar 17, 9 PM - Mar 21, 10 AM
Join the meetup series to build scalable AI solutions based on real-world use cases with fellow developers and experts.
Register nowThis browser is no longer supported.
Upgrade to Microsoft Edge to take advantage of the latest features, security updates, and technical support.
Azure DevOps Services | Azure DevOps Server 2022 - Azure DevOps Server 2019
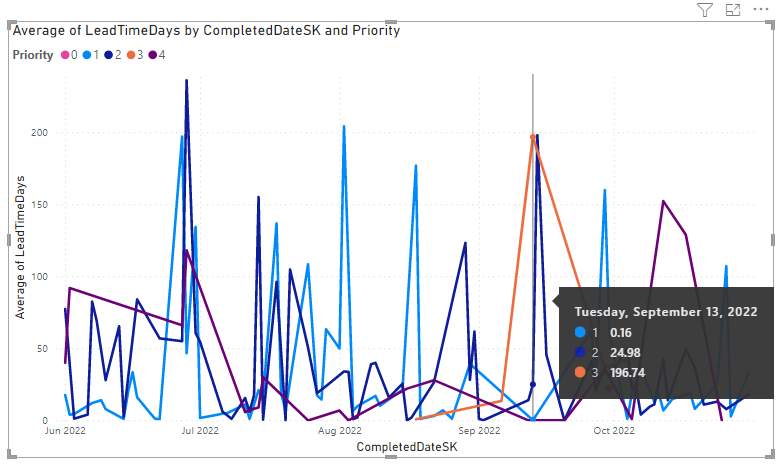
You can create lead time and cycle charts using the queries provided in this article. Lead time and cycle time indicate how long it takes for work to flow through a team's development pipeline. Lead time measures the total time elapsed from the creation of work items to their completion. Cycle time measures the time it takes for a team to complete work items once they begin actively working on them.
The following image shows an example for average lead time broken down by priority assignments made to the user stories.
For more information about lead and cycle time, see Lead Time and Cycle Time widgets and Cumulative flow, lead time, and cycle time guidance.
Note
This article assumes you read Overview of Sample Reports using OData Queries and have a basic understanding of Power BI.
| Category | Requirements |
|---|---|
| Access levels | - Project member. - At least Basic access. |
| Permissions | By default, project members have permission to query Analytics and create views. For more information about other prerequisites regarding service and feature enablement and general data tracking activities, see Permissions and prerequisites to access Analytics. |
Queries in this section support returning lead and cycle time data for completed User Stories. You can query by area path or team name(s). All of these queries specify the WorkItems entity set as they return data calculated for each work item by the Analytics service.
Note
To determine available properties for filter or report purposes, see Metadata reference for Azure Boards. You can filter your queries or return properties using any of the Property values under an EntityType or NavigationPropertyBinding Path values available with an EntitySet. Each EntitySet corresponds to an EntityType. For more information about the data type of each value, review the metadata provided for the corresponding EntityType.
Copy and paste the following Power BI query directly into the Get Data > Blank Query window. For more information, see Overview of sample reports using OData queries.
let
   Source = OData.Feed ("https://analytics.dev.azure.com/{organization}/{project}/_odata/v3.0-preview/WorkItems?"
        &"$filter=WorkItemType eq 'User Story' "
            &"and StateCategory eq 'Completed' "
            &"and CompletedDate ge {startdate} "
            &"and startswith(Area/AreaPath,'{areapath}') "
        &"&$select=WorkItemId,Title,WorkItemType,State,Priority,AreaSK "
            &",CycleTimeDays,LeadTimeDays,CompletedDateSK "
        &"&$expand=AssignedTo($select=UserName),Iteration($select=IterationPath),Area($select=AreaPath) "
    ,null, [Implementation="2.0",OmitValues = ODataOmitValues.Nulls,ODataVersion = 4])
in
    Source
Substitute the following strings with your values. Don't include brackets {} with your substitution. For example if your organization name is "Fabrikam", replace {organization} with Fabrikam, not {Fabrikam}.
{organization} - Your organization name{project} - Your team project name, or omit "/{project}" entirely, for a cross-project query{areapath} - Your Area Path. Example format: Project\Level1\Level2{startdate} - Start your report for items completed on or after a given date with the format: YYYY-MM-DDZ. For example: 2022-04-01Z represents 2022-April-01. Don't enclose in quotes.The following table describes each part of the query.
Query part
Description
$filter=WorkItemType eq 'User Story'
Return data for User Stories.
and StateCategory eq 'Completed'
Return only completed items. The system calculates values for Lead Time Days and Cycle Time Days only for work items that have completed.
Note
If you look at the raw data of records, you may see entries where CycleTimeDays=0. This occurs when the User Story or work item enters an In Progress workflow category state and Completed on the same day. For more information on workflow state categories, see How workflow states and state categories are used in Backlogs and Boards.
and CompletedDate ge {startdate}
Return items that are completed after the specified date. Example: 2022-04-01Z represents 2022-April-01
and startswith(Area/AreaPath,'{areapath}')
Return work items under a specific Area Path that you specify in'{areapath}'. To filter by team name, use the filter statement Teams/any(x:x/TeamName eq '{teamname})'.
&$select=WorkItemId, Title, WorkItemType, State, Priority
Select properties to return.
, CycleTimeDays, LeadTimeDays, CompletedDateSK
Return the properties that support Lead Time Days, Cycle Time Days and CompletedDateSK. CompletedDateSK returns a date value as an integer
&$expand=AssignedTo($select=UserName), Iteration($select=IterationPath), Area($select=AreaPath)
Expand the properties for AssignedTo, Iteration, and Area entities and select entity fields for them.
This query is the same as the one provided in the previous section, except it filters by several team names rather than area paths.
Copy and paste the following Power BI query directly into the Get Data > Blank Query window. For more information, see Overview of sample reports using OData queries.
let
   Source = OData.Feed ("https://analytics.dev.azure.com/{organization}/{project}/_odata/v3.0-preview/WorkItems?"
        &"$filter=WorkItemType eq 'User Story' "
            &"and StateCategory eq 'Completed' "
            &"and CompletedDate ge {startdate} "
            &"and (Teams/any(x:x/TeamName eq '{teamname}) or Teams/any(x:x/TeamName eq '{teamname}) or Teams/any(x:x/TeamName eq '{teamname}) "
        &"&$select=WorkItemId,Title,WorkItemType,State,Priority,AreaSK "
            &",CycleTimeDays,LeadTimeDays,CompletedDateSK "
        &"&$expand=AssignedTo($select=UserName),Iteration($select=IterationPath),Area($select=AreaPath) "
    ,null, [Implementation="2.0",OmitValues = ODataOmitValues.Nulls,ODataVersion = 4])
in
    Source
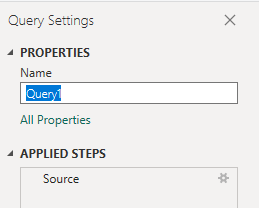
You can rename the default query label, Query1, to something more meaningful. Simply enter a new name from the Query Settings pane.
From the Power Query Editor, choose the query with the data you want to transform. For a Lead/Cycle time chart, you'll want to make the following transformations:
Area, Iteration, and AssignedTo.LeadTimeDays and CycleTimeDays columns to a Whole number.CompletedDateSK column from an integer to a date value.To learn how, see the following sections in Transform Analytics data to generate Power BI reports:
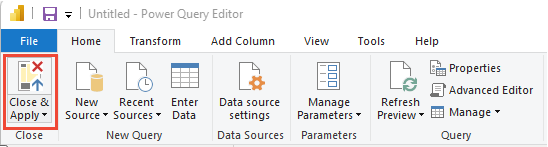
Once you've completed all your data transformations, choose Close & Apply from the Home menu to save the query and return to the Report tab in Power BI.
In the following example, the query was renamed to LeadCycleTime, but no columns were renamed.
In Power BI, choose the Line chart report under Visualizations.
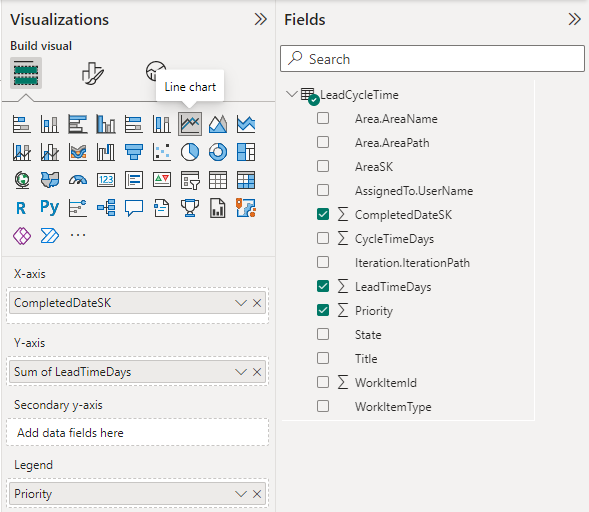
Add CompletedDateSK to the X-axis.
Add LeadTimeDays to the Y-axis, right-click and select Average.
Add Priority to Legend.
The example report displays. Note that as you hover over any area in the report, more data is shown.
Events
Mar 17, 9 PM - Mar 21, 10 AM
Join the meetup series to build scalable AI solutions based on real-world use cases with fellow developers and experts.
Register nowTraining
Learning path
Use advance techniques in canvas apps to perform custom updates and optimization - Training
Use advance techniques in canvas apps to perform custom updates and optimization
Certification
Microsoft Certified: Power BI Data Analyst Associate - Certifications
Demonstrate methods and best practices that align with business and technical requirements for modeling, visualizing, and analyzing data with Microsoft Power BI.
Documentation
Cumulative Flow Diagram (CFD) sample Power BI report - Azure DevOps
Learn how to generate a Cumulative Flow Diagram (CFD) Power BI report.
Sprint Burndown sample Power BI report - Azure DevOps
Learn how to generate a sprint burndown Power BI report.
Feature Progress rollup sample Power BI report - Azure DevOps
Learn how to generate feature progress rollup by Story Points Power BI report.