Events
Mar 17, 9 PM - Mar 21, 10 AM
Join the meetup series to build scalable AI solutions based on real-world use cases with fellow developers and experts.
Register nowThis browser is no longer supported.
Upgrade to Microsoft Edge to take advantage of the latest features, security updates, and technical support.
Azure DevOps Services | Azure DevOps Server 2022 | Azure DevOps Server 2020
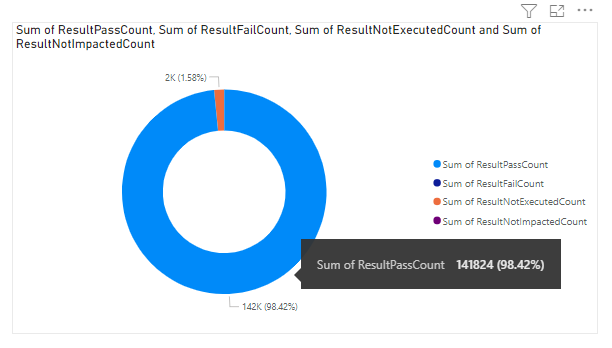
When you execute a pipeline run and include test tasks within the pipeline definition, you can create a report that indicates the number of test runs for different test outcomes: Passed, Failed, Not executed, Not impacted.
The following image shows an example of a test summary report.
Use the queries provided in this article to generate the following reports:
Important
Power BI integration and access to the OData feed of the Analytics Service are generally available for Azure DevOps Services and Azure DevOps Server 2020 and later versions. The sample queries provided in this article are valid only against Azure DevOps Server 2020 and later versions, and depend on v3.0-preview or later version. We encourage you to use these queries and provide us feedback.
| Category | Requirements |
|---|---|
| Access levels | - Project member. - At least Basic access. |
| Permissions | By default, project members have permission to query Analytics and create views. For more information about other prerequisites regarding service and feature enablement and general data tracking activities, see Permissions and prerequisites to access Analytics. |
Note
This article assumes you read Overview of Sample Reports using OData Queries and have a basic understanding of Power BI.
You can use the following queries of the TestResultsDaily entity set to create different but similar pipeline test summary reports. The TestResultsDaily entity set provides a daily snapshot aggregate of TestResult executions, grouped by Test.
Note
To determine available properties for filter or report purposes, see Metadata reference for Test Plans Analytics and Metadata reference for Azure Pipelines. You can filter your queries or return properties using any of the Property values under an EntityType or NavigationPropertyBinding Path values available with an EntitySet. Each EntitySet corresponds to an EntityType. For more information about the data type of each value, review the metadata provided for the corresponding EntityType.
Use the following queries to view the test summary of a pipeline for a Build workflow.
Copy and paste the following Power BI query directly into the Get Data > Blank Query window. For more information, see Overview of sample reports using OData queries.
let
   Source = OData.Feed (
      "https://analytics.dev.azure.com/mseng/AzureDevOps/_odata/v4.0-preview/TestResultsDaily?"
      &"$apply=filter("
      &"Pipeline/PipelineName eq '{pipelineName}' "
      &"And DateSK ge {startdate} "
      &"And Workflow eq 'Build' "
      &")/aggregate("
      &"ResultCount with sum as ResultCount, "
      &"ResultPassCount with sum as ResultPassCount, "
      &"ResultFailCount with sum as ResultFailCount, "
      &"ResultNotExecutedCount with sum as ResultNotExecutedCount, "
      &"ResultNotImpactedCount with sum as ResultNotImpactedCount"
      &")",
      null, [Implementation="2.0", OmitValues = ODataOmitValues.Nulls, ODataVersion = 4]
   )
in
    Source
Replace {pipelineName} and {startdate} with the actual values for your query.
Use the following queries to view the test summary of a pipeline for a Release workflow.
Note
To determine available properties for filter or report purposes, see Metadata reference for Test Plans Analytics. You can filter your queries or return properties using any of the Property values under an EntityType or NavigationPropertyBinding Path values available with an EntitySet. Each EntitySet corresponds to an EntityType. For more information about the data type of each value, review the metadata provided for the corresponding EntityType.
Copy and paste the following Power BI query directly into the Get Data > Blank Query window. For more information, see Overview of sample reports using OData queries.
let
   Source = OData.Feed (
      "https://analytics.dev.azure.com/mseng/AzureDevOps/_odata/v4.0-preview/TestResultsDaily?"
      &"$apply=filter("
      &"Pipeline/PipelineName eq '{pipelineName}' "
      &"And DateSK ge {startdate} "
      &"And Workflow eq 'Release'"
      &")/aggregate("
      &"ResultCount with sum as ResultCount, "
      &"ResultPassCount with sum as ResultPassCount, "
      &"ResultFailCount with sum as ResultFailCount, "
      &"ResultNotExecutedCount with sum as ResultNotExecutedCount, "
      &"ResultNotImpactedCount with sum as ResultNotImpactedCount"
      &")",
      null, [Implementation="2.0", OmitValues = ODataOmitValues.Nulls, ODataVersion = 4]
   )
in
    Source
To view the test summary of a pipeline for a particular branch, use the following queries. To create the report, carry out the following extra steps along with what is specified later in this article.
Branch into Branch.BranchNameBranch.BranchName to the slicer's FieldFor more information about using slicers, see Slicers in Power BI.
Copy and paste the following Power BI query directly into the Get Data > Blank Query window. For more information, see Overview of sample reports using OData queries.
let
   Source = OData.Feed (
      "https://analytics.dev.azure.com/mseng/AzureDevOps/_odata/v4.0-preview/TestResultsDaily?"
      &"$apply=filter("
      &"Pipeline/PipelineName eq '{pipelineName}' "
      &"And DateSK ge {startdate} "
      &"And Workflow eq 'Build'"
      &")/groupby("
      &"(Branch/BranchName),"
      &"aggregate("
      &"ResultCount with sum as ResultCount, "
      &"ResultPassCount with sum as ResultPassCount, "
      &"ResultFailCount with sum as ResultFailCount, "
      &"ResultNotExecutedCount with sum as ResultNotExecutedCount, "
      &"ResultNotImpactedCount with sum as ResultNotImpactedCount"
      &")",
      null, [Implementation="2.0", OmitValues = ODataOmitValues.Nulls, ODataVersion = 4]
   )
in
    Source
To view the test summary of a pipeline for a particular test file, use the following queries. To create the report, carry out the following extra steps along with what is defined later in this article.
Test into Test.ContainerNameTest.ContainerName to the slicer's FieldCopy and paste the following Power BI query directly into the Get Data > Blank Query window. For more information, see Overview of sample reports using OData queries.
let
   Source = OData.Feed (
      "https://analytics.dev.azure.com/mseng/AzureDevOps/_odata/v4.0-preview/TestResultsDaily?"
      &"$apply=filter("
      &"Pipeline/PipelineName eq '{pipelineName}' "
      &"And DateSK ge {startdate} "
      &"And Workflow eq 'Build'"
      &")/groupby("
      &"(Test/ContainerName),"
      &"aggregate("
      &"ResultCount with sum as ResultCount, "
      &"ResultPassCount with sum as ResultPassCount, "
      &"ResultFailCount with sum as ResultFailCount, "
      &"ResultNotExecutedCount with sum as ResultNotExecutedCount, "
      &"ResultNotImpactedCount with sum as ResultNotImpactedCount"
      &")",
      null, [Implementation="2.0", OmitValues = ODataOmitValues.Nulls, ODataVersion = 4]
   )
in
    Source
To view the test summary of a pipeline for tests owned by a particular test owner, use the following queries. To create the report, carry out the following extra steps along with what is defined later in this article.
Test into Test.TestOwnerTest.TestOwner to the slicer's FieldCopy and paste the following Power BI query directly into the Get Data > Blank Query window. For more information, see Overview of sample reports using OData queries.
let
   Source = OData.Feed (
      "https://analytics.dev.azure.com/mseng/AzureDevOps/_odata/v4.0-preview/TestResultsDaily?"
      &"$apply=filter("
      &"Pipeline/PipelineName eq '{pipelineName}' "
      &"And DateSK ge {startdate} "
      &"And Workflow eq 'Build'"
      &")/groupby("
      &"(Test/TestOwner),"
      &"aggregate("
      &"ResultCount with sum as ResultCount, "
      &"ResultPassCount with sum as ResultPassCount, "
      &"ResultFailCount with sum as ResultFailCount, "
      &"ResultNotExecutedCount with sum as ResultNotExecutedCount, "
      &"ResultNotImpactedCount with sum as ResultNotImpactedCount"
      &")",
      null, [Implementation="2.0", OmitValues = ODataOmitValues.Nulls, ODataVersion = 4]
   )
in
    Source
Substitute the following strings with your values. Don't include brackets {} with your substitution. For example if your organization name is "Fabrikam", replace {organization} with Fabrikam, not {Fabrikam}.
{organization} - Your organization name.{project} - Your team project name.{pipelinename} - Your pipeline name. Example: Fabrikam hourly build pipeline.{startdate} - The date to start your report. You can enter the dates in YYYYMMDD format. For example, 20220815 for 15 August 2022.The following table describes each part of the query.
Query part
Description
$apply=filter(
Start filter() clause.
Pipeline/PipelineName eq '{pipelineName}'
Return test runs for the specified pipeline.
and CompletedOn/Date ge {startdate}
Return test runs on or after the specified date.
and Workflow eq 'Build' or and Workflow eq 'Release'
Return test runs only for pipelines designated with the Build or Release workflow.
)
Close filter() clause.
aggregate(
Start the aggregate clause for all the test runs matching the filter criteria.
ResultCount with sum as ResultCount,
Count the total number of test runs as ResultCount.
ResultPassCount with sum as ResultPassCount,
Count the total number of passed test runs as ResultPassCount.
ResultFailCount with sum as ResultFailCount
Count the total number of failed test runs as ResultFailCount.
ResultNotExecutedCount with sum as ResultNotExecutedCount,
Count the total number of not executed test runs as ResultNotExecutedCount.
ResultNotImpactedCount with sum as ResultNotImpactedCount
Count the total number of not affected test runs as ResultNotImpactedCount.
)
Close the aggregate() clause.
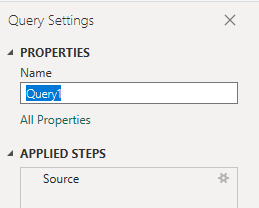
You can rename the default query label, Query1, to something more meaningful. Simply enter a new name from the Query Settings pane.
You can rename column fields. For example, you can rename the column Pipeline.PipelineName to Pipeline Name, or TotalCount to Total Count. To learn how, see Rename column fields.
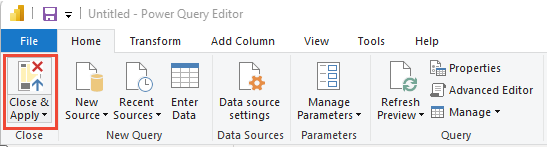
Once you've completed all your data transformations, choose Close & Apply from the Home menu to save the query and return to the Report tab in Power BI.
In Power BI, under Visualizations, choose the Donut report.
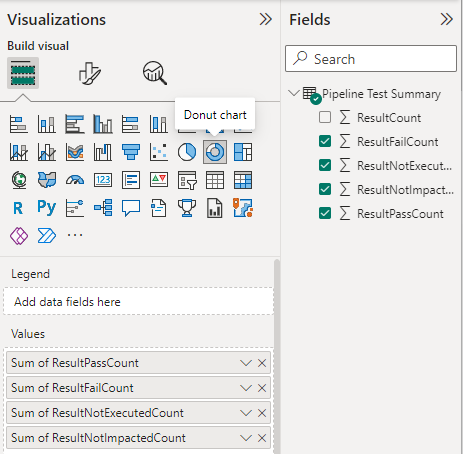
Add the following fields to Values, in the order indicated. Right-click each field and ensure Sum is selected.
ResultPassCountResultFailCountResultNotExecutedCountResultNotImpactedCountYour report should look similar to the following image.
Events
Mar 17, 9 PM - Mar 21, 10 AM
Join the meetup series to build scalable AI solutions based on real-world use cases with fellow developers and experts.
Register nowTraining
Learning path
Use advance techniques in canvas apps to perform custom updates and optimization - Training
Use advance techniques in canvas apps to perform custom updates and optimization
Certification
Microsoft Certified: Power BI Data Analyst Associate - Certifications
Demonstrate methods and best practices that align with business and technical requirements for modeling, visualizing, and analyzing data with Microsoft Power BI.
Documentation
Pipeline failed test sample Power BI reports - Azure DevOps
Learn how to list failed tests in a Power BI report for a given pipeline in the project.
Manual test progress status sample Power BI report - Azure DevOps
Learn about sample Power BI queries that generate an overall execution state or progress status of manual tests.
Use OData queries to generate Power BI reports - Azure DevOps
Learn how to use OData queries to create several sample Power BI reports.