Transform data inside your IoT Central application for export
IoT devices send data in various formats. To use the device data in your IoT solution, you may need to transform your device data before it's exported to other services.
This article shows you how to transform device data as part of a data export definition in an IoT Central application.
Transformations in an IoT Central data export definition let you manipulate the format and structure of the device data before it's exported to a destination. You can specify a transformation for each destination in an export definition. Each message passes through the transformation to create an output record that's exported to the destination.
Use transformations to restructure JSON payloads, rename fields, filter out fields, and run simple calculations on telemetry values. For example, use a transformation to convert your messages into a tabular format that matches the schema of a destination such as an Azure Data Explorer table.
The following video introduces you to IoT Central data transformations:
Add a transformation
To add a transformation for a destination in your data export, select + Transform as shown in the following screenshot:

The Data Transformation panel lets you specify the transformation. In the 1. Add your input message section, you can enter a sample message that you want to pass through the transformation. You can also generate a sample message by selecting a device template. In the 2. Build transformation query section, you can enter the query that transforms the input message. The 3. Preview output messages(s) section shows the result of the transformation:

Tip
If you don't know the format of your input message, use . as the query to export the message as is to a destination such as a Webhook. Then paste the message received by the webhook into 1. Add your input message. Then build a transform query to process this message into your required output format.
Build a transformation query
The transform engine uses the open-source JQ JSON processor to restructure and format JSON payloads. To specify a transformation, you write a JQ query, which can use the built-in filters, functions, and features of JQ. For some query examples, see Example transformation queries. To learn more about writing JQ queries, see the JQ manual.
Pre-transformation message structure
You can export the following streams of data from IoT Central: telemetry, property changes, device connectivity events, device lifecycle events, and device template lifecycle events. Each type of data has a specific structure that includes information such as telemetry values, application info, device metadata, and property values.
The following example shows the shape of telemetry message. All this data is available to your transformation. The structure of the message is similar for other message types but there are some type-specific fields. You can use the Add your input message feature to generate a sample message based on a device template in your application.
{
  "applicationId": "93d68c98-9a22-4b28-94d1-06625d4c3d0f",
  "device": {
    "id": "31edabe6-e0b9-4c83-b0df-d12e95745b9f",
    "name": "Scripted Device - 31edabe6-e0b9-4c83-b0df-d12e95745b9f",
    "cloudProperties": [],
    "properties": {
      "reported": [
        {
          "id": "urn:smartKneeBrace:Smart_Vitals_Patch_wr:FirmwareVersion:1",
          "name": "FirmwareVersion",
          "value": 1.0
        }
      ]
    },
    "templateId": "urn:sbq3croo:modelDefinition:nf7st1wn3",
    "templateName": "Smart Knee Brace"
  },
  "telemetry": [
      {
        "id": "urn:continuousPatientMonitoringTemplate:Smart_Knee_Brace_6wm:Acceleration:1",
        "name": "Acceleration",
        "value": {
          "x": 19.212770659918583,
          "y": 20.596296675217335,
          "z": 54.04859440697045
        }
      },
      {
        "id": "urn:continuousPatientMonitoringTemplate:Smart_Knee_Brace_6wm:RangeOfMotion:1",
        "name": "RangeOfMotion",
        "value": 110
      }
  ],
  "enqueuedTime": "2021-03-23T19:55:56.971Z",
  "enrichments": {
      "your-enrichment-key": "enrichment-value"
  },
  "messageProperties": {
      "prop1": "prop-value"
  },
  "messageSource": "telemetry"
}
Tip
Use the Add your input message feature in the IoT Central application UI to see sample message structures for other data export types, such as property changes.
Example transformation queries
The following query examples use the telemetry message shown in the previous section.
Example 1: The following JQ query outputs each piece of telemetry from the input message as a separate output message:
.telemetry[]
JSON output:
{
  "id": "urn:continuousPatientMonitoringTemplate:Smart_Knee_Brace_6wm:Acceleration:1",
  "name": "Acceleration",
  "value": {
    "x": 19.212770659918583,
    "y": 20.596296675217335,
    "z": 54.04859440697045
  }
},
{
  "id": "urn:continuousPatientMonitoringTemplate:Smart_Knee_Brace_6wm:RangeOfMotion:1",
  "name": "RangeOfMotion",
  "value": 110
}
Tip
To change the output to a single message with an array of telemetry types, use the query .telemetry.
Example 2: The following JQ query converts the input telemetry array into an object with telemetry names as the keys:
.telemetry | map({ key: .name, value: .value }) | from_entries
JSON output:
{
  "Acceleration": {
    "x": 19.212770659918583,
    "y": 20.596296675217335,
    "z": 54.04859440697045
  },
  "RangeOfMotion": 110
}
Example 3: The following JQ query finds the RangeOfMotion telemetry value and converts it from degrees to radians using the formula rad = degree * pi / 180. This query also shows how to import and use the iotc module:
import "iotc" as iotc;
{
  rangeOfMotion: (
    .telemetry
    | iotc::find(.name == "RangeOfMotion").value
    | . * 3.14159265358979323846 / 180
  )
}
JSON output:
{
  "rangeOfMotion": 1.9198621771937625
}
Example 4: To manipulate the input message into a tabular format, you can map each exported message into one or more rows. Row output is logically represented as a JSON object where the column name is the key and the column value is the value:
{
    "<column 1 name>": "<column 1 value>",
    "<column 2 name>": "<column 2 value>",
    ...
}
Tip
Use a tabular format when you export to Azure Data Explorer.
The following JQ query writes rows to a table that stores rangeOfMotion telemetry across different devices. The query maps device ID, enqueued time, and range of motion into a table with these columns:
import "iotc" as iotc;
{
    deviceId: .deviceId,
    timestamp: .enqueuedTime,
    rangeOfMotion: .telemetry | iotc::find(.name == "RangeOfMotion").value
}
Output in JSON format:
{
  "deviceId": "31edabe6-e0b9-4c83-b0df-d12e95745b9f",
  "timestamp": "2021-03-23T19:55:56.971Z",
  "rangeOfMotion": 110
}
IoT Central module
A JQ module is a collection of custom functions. As part of your transformation query, you can import a built-in IoT Central specific module that contains functions to make it easier for you to write your queries. To import the IoT Central module, use the following directive:
import "iotc" as iotc;
The IoT Central module includes the following functions:
find(expression): The find function lets you find a specific array element such as telemetry value or property entry in your payload. The function input is an array and the parameter defines a JQ filter to run against each element in the array. The function returns each array element where the filter evaluates to true:
For example, to find a specific telemetry value called RangeOfMotion:
.telemetry | iotc::find(.name == "RangeOfMotion")
Scenarios
The following scenarios use the transform functionality to customize the device data format for a specific destination.
Scenario 1: Export device data to Azure Data Explorer
In this scenario, you transform device data to match the fixed schema in Azure Data Explorer, where each telemetry value appears as a column in the table and each row represents a single message. For example:
| DeviceId | Timestamp | T1 | T2 | T3 |
|---|---|---|---|---|
| "31edabe6-e0b9-4c83-b0df-d12e95745b9f" | "2021-03-23T19:55:56.971Z | 1.18898 | 1.434709 | 2.97008 |
To export data that's compatible with this table, each exported message must look like the following object. The object represents a single row, where the keys are column names and the values are the value to place in each column:
{
    "Timestamp": <value-of-Timestamp>,
    "DeviceId": <value-of-deviceId>,
    "T1": <value-of-T1>,
    "T2": <value-of-T2>,
    "T3": <value-of-T3>,
}
In this scenario, the device sends the t1, t2, and t3 telemetry values in an input message that looks like the following example:
{
  "applicationId": "c57fe8d9-d15d-4659-9814-d3cc38ca9e1b",
  "enqueuedTime": "1933-01-26T03:10:44.480001324Z",
  "messageSource": "telemetry",
  "telemetry": [
    {
      "id": "dtmi:temperaturesensor288:sensors1lr:t1;1",
      "name": "t1",
      "value": 1.1889838348731093e+308
    },
    {
      "id": "dtmi:temperaturesensor288:sensors1lr:t2;1",
      "name": "t2",
      "value": 1.4347093391531383e+308
    },
    {
      "id": "dtmi:temperaturesensor288:sensors1lr:t3;1",
      "name": "t3",
      "value": 2.9700885230380616e+307
    }
  ],
  "device": {
    "id": "oozrnl1zs857",
    "name": "haptic alarm",
    "templateId": "dtmi:modelDefinition:nhhbjotee:qytxnp8hi",
    "templateName": "hapticsensors",
    "properties": {
      "reported": []
    },
    "cloudProperties": [],
    "simulated": true,
    "approved": false,
    "blocked": false,
    "provisioned": true
  }
}
The following JQ query outputs the T1, T2 and T3 telemetry values, the Timestamp and the deviceId as a message with key-value pairs matching the Azure Data Explorer table schema:
import "iotc" as iotc;
{
  deviceId: .device.id,
  Timestamp: .enqueuedTime,
  T1: .telemetry | iotc::find(.name == "t1").value,
  T2: .telemetry | iotc::find(.name == "t2").value,
  T3: .telemetry | iotc::find(.name == "t3").value,
}
JSON output:
{
  "T1": 1.1889838348731093e+308,
  "T2": 1.4347093391531383e+308,
  "T3": 2.9700885230380616e+307,
  "Timestamp": "1933-01-26T03:10:44.480001324Z",
  "deviceId": "oozrnl1zs857"
}
To learn more about how to add an Azure Data Explorer cluster and database as an export destination, see Create an Azure Data Explorer destination.
Scenario 2: Breaking apart a telemetry array
In this scenario, the device sends the following array of telemetry in one message:
{
  "applicationId": "570c2d7b-d72e-4ad1-aaf4-ad9b727daa47",
  "enqueuedTime": "1909-10-10T07:11:56.078161042Z",
  "messageSource": "telemetry",
  "telemetry": [
    {
      "id": "dtmi:sample1:data;1",
      "name": "data",
      "value": [
        {
          "id": "subdevice1",
          "values": {
              "running": true,
              "cycleCount": 2315
          }
        },
        {
          "id": "subdevice2",
          "values": {
              "running": false,
              "cycleCount": 824567
          }
        }
      ]
    },
    {
      "id": "dtmi:sample1:parentStatus;1",
      "name": "parentStatus",
      "value": "healthy"
    }
  ],
  "device": {
    "id": "9xwhr7khkfri",
    "name": "wireless port",
    "templateId": "dtmi:hpzy1kfcbt2:umua7dplmbd",
    "templateName": "Smart Vitals Patch",
    "properties": {
      "reported": [
        {
          "id": "dtmi:sample1:prop;1",
          "name": "Connectivity",
          "value": "Tenetur ut quasi minus ratione voluptatem."
        }
      ]
    },
    "cloudProperties": [],
    "simulated": true,
    "approved": true,
    "blocked": false,
    "provisioned": false
  }
}
You want to transform this device data to match the following table schema:
| cycleCount | deviceId | enqueuedTime | parentStatus | running | subdeviceId |
|---|---|---|---|---|---|
| 2315 | "9xwhr7khkfri" | "1909-10-10T07:11:56.078161042Z" | "healthy" | true | "subdevice1" |
| 824567 | "9xwhr7khkfri" | "1909-10-10T07:11:56.078161042Z" | "healthy" | false | "subdevice2" |
The following JQ query creates a separate output message for each subdevice entry in the message, and includes some common information from the base message and parent device. This query flattens the output and separates out logical divisions in your data that arrived as a single message:
import "iotc" as iotc;
{
    enqueuedTime: .enqueuedTime,
    deviceId: .device.id,
    parentStatus: .telemetry | iotc::find(.name == "parentStatus").value
} + (
    .telemetry
    | iotc::find(.name == "data").value[]
    | {
        subdeviceId: .id,
        running: .values.running,
        cycleCount: .values.cycleCount
    }
)
JSON output:
{
    "cycleCount": 2315,
    "deviceId": "9xwhr7khkfri",
    "enqueuedTime": "1909-10-10T07:11:56.078161042Z",
    "parentStatus": "healthy",
    "running": true,
    "subdeviceId": "subdevice1"
},
{
    "cycleCount": 824567,
    "deviceId": "9xwhr7khkfri",
    "enqueuedTime": "1909-10-10T07:11:56.078161042Z",
    "parentStatus": "healthy",
    "running": false,
    "subdeviceId": "subdevice2"
}
Scenario 3: Power BI streaming
The Power BI real-time streaming feature lets you view data in a dashboard that's updated in real time with low latency. To learn more, see Real-time streaming in Power BI.
To use IoT Central with Power BI Streaming, set up a webhook export that sends request bodies in a specific format. This example assumes you have a Power BI Streaming dataset with the following schema:
  {
    "bloodPressureDiastolic": 161438124,
    "bloodPressureSystolic": -966387879,
    "deviceId": "9xwhr7khkfri",
    "deviceName": "wireless port",
    "heartRate": -633994413,
    "heartRateVariability": -37514094,
    "respiratoryRate": 1582211310,
    "timestamp": "1909-10-10T07:11:56.078161042Z"
  }
To create the webhook export destination, you need the REST API URL endpoint for your Power BI streaming dataset.
In this scenario, the device sends telemetry messages that look like the following example:
{
  "applicationId": "570c2d7b-d72e-4ad1-aaf4-ad9b727daa47",
  "enqueuedTime": "1909-10-10T07:11:56.078161042Z",
  "messageSource": "telemetry",
  "telemetry": [
    {
      "id": "dtmi:smartVitalsPatch:Smart_Vitals_Patch_37p:HeartRate;1",
      "name": "HeartRate",
      "value": -633994413
    },
    {
      "id": "dtmi:smartVitalsPatch:Smart_Vitals_Patch_37p:RespiratoryRate;1",
      "name": "RespiratoryRate",
      "value": 1582211310
    },
    {
      "id": "dtmi:smartVitalsPatch:Smart_Vitals_Patch_37p:HeartRateVariability;1",
      "name": "HeartRateVariability",
      "value": -37514094
    },
    {
      "id": "dtmi:smartVitalsPatch:Smart_Vitals_Patch_37p:BodyTemperature;1",
      "name": "BodyTemperature",
      "value": 5.323322666478241e+307
    },
    {
      "id": "dtmi:smartVitalsPatch:Smart_Vitals_Patch_37p:FallDetection;1",
      "name": "FallDetection",
      "value": "Earum est nobis at voluptas id qui."
    },
    {
      "id": "dtmi:smartVitalsPatch:Smart_Vitals_Patch_37p:BloodPressure;1",
      "name": "BloodPressure",
      "value": {
        "Diastolic": 161438124,
        "Systolic": -966387879
      }
    }
  ],
  "device": {
    "id": "9xwhr7khkfri",
    "name": "wireless port",
    "templateId": "dtmi:hpzy1kfcbt2:umua7dplmbd",
    "templateName": "Smart Vitals Patch",
    "properties": {
      "reported": [
        {
          "id": "dtmi:smartVitalsPatch:Smart_Vitals_Patch_wr:DeviceStatus;1",
          "name": "DeviceStatus",
          "value": "Id optio iste vero et neque sit."
        }
      ]
    },
    "cloudProperties": [],
    "simulated": true,
    "approved": true,
    "blocked": false,
    "provisioned": false
  }
}
The following JQ query transforms the input message to a format suitable for the webhook to send to the Power BI streaming dataset. This example includes a filter condition to only output messages for a specific device template. You could use the data export filter feature to filter by device template:
import "iotc" as iotc;
if .device.templateId == "dtmi:hpzy1kfcbt2:umua7dplmbd" then
    {
        deviceId: .device.id,
        timestamp: .enqueuedTime,
        deviceName: .device.name,
        bloodPressureSystolic: .telemetry | iotc::find(.name == "BloodPressure").value.Systolic,
        bloodPressureDiastolic: .telemetry | iotc::find(.name == "BloodPressure").value.Diastolic,
        heartRate: .telemetry | iotc::find(.name == "HeartRate").value,
        heartRateVariability: .telemetry | iotc::find(.name == "HeartRateVariability").value,
        respiratoryRate: .telemetry | iotc::find(.name == "RespiratoryRate").value
    }
else
    empty
end
JSON output:
{
  "bloodPressureDiastolic": 161438124,
  "bloodPressureSystolic": -966387879,
  "deviceId": "9xwhr7khkfri",
  "deviceName": "wireless port",
  "heartRate": -633994413,
  "heartRateVariability": -37514094,
  "respiratoryRate": 1582211310,
  "timestamp": "1909-10-10T07:11:56.078161042Z"
}
Scenario 4: Export data to Azure Data Explorer and visualize it in Power BI
In this scenario, you export data to Azure Data Explorer and then a use a connector to visualize the data in Power BI. To learn more about how to add an Azure Data Explorer cluster and database as an export destination, see Create an Azure Data Explorer destination.
This scenario uses an Azure Data Explorer table with the following schema:
.create table smartvitalspatch (
  EnqueuedTime:datetime,
  Message:string,
  Application:string,
  Device:string,
  Simulated:boolean,
  Template:string,
  Module:string,
  Component:string,
  Capability:string,
  Value:dynamic
)
In this scenario, the device sends telemetry messages that look like the following example:
{
    "applicationId": "570c2d7b-d72e-4ad1-aaf4-ad9b727daa47",
    "enqueuedTime": "1909-10-10T07:11:56.078161042Z",
    "messageSource": "telemetry",
    "telemetry": [
        {
            "id": "dtmi:smartVitalsPatch:Smart_Vitals_Patch_37p:HeartRate;1",
            "name": "HeartRate",
            "value": -633994413
        },
        {
            "id": "dtmi:smartVitalsPatch:Smart_Vitals_Patch_37p:RespiratoryRate;1",
            "name": "RespiratoryRate",
            "value": 1582211310
        },
        {
            "id": "dtmi:smartVitalsPatch:Smart_Vitals_Patch_37p:HeartRateVariability;1",
            "name": "HeartRateVariability",
            "value": -37514094
        },
        {
            "id": "dtmi:smartVitalsPatch:Smart_Vitals_Patch_37p:BodyTemperature;1",
            "name": "BodyTemperature",
            "value": 5.323322666478241e+307
        },
        {
            "id": "dtmi:smartVitalsPatch:Smart_Vitals_Patch_37p:FallDetection;1",
            "name": "FallDetection",
            "value": "Earum est nobis at voluptas id qui."
        },
        {
            "id": "dtmi:smartVitalsPatch:Smart_Vitals_Patch_37p:BloodPressure;1",
            "name": "BloodPressure",
            "value": {
                "Diastolic": 161438124,
                "Systolic": -966387879
            }
        }
    ],
    "device": {
        "id": "9xwhr7khkfri",
        "name": "wireless port",
        "templateId": "dtmi:hpzy1kfcbt2:umua7dplmbd",
        "templateName": "Smart Vitals Patch",
        "properties": {
            "reported": [
                {
                    "id": "dtmi:smartVitalsPatch:Smart_Vitals_Patch_wr:DeviceStatus;1",
                    "name": "DeviceStatus",
                    "value": "Id optio iste vero et neque sit."
                }
            ]
        },
        "cloudProperties": [],
        "simulated": true,
        "approved": true,
        "blocked": false,
        "provisioned": false
    }
}
The following JQ query transforms the input message to a separate output message for each telemetry value. This transformation produces an output that matches Azure Data Explorer table schema. The transformation uses an entity-attribute-value schema where each row holds a single telemetry value and the name of the telemetry is a value in a separate column in the same row:
. as $in | .telemetry[] | {
  EnqueuedTime: $in.enqueuedTime,
  Message: $in.messageId,
  Application: $in.applicationId,
  Device: $in.device.id,
  Simulated: $in.device.simulated,
  Template: ($in.device.templateName // ""),
  Module: ($in.module // ""),
  Component: ($in.component // ""),
  Capability: .name,
  Value: .value
}
JSON output:
{
  "Application": "570c2d7b-d72e-4ad1-aaf4-ad9b727daa47",
  "Capability": "HeartRate",
  "Component": "",
  "Device": "9xwhr7khkfri",
  "EnqueuedTime": "1909-10-10T07:11:56.078161042Z",
  "Message": null,
  "Module": "",
  "Simulated": true,
  "Template": "Smart Vitals Patch",
  "Value": -633994413
},
{
  "Application": "570c2d7b-d72e-4ad1-aaf4-ad9b727daa47",
  "Capability": "RespiratoryRate",
  "Component": "",
  "Device": "9xwhr7khkfri",
  "EnqueuedTime": "1909-10-10T07:11:56.078161042Z",
  "Message": null,
  "Module": "",
  "Simulated": true,
  "Template": "Smart Vitals Patch",
  "Value": 1582211310
},
{
  "Application": "570c2d7b-d72e-4ad1-aaf4-ad9b727daa47",
  "Capability": "HeartRateVariability",
  "Component": "",
  "Device": "9xwhr7khkfri",
  "EnqueuedTime": "1909-10-10T07:11:56.078161042Z",
  "Message": null,
  "Module": "",
  "Simulated": true,
  "Template": "Smart Vitals Patch",
  "Value": -37514094
},
{
  "Application": "570c2d7b-d72e-4ad1-aaf4-ad9b727daa47",
  "Capability": "BodyTemperature",
  "Component": "",
  "Device": "9xwhr7khkfri",
  "EnqueuedTime": "1909-10-10T07:11:56.078161042Z",
  "Message": null,
  "Module": "",
  "Simulated": true,
  "Template": "Smart Vitals Patch",
  "Value": 5.323322666478241e+307
},
{
  "Application": "570c2d7b-d72e-4ad1-aaf4-ad9b727daa47",
  "Capability": "FallDetection",
  "Component": "",
  "Device": "9xwhr7khkfri",
  "EnqueuedTime": "1909-10-10T07:11:56.078161042Z",
  "Message": null,
  "Module": "",
  "Simulated": true,
  "Template": "Smart Vitals Patch",
  "Value": "Earum est nobis at voluptas id qui."
},
{
  "Application": "570c2d7b-d72e-4ad1-aaf4-ad9b727daa47",
  "Capability": "BloodPressure",
  "Component": "",
  "Device": "9xwhr7khkfri",
  "EnqueuedTime": "1909-10-10T07:11:56.078161042Z",
  "Message": null,
  "Module": "",
  "Simulated": true,
  "Template": "Smart Vitals Patch",
  "Value": {
      "Diastolic": 161438124,
      "Systolic": -966387879
  }
}
The output data is exported to your Azure Data Explorer cluster. To visualize the exported data in Power BI, complete the following steps:
- Install the Power BI application. You can download the desktop Power BI application from Go from data to insight to action with Power BI Desktop.
- Download the Power BI desktop IoT Central ADX Connector.pbit file from GitHub.
- Use the Power BI Desktop app to open the IoT Central ADX Connector.pbit file you downloaded in the previous step. When prompted, enter the Azure Data Explorer cluster, database, and table information you made a note of previously.
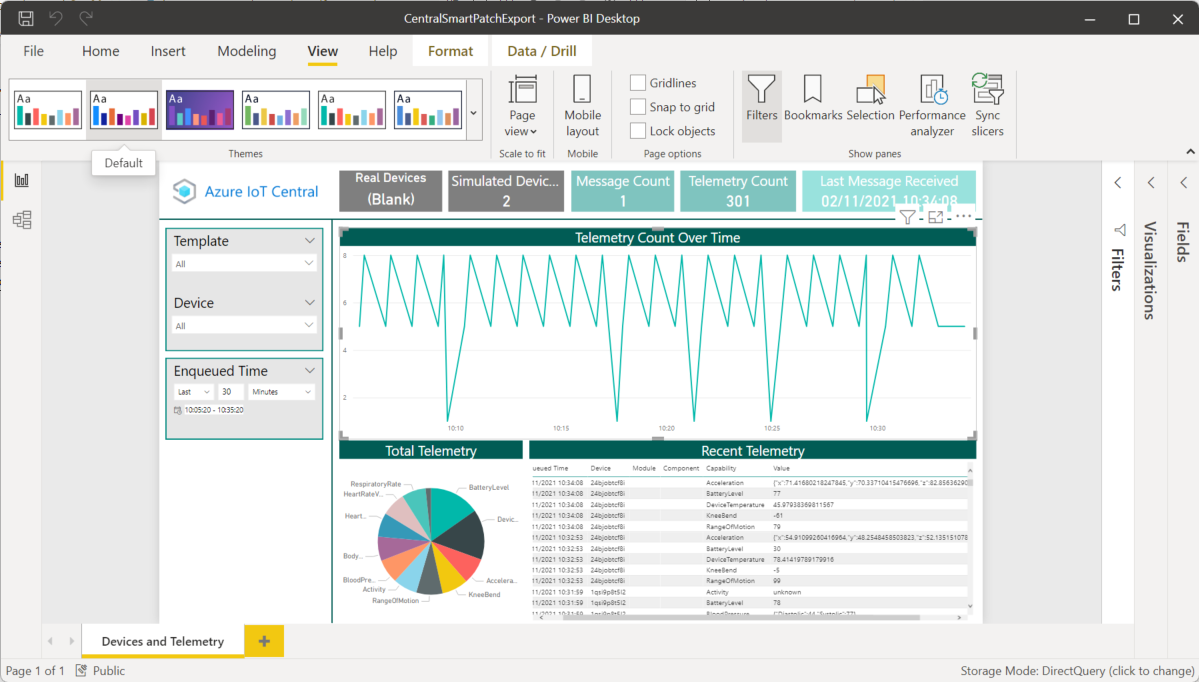
Now you can visualize the data in Power BI:
Next steps
Now that you know how to transform data in IoT Central, a suggested next step is to learn How to use analytics in IoT Central.
Feedback
Coming soon: Throughout 2024 we will be phasing out GitHub Issues as the feedback mechanism for content and replacing it with a new feedback system. For more information see: https://aka.ms/ContentUserFeedback.
Submit and view feedback for