Troubleshoot IoT Edge devices from the Azure portal
Applies to: ![]() IoT Edge 1.4
IoT Edge 1.4
Important
IoT Edge 1.4 is the supported release. If you are on an earlier release, see Update IoT Edge.
IoT Edge provides a streamlined way of monitoring and troubleshooting modules in the Azure portal. The troubleshooting page is a wrapper for the IoT Edge agent's direct methods so that you can easily retrieve logs from deployed modules and remotely restart them. This article shows you how to access and filter device and module logs in the Azure portal.
Access the troubleshooting page
You can access the troubleshooting page in the portal through either the IoT Edge device details page or the IoT Edge module details page.
Sign in to the Azure portal and navigate to your IoT hub.
In the left pane, select Devices under the Device management menu.
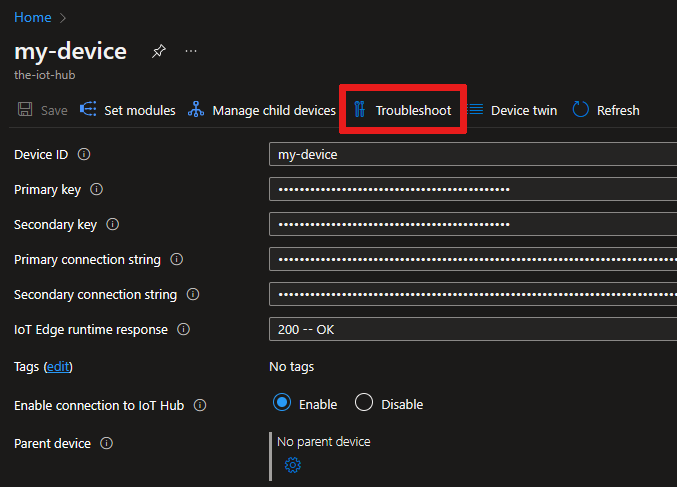
Select the IoT Edge device that you want to monitor from the list of devices.
On this device details page, you can either select Troubleshoot from the menu.
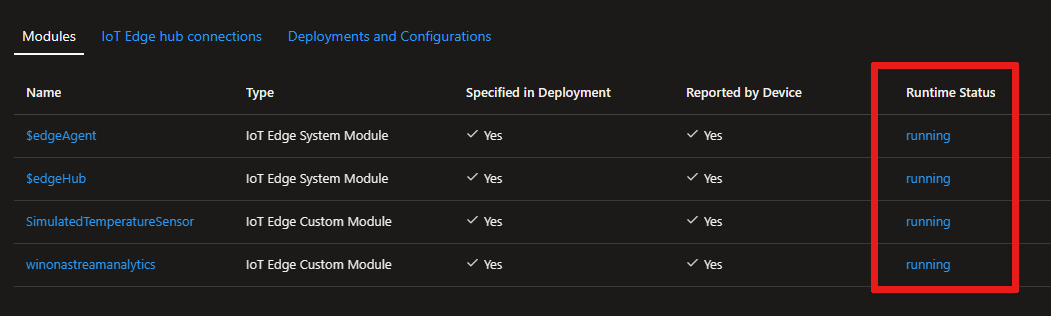
Or, select the runtime status of a particular module that you want to inspect.
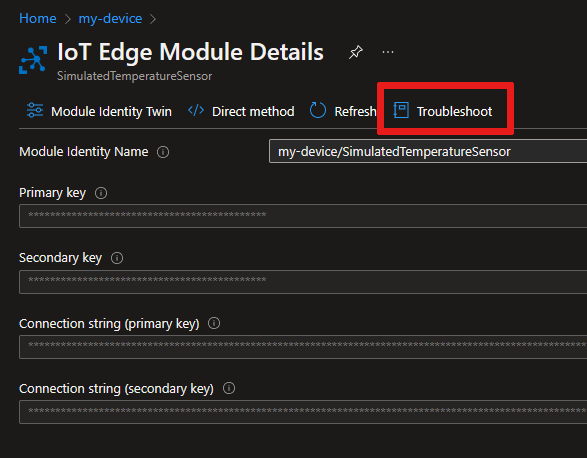
From the device details page, you can also select the name of a module to open the module details page. From there, you can select Troubleshoot from the menu.

View module logs in the portal
On the Troubleshoot page of your device, you can view and download logs from any of the running modules on your IoT Edge device.
This page has a maximum limit of 1,500 log lines, and any logs longer are truncated. If the logs are too large, the attempt to get module logs fails. In that case, try to change the time range filter to retrieve less data or consider using direct methods to Retrieve logs from IoT Edge deployments to gather larger log files.
Use the dropdown menu to choose which module to inspect.
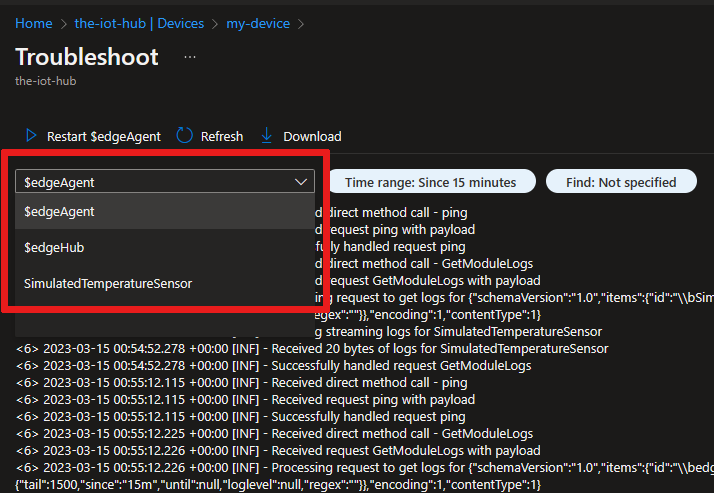
By default, this page displays the last 15 minutes of logs. Select the Time range filter to see different logs. Use the slider to select a time window within the last 60 minutes, or check Enter time instead to choose a specific datetime window.
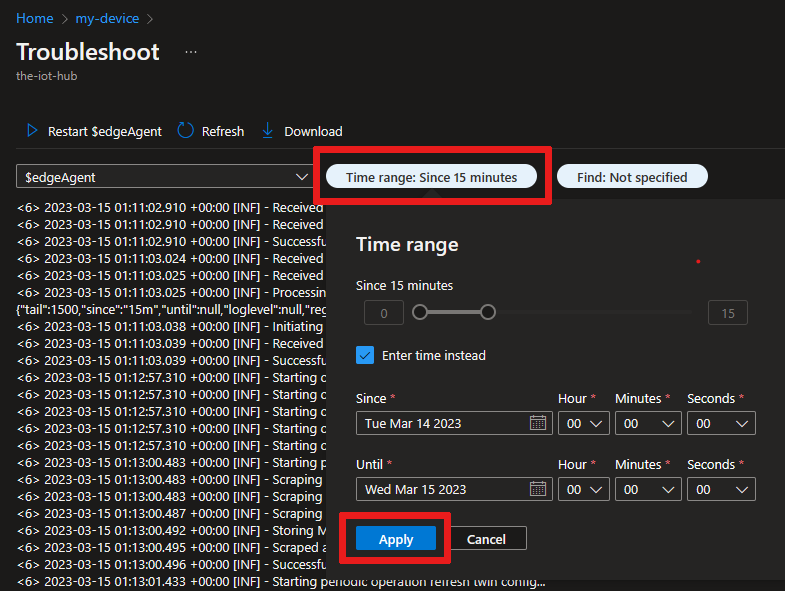
Once you have the logs and set your time filter from the module you want to troubleshoot, you can use the Find filter to retrieve specific lines from the logs. You can filter for either warnings or errors, or provide a specific term or phrase to search for.
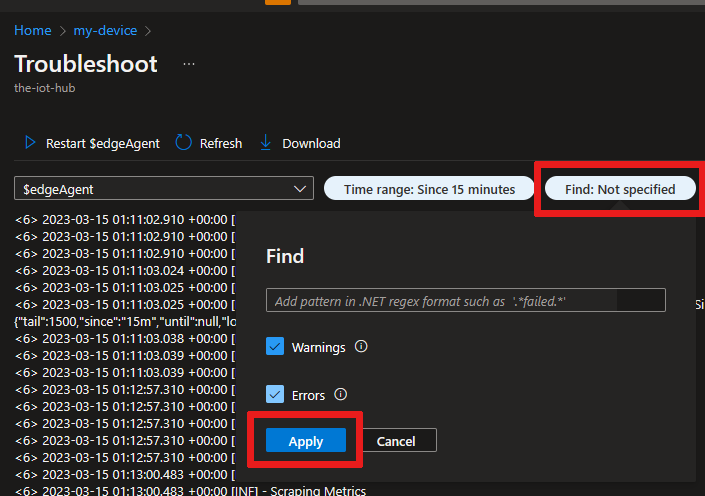
The Find feature supports plaintext searches or .NET regular expressions for more complex searches.
You can download the module logs as a text file. The downloaded log file reflects any active filters you applied to the logs.
Tip
The CPU utilization on a device spikes temporarily as it gathers logs in response to a request from the portal. This behavior is expected, and the utilization should stabilize after the task is complete.
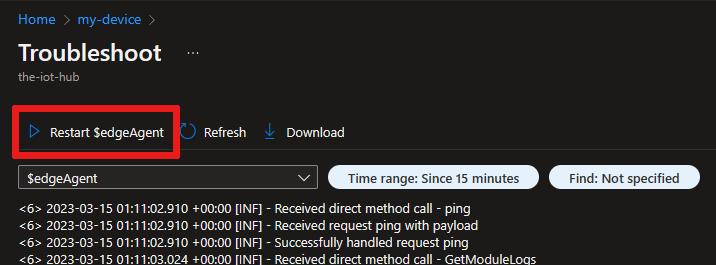
Restart modules
The Troubleshoot page includes a feature to restart a module. Selecting this option sends a command to the IoT Edge agent to restart the selected module. Restarting a module won't affect your ability to retrieve logs from before the restart.
Next steps
Find more tips for Troubleshooting your IoT Edge device or learn about Common issues and resolutions.
If you have more questions, create a Support request for help.
Feedback
Coming soon: Throughout 2024 we will be phasing out GitHub Issues as the feedback mechanism for content and replacing it with a new feedback system. For more information see: https://aka.ms/ContentUserFeedback.
Submit and view feedback for