Tutorial: Set up and use metrics and logs with an IoT hub
Use Azure Monitor to collect metrics and logs from your IoT hub to monitor the operation of your solution and troubleshoot problems when they occur. In this tutorial, you'll learn how to create charts based on metrics, how to create alerts that trigger on metrics, how to send IoT Hub operations and errors to Azure Monitor Logs, and how to check the logs for errors.
This tutorial uses the Azure sample from the .NET send telemetry quickstart to send messages to the IoT hub. You can always use a device or another sample to send messages, but you may have to modify a few steps accordingly.
Some familiarity with Azure Monitor concepts might be helpful before you begin this tutorial. To learn more, see Monitor IoT Hub. To learn more about the metrics and resource logs emitted by IoT Hub, see Monitoring data reference.
In this tutorial, you perform the following tasks:
- Use Azure CLI to create an IoT hub, register a simulated device, and create a Log Analytics workspace.
- Send IoT Hub connections and device telemetry resource logs to Azure Monitor Logs in the Log Analytics workspace.
- Use metric explorer to create a chart based on selected metrics and pin it to your dashboard.
- Create metric alerts so you can be notified by email when important conditions occur.
- Download and run an app that simulates an IoT device sending messages to the IoT hub.
- View the alerts when your conditions occur.
- View the metrics chart on your dashboard.
- View IoT Hub errors and operations in Azure Monitor Logs.
Prerequisites
An Azure subscription. If you don't have an Azure subscription, create a free account before you begin.
.NET Core SDK 2.1 or greater on your development machine. You can download the .NET Core SDK for multiple platforms from .NET.
You can verify the current version of C# on your development machine using the following command:
dotnet --versionAn email account capable of receiving mail.
Make sure that port 8883 is open in your firewall. The device sample in this tutorial uses MQTT protocol, which communicates over port 8883. This port may be blocked in some corporate and educational network environments. For more information and ways to work around this issue, see Connecting to IoT Hub (MQTT).
Use the Bash environment in Azure Cloud Shell. For more information, see Quickstart for Bash in Azure Cloud Shell.

If you prefer to run CLI reference commands locally, install the Azure CLI. If you're running on Windows or macOS, consider running Azure CLI in a Docker container. For more information, see How to run the Azure CLI in a Docker container.
If you're using a local installation, sign in to the Azure CLI by using the az login command. To finish the authentication process, follow the steps displayed in your terminal. For other sign-in options, see Sign in with the Azure CLI.
When you're prompted, install the Azure CLI extension on first use. For more information about extensions, see Use extensions with the Azure CLI.
Run az version to find the version and dependent libraries that are installed. To upgrade to the latest version, run az upgrade.
Set up resources
For this tutorial, you need an IoT hub, a Log Analytics workspace, and a simulated IoT device. These resources can be created using the Azure portal, Azure CLI, or PowerShell. Use the same resource group and location for all of the resources. Then, when you've finished the tutorial, you can remove everything in one step by deleting the resource group.
For this tutorial, we've provided a CLI script that performs the following steps:
Create a resource group.
Create an IoT hub.
Create a Log Analytics workspace.
Register a device identity for the simulated device that sends messages to your IoT hub. Save the device connection string to use to configure the simulated device.
Set up resources using Azure CLI
Copy and paste the following commands into Cloud Shell or a local command line instance that has the Azure CLI installed. Some of the commands may take some time to execute. The new resources are created in the resource group ContosoResources.
The name for some resources must be unique across Azure. The script generates a random value with the $RANDOM function and stores it in a variable. For these resources, the script appends this random value to a base name for the resource, making the resource name unique.
Set the values for the resource names that don't have to be globally unique.
location=westus
resourceGroup=ContosoResources
iotDeviceName=Contoso-Test-Device
Set the values for the resource names that have to be unique. These names have a random number concatenated to the end.
randomValue=$RANDOM
iotHubName=ContosoTestHub$randomValue
echo "IoT hub name = " $iotHubName
workspaceName=contoso-la-workspace$randomValue
echo "Log Analytics workspace name = " $workspaceName
Create the resource group to be used for all the resources for this tutorial.
az group create --name $resourceGroup --location $location
Create the IoT hub in the free tier. Each subscription can only have one free IoT hub. If you already have a free hub, change the --sku value to B1 (basic) or S1 (standard).
az iot hub create --name $iotHubName --resource-group $resourceGroup --partition-count 2 --sku F1 --location $location
Create the Log Analytics workspace
az monitor log-analytics workspace create --resource-group $resourceGroup --workspace-name $workspaceName --location $location
Create the IoT device identity to be used for testing.
az iot hub device-identity create --device-id $iotDeviceName --hub-name $iotHubName
Retrieve the primary connection string for the device identity, then copy it locally. You need this connection string to run the device simulation during the testing phase.
az iot hub device-identity connection-string show --device-id $iotDeviceName --hub-name $iotHubName
Collect logs for connections and device telemetry
IoT Hub emits resource logs for several categories of operation. To view these logs, you must create a diagnostic setting to send them to a destination. One such destination is Azure Monitor Logs, which are collected in a Log Analytics workspace. IoT Hub resource logs are grouped into different categories. You can select which categories you want sent to Azure Monitor Logs in the diagnostic setting. In this article, we'll collect logs for operations and errors having to do with connections and device telemetry. For a full list of the categories supported for IoT Hub, see IoT Hub resource logs.
To create a diagnostic setting to send IoT Hub resource logs to Azure Monitor Logs, follow these steps:
In the Azure portal, navigate to your IoT hub. If you used the CLI commands to create your resources, then your IoT hub is in the resource group ContosoResources.
Select Diagnostic settings from the Monitoring section of the navigation menu. Then select Add diagnostic setting.
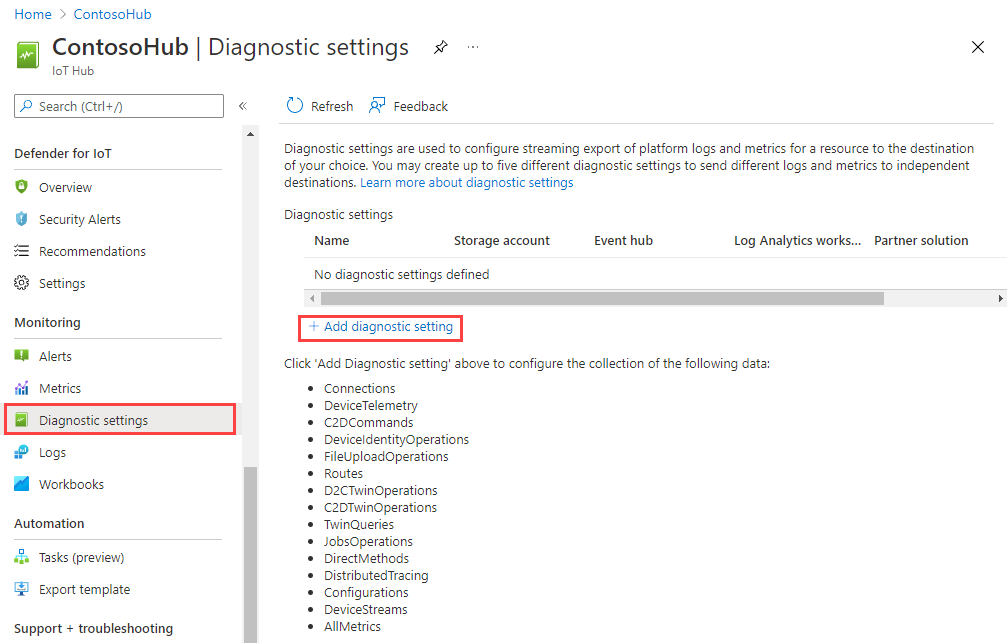
On the Diagnostics setting page, provide the following details:
Parameter Value Diagnostic setting name Give your setting a descriptive name, such as "Send connections and telemetry to logs". Logs Select Connections and Device Telemetry from the Categories list. Destination details Select Send to Log Analytics workspace, then use the Log Analytics workspace picker to select the workspace you noted previously. 
Select Save to save the settings. Close the Diagnostics setting pane. You can see your new setting in the list of diagnostic settings.
Set up metrics
Now we'll use metrics explorer to create a chart that displays metrics you want to track. You'll pin this chart to your default dashboard in the Azure portal.
In your IoT hub menu, select Metrics from the Monitoring section.
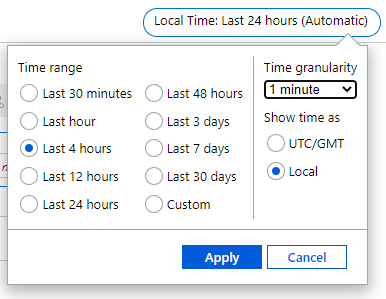
At the top of the screen, select Last 24 hours (Automatic). In the dropdown that appears, select Last 4 hours for Time range, set Time granularity to 1 minute, and select Local for Show time as. Select Apply to save these settings. The setting should now say Local Time: Last 4 hours (1 minute).
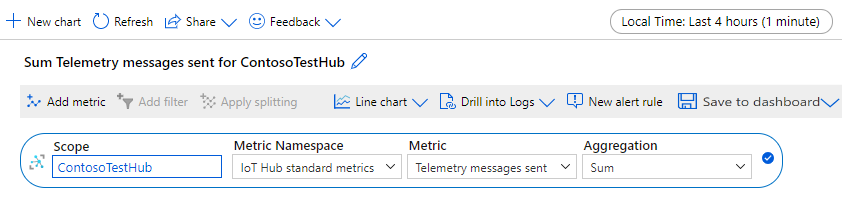
On the chart, there's a partial metric setting displayed scoped to your IoT hub. Leave the Scope and Metric Namespace values at their defaults. Select the Metric setting and type "Telemetry", then select Telemetry messages sent from the dropdown. Aggregation will be automatically set to Sum. Notice that the title of your chart also changes.
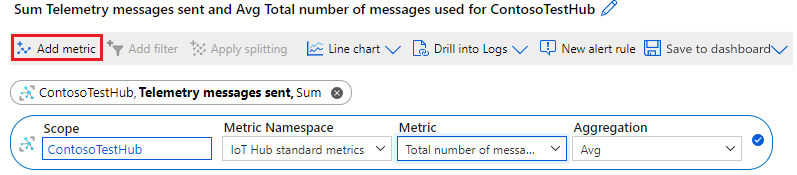
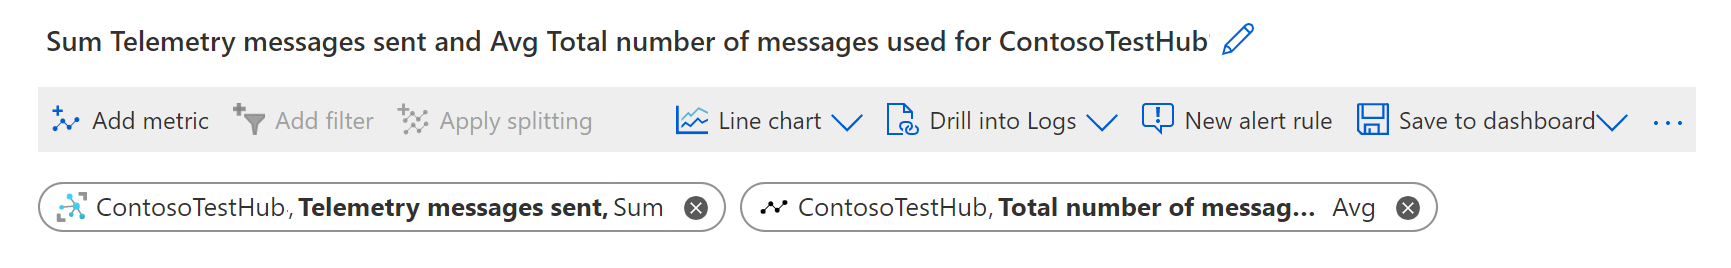
Now select Add metric to add another metric to the chart. Under Metric, select Total number of messages used. For Aggregation, select Avg. Notice again that the title of the chart has changed to include this metric.
Now your screen shows the minimized metric for Telemetry messages sent, plus the new metric for Total number of messages used.
In the upper right of the chart, select Save to dashboard and choose Pin to dashboard from the dropdown list.
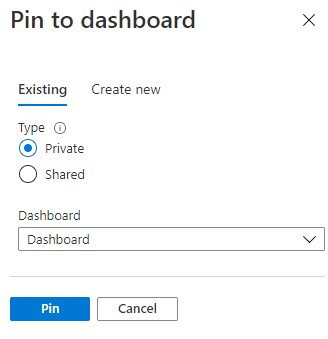
On the Pin to dashboard pane, select the Existing tab. Select Private and then select Dashboard from the Dashboard dropdown. Finally, select Pin to pin the chart to your default dashboard in Azure portal. If you don't pin your chart to a dashboard, your settings aren't retained when you exit metric explorer.
Set up metric alerts
Now we'll set up alerts to trigger on two metrics: Telemetry messages sent and Total number of messages used.
Telemetry messages sent is a good metric to track message throughput and avoid being throttled. For an IoT hub in the free tier, the throttling limit is 100 messages/sec. With a single device, we won't be able to achieve that kind of throughput, so instead, we'll set up the alert to trigger if the number of messages exceeds 1000 in a 5-minute period. In production, you can set the signal to a more significant value based on the tier, edition, and number of units of your IoT hub.
Total number of messages used tracks the daily number of messages used. This metric resets every day at 00:00 UTC. If you exceed your daily quota past a certain threshold, your IoT Hub will no longer accept messages. For an IoT hub in the free tier, the daily message quota is 8000. We'll set up the alert to trigger if the total number of messages exceeds 4000, 50% of the quota. In practice, you'd probably set this percentage to a higher value. The daily quota value is dependent on the tier, edition, and number of units of your IoT hub.
For more information about quota and throttling limits with IoT Hub, see Quotas and throttling.
To set up metric alerts:
In your IoT hub menu, select Alerts from the Monitoring section.
Select Create alert rule.
On the Create alert rule pane, there are four sections:
- Scope is already set to your IoT hub, so we'll leave this section alone.
- Condition sets the signal and conditions that will trigger the alert.
- Actions configures what happens when the alert triggers.
- Details lets you set a name and a description for the alert.
First configure the condition that the alert will trigger on.
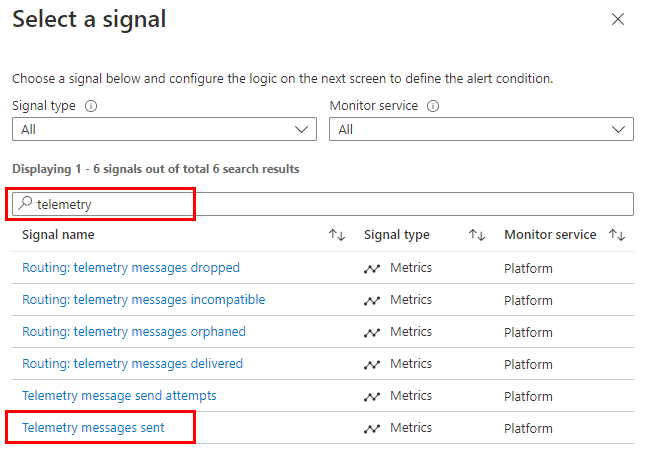
The Condition tab opens with the Select a signal pane open. Type "telemetry" in the signal name search box and select Telemetry messages sent.
On the Configure signal logic pane, set or confirm the following fields under Alert logic (you can ignore the chart):
Parameter Value Threshold Static Operator Greater than Aggregation type Total Threshold value 1000 Unit Count Aggregation granularity (Period) 5 minutes Frequency of evaluation Every 1 Minute 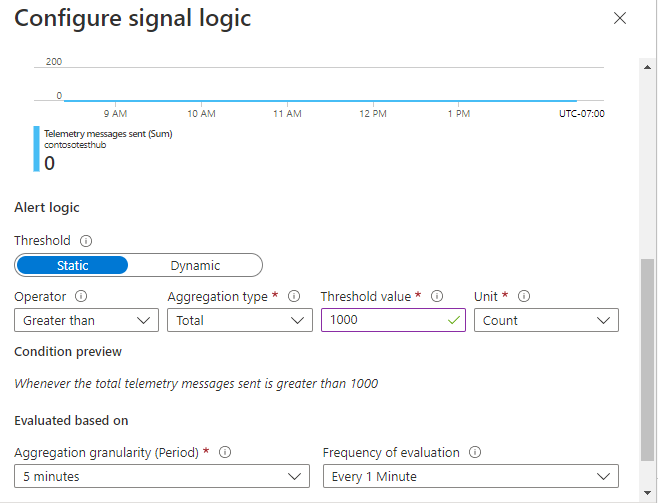
These settings set the signal to total the number of messages over a period of 5 minutes. This total will be evaluated every minute, and, if the total for the preceding 5 minutes exceeds 1000 messages, the alert will trigger.
Select Done to save the signal logic.
Select Next: Actions to configure the action for the alert.
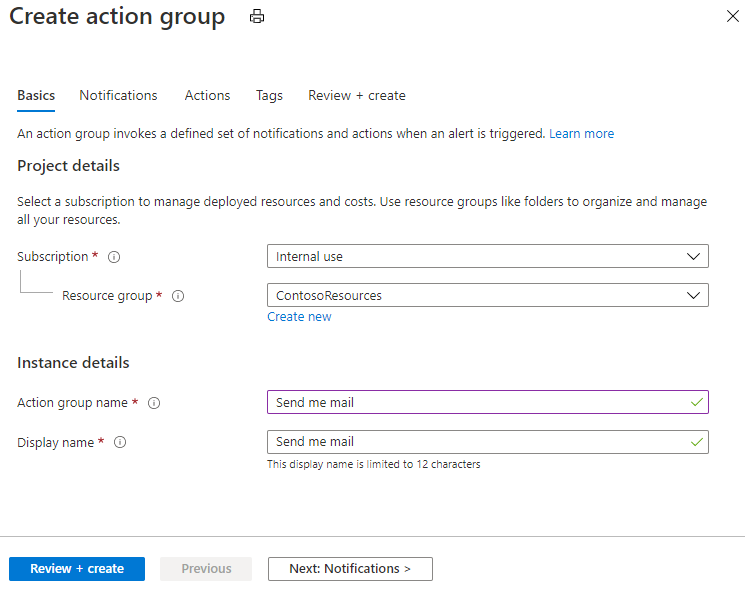
Select Create action group.
On the Basics tab on the Create action group pane, give your action group a name and a display name.
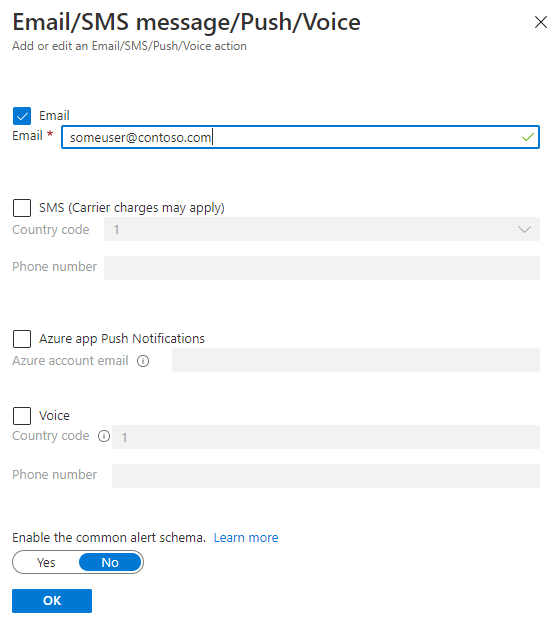
Select the Notifications tab. For Notification type, select Email/SMS message/Push/Voice from the dropdown. The Email/SMS message/Push/Voice pane opens.
On the Email/SMS message/Push/Voice pane, select email and enter your email address, then select OK.
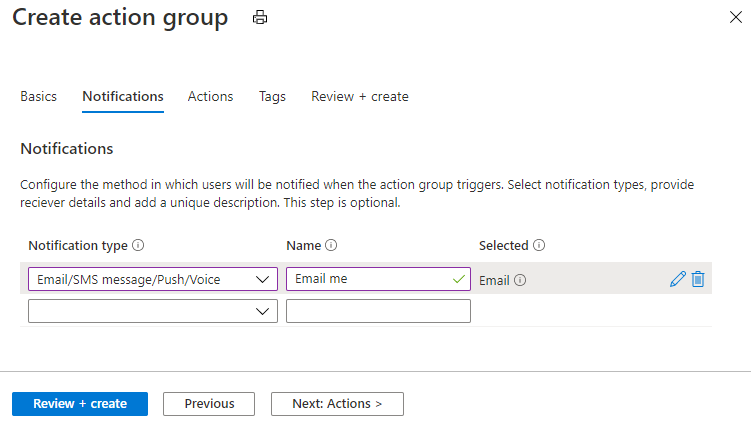
Back on the Notifications pane, enter a name for the notification.
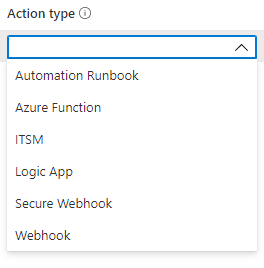
(Optional) On the action group Actions tab, the Action type dropdown lists the kinds of actions that you can trigger with an alert. For this article, we'll only use notifications, so you can ignore the settings under this tab.
Select the Review and Create tab, verify your settings, and select Create.
Back on the alert rule Actions tab, notice that your new action group has been added to the actions for the alert.
Select Next: Details to configure the alert rule details and save the alert rule.
- On the Details tab, provide a name and a description for your alert; for example, "Alert if more than 1000 messages over 5 minutes".
Select Review + create to review the details of your alert rule. If everything looks correct, select Create to save your new rule.
Now set up another alert for the Total number of messages used. This metric is useful if you want to send an alert when the number of messages used is approaching the daily quota for the IoT hub, at which point the IoT hub will start rejecting messages. Follow the steps you did before, with the following differences.
For the signal on the Configure signal logic pane, select Total number of messages used.
On the Configure signal logic pane, set or confirm the following fields (you can ignore the chart):
Parameter Value Threshold Static Operator Greater than Aggregation type Total Threshold value 4000 Unit Count Aggregation granularity (Period) 1 minute Frequency of evaluation Every 1 Minute These settings set the signal to fire when the number of messages reaches 4000. The metric is evaluated every minute.
When you specify the action for your alert rule, select same the action group that you created for the previous rule.
For the alert details, choose a different name and description than you did previously.
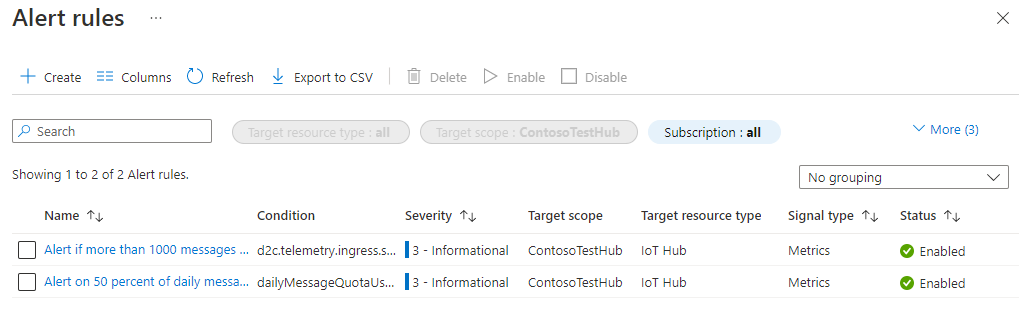
Select Alerts, under Monitoring on the left pane of your IoT hub. Now select Alert rules on the menu at the top of the Alerts pane. The Alert rules pane opens. You should see your two alerts:
Close the Alert rules pane.
With these settings, an alert will trigger and you'll get an email notification when more than 1000 messages are sent within a 5-minute time span and also when the total number of messages used exceeds 4000 (50% of the daily quota for an IoT hub in the free tier).
Run the simulated device app
In the Set up resources section, you registered a device identity to use to simulate using an IoT device. In this section, you download a .NET console app that simulates a device that sends device-to-cloud messages to an IoT hub, configure it to send these messages to your IoT hub, and then run it.
Important
Alerts can take up to 10 minutes to be fully configured and enabled by IoT Hub. Wait at least 10 minutes between the time you configure your last alert and running the simulated device app.
Download or clone the solution for the Azure IoT C# SDK repo from GitHub. This repo contains several sample applications. For this tutorial, we'll use iothub/device/samples/getting started/SimulatedDevice/.
In a local terminal window, navigate to the root folder of the solution. Then navigate to the iothub\device\samples\getting started\SimulatedDevice folder.
Open the SimulatedDevice.cs file in a text editor of your choice.
Replace the value of the
s_connectionStringvariable with the device connection string you noted when you ran the script to set up resources.In the
SendDeviceToCloudMessagesAsyncmethod, change theTask.Delayfrom 1000 to 1, which reduces the amount of time between sending messages from 1 second to 0.001 second. Shortening this delay increases the number of messages sent. (You'll likely not get a message rate of 100 messages per second.)await Task.Delay(1);Save your changes to SimulatedDevice.cs.
In the local terminal window, run the following command to install the required packages for the simulated device application:
dotnet restoreIn the local terminal window, run the following command to build and run the simulated device application:
dotnet runThe following screenshot shows the output as the simulated device application sends telemetry to your IoT hub:
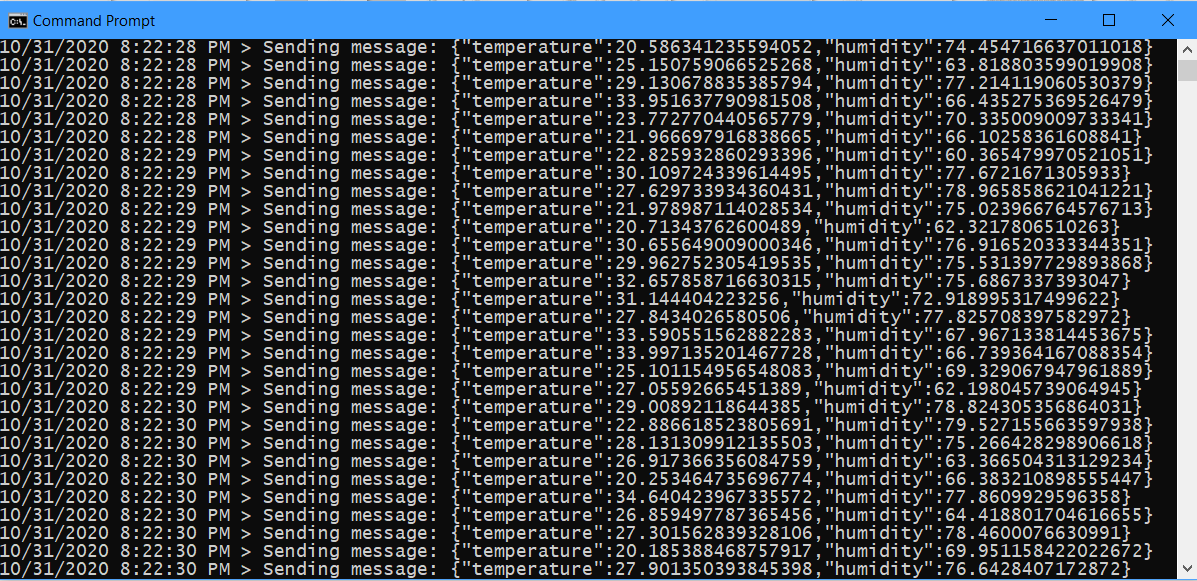
Let the application run for at least 10-15 minutes. Ideally, let it run until it stops sending messages (about 20-30 minutes). This will happen when you've exceeded the daily message quota for your IoT hub, and it has stopped accepting any more messages.
Note
If you leave the device app running for an extended period after it stops sending messages, you may get an exception. You can safely ignore this exception and close the app window.
View metrics chart on your dashboard
In the upper-left corner of Azure portal, open the portal menu, and then select Dashboard.
Find the chart you pinned earlier and click anywhere on the tile outside of the chart data to expand it. It shows the telemetry messages sent and the total number of messages used on the chart. The most recent numbers appear at the bottom of the chart. You can move the cursor in the chart to see the metric values for specific times. You can also change the time value and granularity at the top of the chart to narrow down or expand the data to a time period of interest.
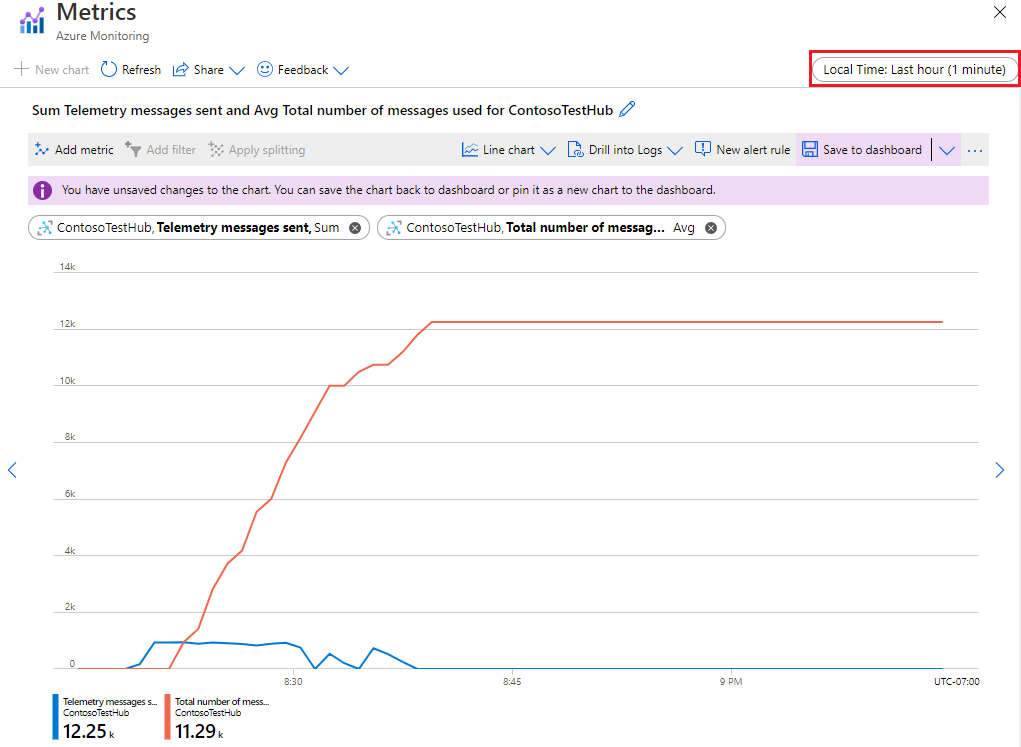
In this scenario, the simulated device's message throughput isn't large enough to cause IoT Hub to throttle its messages. In a scenario that actually involves throttling, you may see telemetry messages sent exceed the throttle limit for your IoT hub for a limited time. This is to accommodate burst traffic. For details, see traffic shaping.
View the alerts
When the number of messages sent exceeds the limits you set in your alert rules, you start getting e-mail alerts.
To see if there are any active alerts, select Alerts under Monitoring on the left pane of your IoT hub. The Alerts pane shows the number of alerts that have fired sorted by severity for the specified time range.
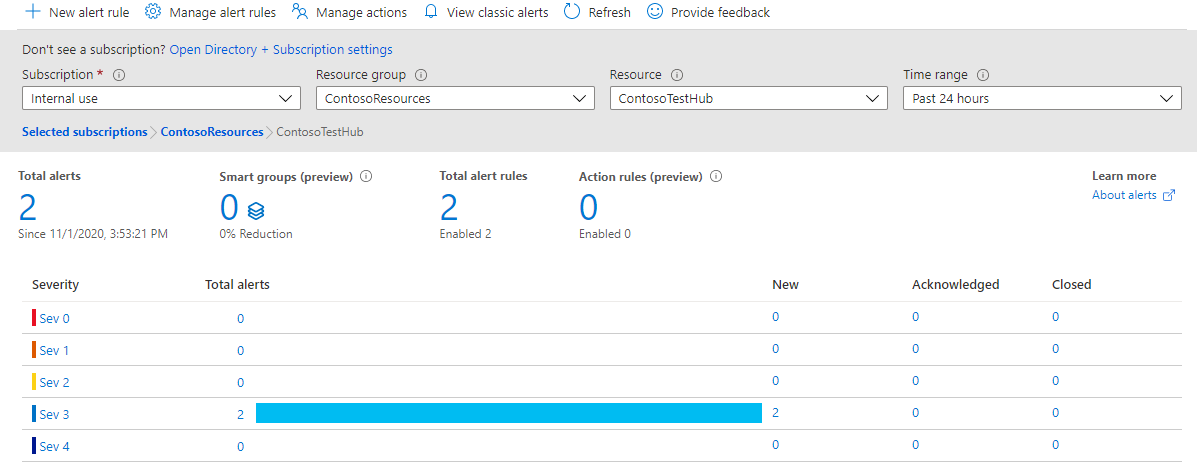
Select the row for severity Sev 3. The All Alerts pane opens and lists the Sev 3 alerts that have fired.
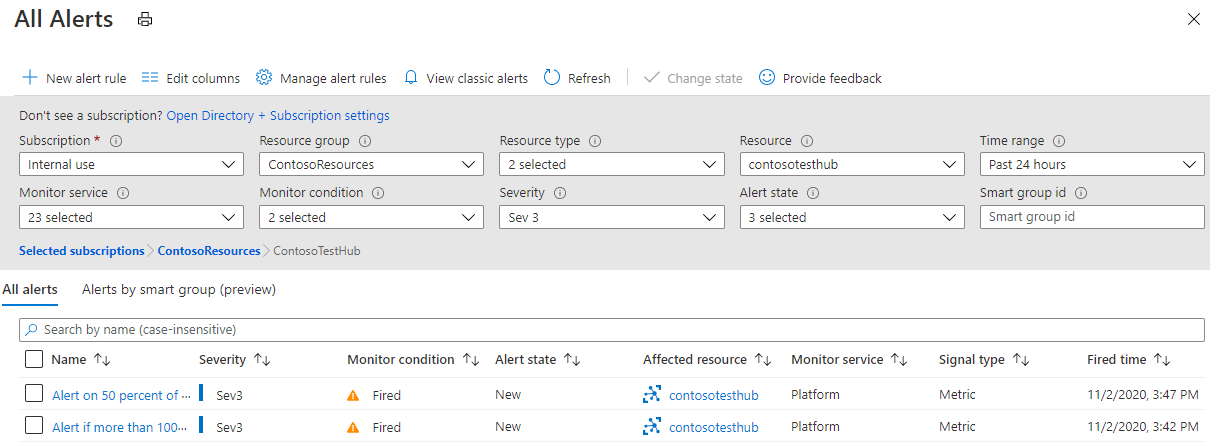
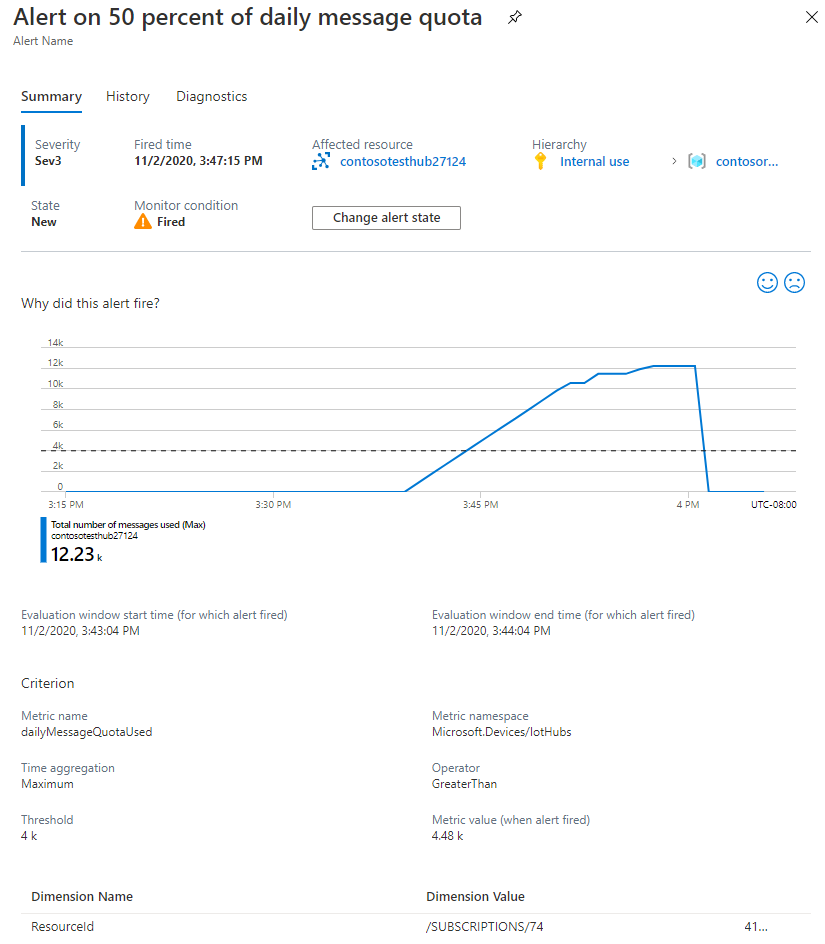
Select one of the alerts to see the alert details.
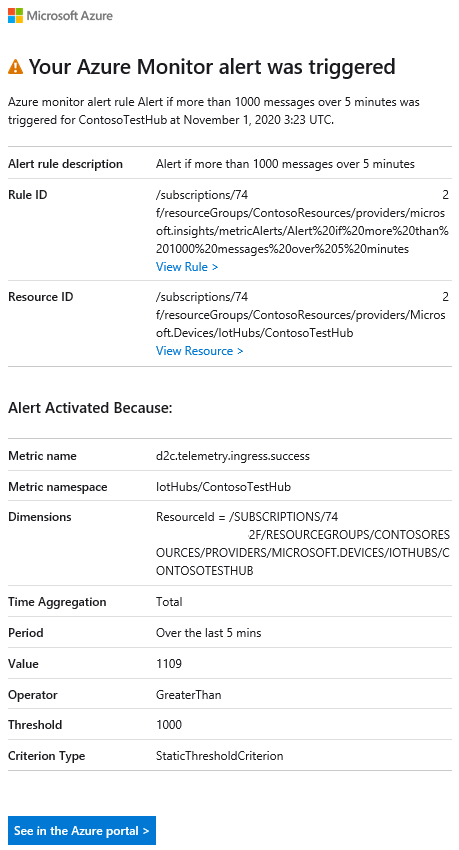
Check your inbox for emails from Microsoft Azure. The subject line will describe the alert that was triggered. For example, Azure: Activated Severity: 3 Alert if more than 1000 messages over 5 minutes. The body will look similar to the following image:
View Azure Monitor Logs
In the Collect logs for connections and device telemetry section, you created a diagnostic setting to send resource logs emitted by your IoT hub for connection and device telemetry operations to Azure Monitor Logs. In this section, you'll run a Kusto query against Azure Monitor Logs to observe any errors that occurred.
Under Monitoring in the left pane of your IoT hub in Azure portal, select Logs. Close the initial Queries window if it opens.
On the New Query pane, select the Queries tab and then expand IoT Hub to see the list of default queries.
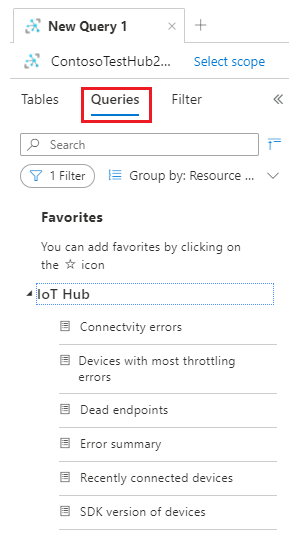
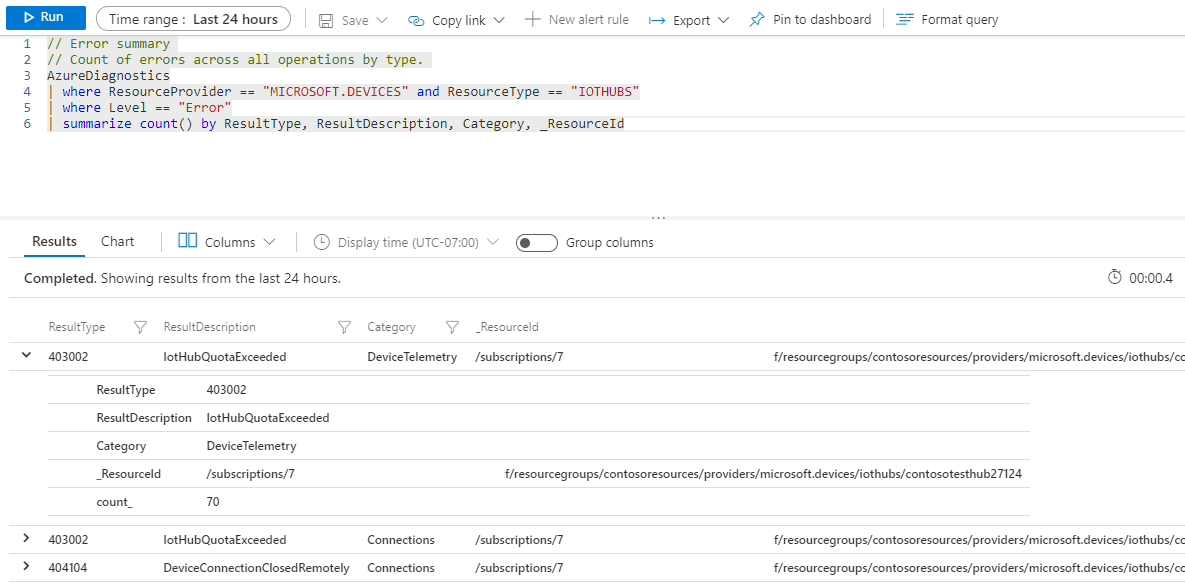
Select the Error summary query. The query appears in the Query editor pane. Select Run in the editor pane and observe the query results. Expand one of the rows to see details.
Note
If you don't see any errors, try running the Recently connected devices query. This should return a row for the simulated device.
Clean up resources
To remove all of the resources you've created in this tutorial, delete the resource group. This action deletes all resources contained within the group. In this case, it removes the IoT hub, the Log Analytics workspace, and the resource group itself. If you have pinned metrics charts to the dashboard, you'll have to remove them manually by clicking on the three dots in the upper right-hand corner of each chart and selecting Remove. Be sure to save your changes after doing deleting the charts.
To remove the resource group, use the az group delete command.
az group delete --name ContosoResources
Next steps
In this tutorial, you learned how to use IoT Hub metrics and logs by performing the following tasks:
- Use Azure CLI to create an IoT hub, register a simulated device, and create a Log Analytics workspace.
- Send IoT Hub connections and device telemetry resource logs to Azure Monitor Logs in the Log Analytics workspace.
- Use metric explorer to create a chart based on selected metrics and pin it to your dashboard.
- Create metric alerts so you can be notified by email when important conditions occur.
- Download and run an app that simulates an IoT device sending messages to the IoT hub.
- View the alerts when your conditions occur.
- View the metrics chart on your dashboard.
- View IoT Hub errors and operations in Azure Monitor Logs.
Advance to the next tutorial to learn how test disaster recovery capabilities for IoT Hub.
Feedback
Coming soon: Throughout 2024 we will be phasing out GitHub Issues as the feedback mechanism for content and replacing it with a new feedback system. For more information see: https://aka.ms/ContentUserFeedback.
Submit and view feedback for