How to monitor your Azure Managed Grafana instance with logs
In this article, you'll learn how to monitor an Azure Managed Grafana instance by configuring diagnostic settings and accessing event logs.
Prerequisites
- An Azure account with an active subscription. Create an account for free.
- An Azure Managed Grafana instance with access to at least one data source. If you don't have a Managed Grafana instance yet, create an Azure Managed Grafana instance and add a data source.
Sign in to Azure
Sign in to the Azure portal at https://portal.azure.com/ with your Azure account.
Add diagnostic settings
To monitor an Azure Managed Grafana instance, the first step to take is to configure diagnostic settings. In this process, you'll configure the streaming export of your instance's logs to a destination of your choice.
You can create up to five different diagnostic settings to send different logs to independent destinations.
Open a Managed Grafana resource, and go to Diagnostic settings, under Monitoring
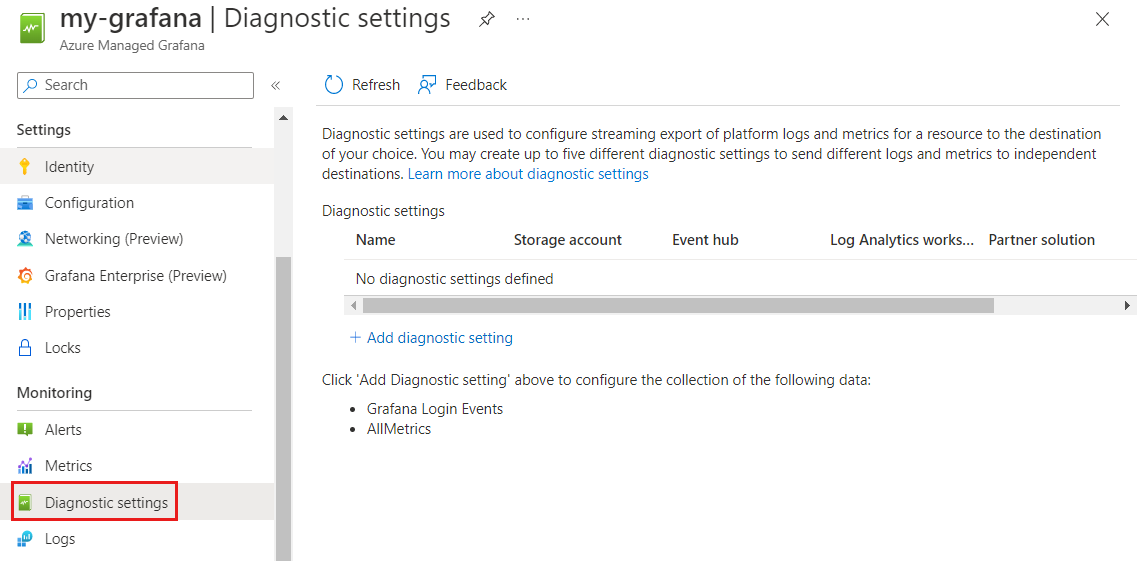
Select + Add diagnostic setting.
For Diagnostic setting name, enter a unique name.
Select allLogs from the following options:
- audit streams all audit logs
- allLogs streams all logs
- Grafana Login Events streams all Grafana login events
- AllMetrics streams all metrics
Under Destination details, select one or more destinations, fill out details and select Save.
Destination Description Settings Log Analytics workspace Send data to a Log Analytics workspace Select the subscription containing an existing Log Analytics workspace, then select the Log Analytics workspace Storage account Archive data to a storage account Select the subscription containing an existing storage account, then select the storage account. Only storage accounts in the same region as the Grafana instance are displayed in the dropdown menu. Event hub Stream to an event hub Select a subscription and an existing Azure Event Hubs namespace. Optionally also choose an existing event hub. Lastly, choose an event hub policy from the list. Only event hubs in the same region as the Grafana instance are displayed in the dropdown menu. Partner solution Send to a partner solution Select a subscription and a destination. For more information about available destinations, go to partner destinations. 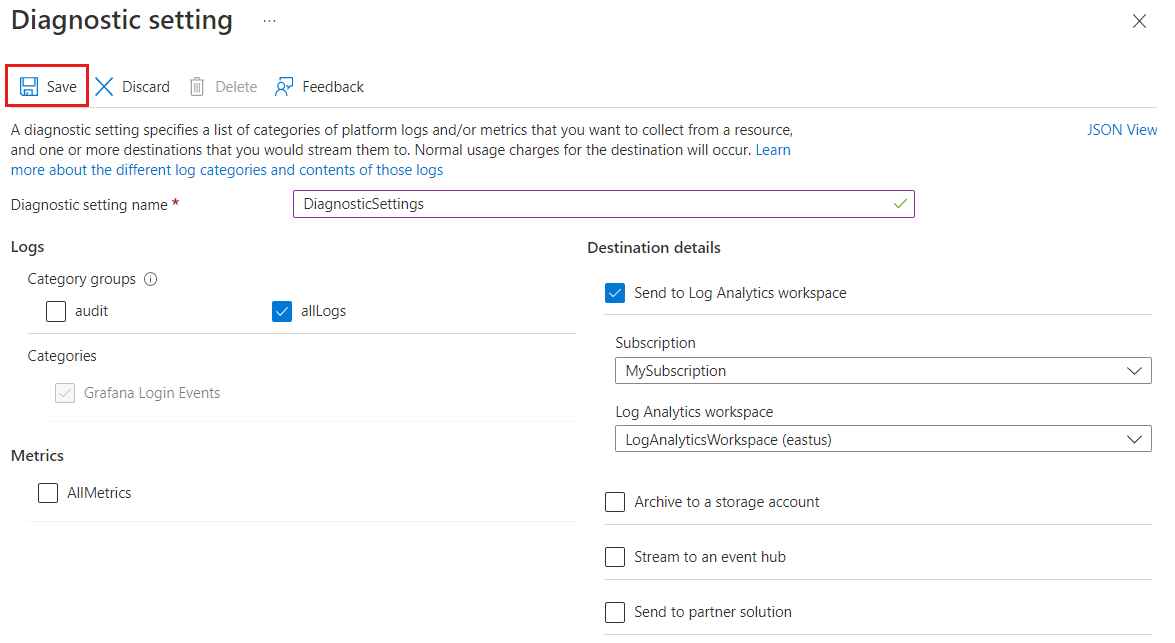
Access logs
Now that you've configured your diagnostic settings, Azure will stream all new events to your selected destinations and generate logs. You can now create queries and access logs to monitor your application.
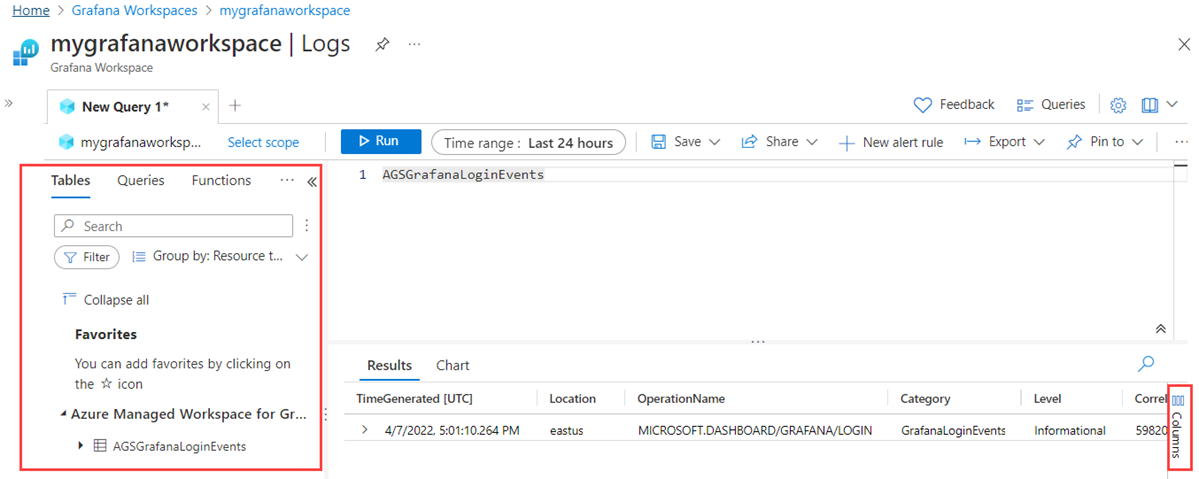
In your Managed Grafana instance, select Logs from the left menu. The Azure platform displays a Queries page, with suggestions of queries to choose from.
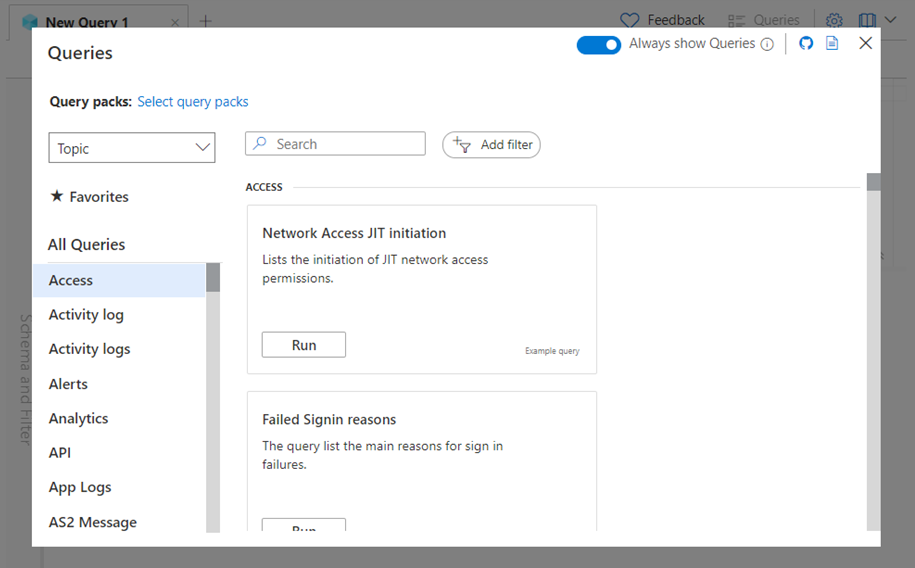
Select a query from the suggestions displayed under the Queries page, or close the page to create your own query.
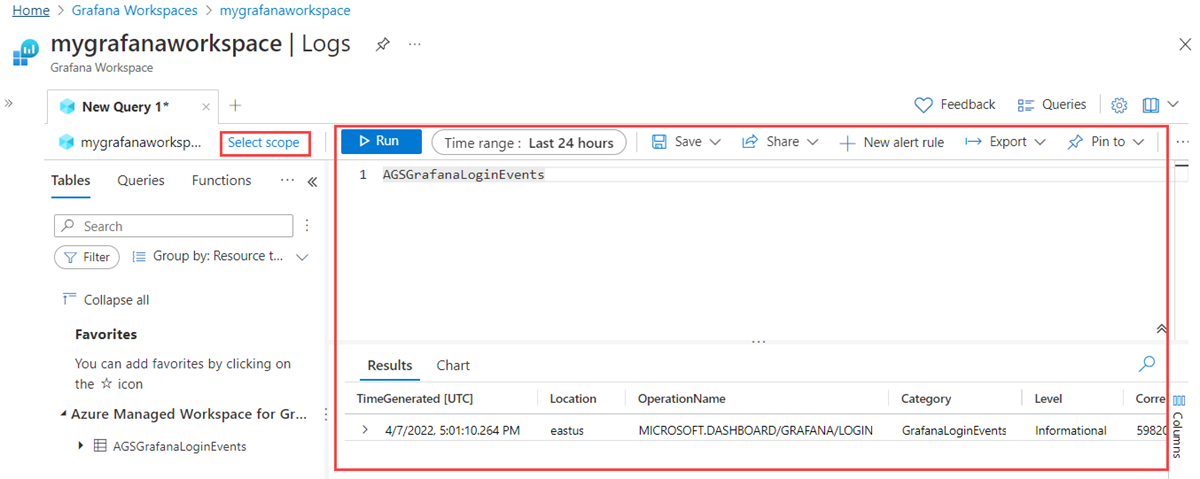
- To use a suggested query, select a query and select Run, or select Load to editor to review the code.
- To create your own query, enter your query in the code editor and select Run. You can also perform some actions, such as editing the scope and the range of the query, as well as saving and sharing the query. The result of the query is displayed in the lower part of the screen.
Select Schema and Filter on the left side of the screen to access tables, queries and functions. You can also filter and group results, as well as find your favorites.
Select Columns on the right of Results to edit the columns of the results table, and manage the table like a pivot table.


Next steps
Feedback
Coming soon: Throughout 2024 we will be phasing out GitHub Issues as the feedback mechanism for content and replacing it with a new feedback system. For more information see: https://aka.ms/ContentUserFeedback.
Submit and view feedback for