Tune performance and maintain databases in Azure Database for MySQL - Flexible Server using the sys_schema
APPLIES TO:  Azure Database for MySQL - Single Server
Azure Database for MySQL - Flexible Server
Azure Database for MySQL - Single Server
Azure Database for MySQL - Flexible Server
Important
Azure Database for MySQL single server is on the retirement path. We strongly recommend that you upgrade to Azure Database for MySQL flexible server. For more information about migrating to Azure Database for MySQL flexible server, see What's happening to Azure Database for MySQL Single Server?
The MySQL performance_schema, first available in MySQL 5.5, provides instrumentation for many vital server resources such as memory allocation, stored programs, metadata locking, etc. However, the performance_schema contains more than 80 tables, and getting the necessary information often requires joining tables within the performance_schema, and tables from the information_schema. Building on both performance_schema and information_schema, the sys_schema provides a powerful collection of user-friendly views in a read-only database and is fully enabled in Azure Database for MySQL flexible server version 5.7.
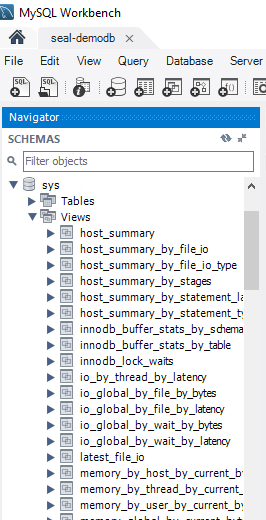
There are 52 views in the sys_schema, and each view has one of the following prefixes:
- Host_summary or IO: I/O related latencies.
- InnoDB: InnoDB buffer status and locks.
- Memory: Memory usage by the host and users.
- Schema: Schema-related information, such as auto increment, indexes, etc.
- Statement: Information on SQL statements; it can be statement that resulted in full table scan, or long query time.
- User: Resources consumed and grouped by users. Examples are file I/Os, connections, and memory.
- Wait: Wait events grouped by host or user.
Now let's look at some common usage patterns of the sys_schema. To begin with, we'll group the usage patterns into two categories: Performance tuning and Database maintenance.
Performance tuning
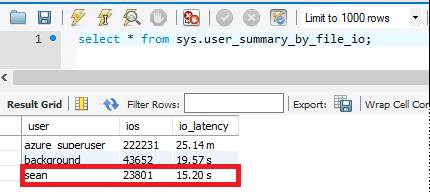
sys.user_summary_by_file_io
IO is the most expensive operation in the database. We can find out the average IO latency by querying the sys.user_summary_by_file_io view. With the default 125 GB of provisioned storage, my IO latency is about 15 seconds.
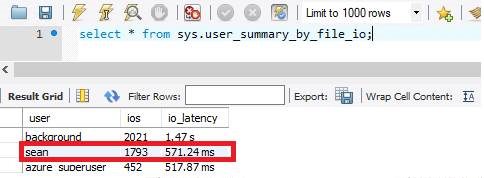
Because Azure Database for MySQL flexible server scales IO with respect to storage, after increasing my provisioned storage to 1 TB, my IO latency reduces to 571 ms.
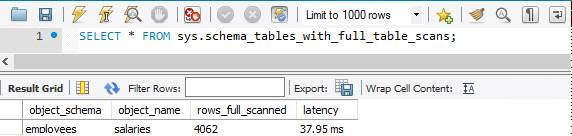
sys.schema_tables_with_full_table_scans
Despite careful planning, many queries can still result in full table scans. For more information about the types of indexes and how to optimize them, you can refer to this article: How to troubleshoot query performance. Full table scans are resource-intensive and degrade your database performance. The quickest way to find tables with full table scan is to query the sys.schema_tables_with_full_table_scans view.
sys.user_summary_by_statement_type
To troubleshoot database performance issues, it may be beneficial to identify the events happening inside of your database, and using the sys.user_summary_by_statement_type view may just do the trick.
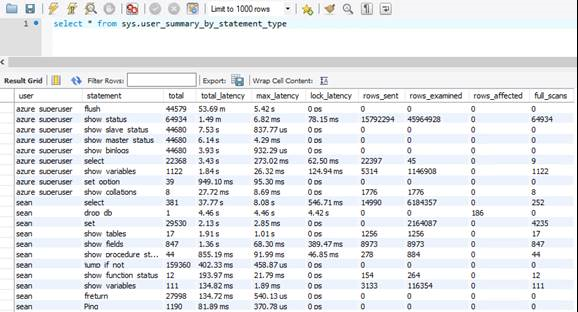
In this example, Azure Database for MySQL flexible server spent 53 minutes flushing the slow query log 44579 times. That's a long time and many IOs. You can reduce this activity by either disabling your slow query log or decreasing the frequency of slow query login to the Azure portal.
Database maintenance
sys.innodb_buffer_stats_by_table
[!IMPORTANT]
Querying this view can impact performance. It is recommended to perform this troubleshooting during off-peak business hours.
The InnoDB buffer pool resides in memory and is the main cache mechanism between the DBMS and storage. The size of the InnoDB buffer pool is tied to the performance tier and can’t be changed unless a different product SKU is chosen. As with memory in your operating system, old pages are swapped out to make room for fresher data. To find out which tables consume most of the InnoDB buffer pool memory, you can query the sys.innodb_buffer_stats_by_table view.
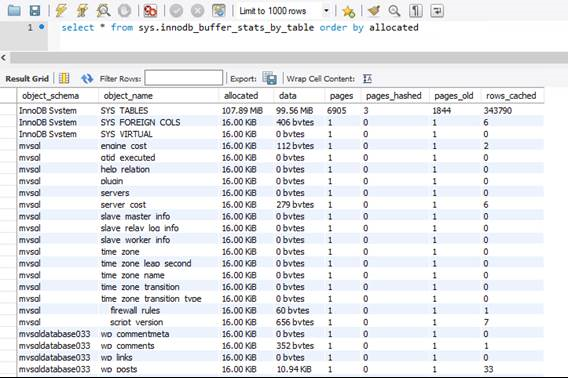
In the graphic above, it's apparent that other than system tables and views, each table in the mysqldatabase033 database, which hosts one of my WordPress sites, occupies 16 KB, or 1 page, of data in memory.
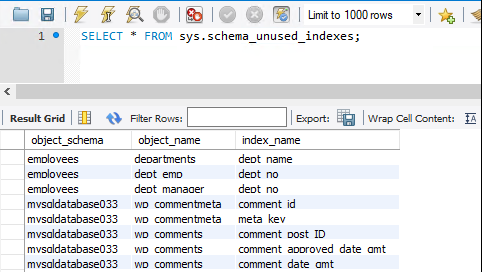
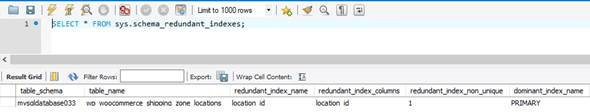
Sys.schema_unused_indexes & sys.schema_redundant_indexes
Indexes are great tools to improve read performance, but they do incur additional costs for inserts and storage. Sys.schema_unused_indexes and sys.schema_redundant_indexes provide insights into unused or duplicate indexes.
Conclusion
In summary, the sys_schema is a great tool for both performance tuning and database maintenance. Make sure to take advantage of this feature in your Azure Database for MySQL flexible server instance.
Next steps
- To find peer answers to your most concerned questions or post a new question/answer, visit Stack Overflow.
Feedback
Coming soon: Throughout 2024 we will be phasing out GitHub Issues as the feedback mechanism for content and replacing it with a new feedback system. For more information see: https://aka.ms/ContentUserFeedback.
Submit and view feedback for