Monitor Azure Private 5G Core with Azure Monitor platform metrics
Platform metrics are measurements over time collected from Azure resources and stored by Azure Monitor Metrics. You can use the Azure Monitor Metrics Explorer to analyze metrics in the Azure portal, or query the Azure Monitor REST API for metrics to analyze with third-party monitoring tools.
Azure Private 5G Core (AP5GC) platform metrics are collected per site and allow you to monitor key statistics relating to your deployment. See Supported metrics with Azure Monitor for the available AP5GC metrics. AP5GC metrics are included under microsoft.mobilenetwork/packetcorecontrolplanes and microsoft.mobilenetwork/packetcorecontrolplanes/packetcoredataplanes.
Once you create a Mobile Network Site resource, Azure Monitor automatically starts gathering metrics about the packet core instance. For more information on creating a mobile network site, see Collect the required information for a site.
Platform metrics are available for monitoring and retrieval for up to 92 days. If you want to store your data for longer, you can export them using the Azure Monitor REST API. Once exported, metrics can be saved to a storage account that allows longer data retention. See Azure Storage for some examples of storage accounts you can use.
If you want to use the Azure portal to analyze your packet core metrics, see Visualize metrics using the Azure portal.
If you want to export metrics for analysis using your tool of choice or for longer storage periods, see Export metrics using the Azure Monitor REST API.
Visualize metrics using the Azure portal
You can use the Azure portal to monitor your deployment's health and performance on the Packet Core Control Plane resource's Overview page. This displays data captured from both the control plane and data plane:
- The control plane generates metrics relating to access, mobility and session management, such as registration and session establishment successes and failures.
- The data plane generates metrics relating to the data plane, such as throughput and packet drops.
Sign in to the Azure portal.
Search for and select the Packet Core Control Plane resource for the site you're interested in monitoring:
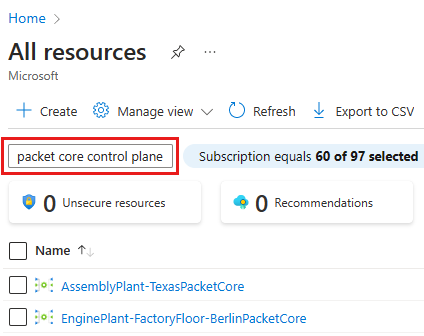
Select All resources.
Enter packet core control plane into the filter text box.
Select the Packet Core Control Plane resource.
Select the Monitoring tab.
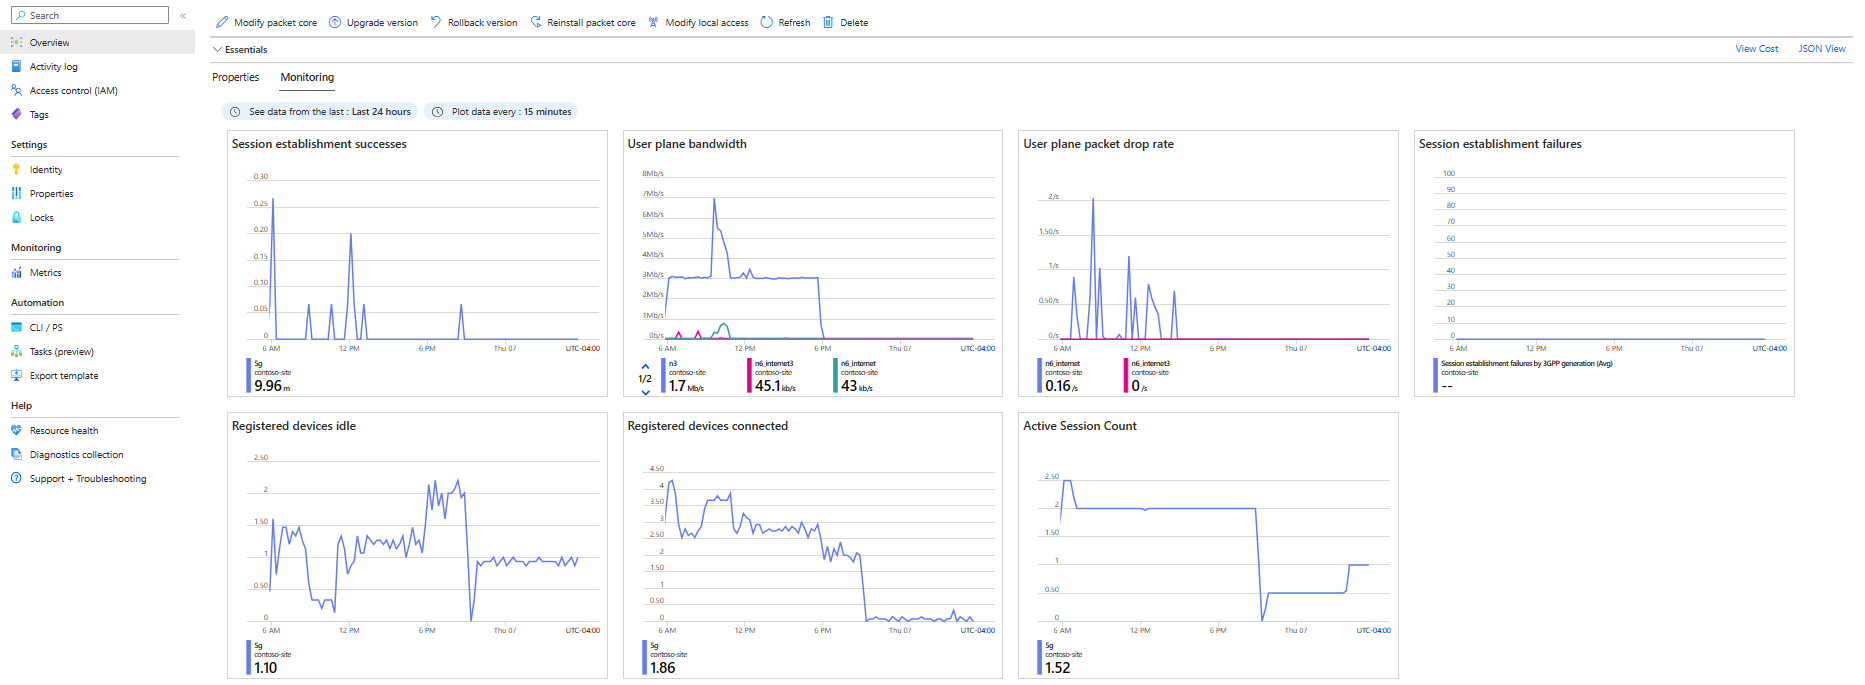

You should now see the Azure Monitor dashboard displaying important key performance indicators (KPIs), including the number of connected devices and session establishment failures.
Using the buttons just above the charts, you can edit the timespan from which the data shown in the charts is pulled from and the granularity of how that data is plotted. Timespan options range from showing the previous hour of data to the previous 7 days of data and granularity options range from plotting every minute to plotting every 12 hours.
Note
Configuring large timespans with small granularities can result in too much data being requested and the charts will be left blank. For example, this will happen if a timespan of 7 days and a granularity of 1 minute is chosen.
You can select individual dashboard panes to open an expanded view where you can specify details such as the graph's time range and time granularity. You can also create additional dashboards using the platform metrics available. For detailed information on interacting with the Azure Monitor graphics, see Get started with metrics explorer.
Tip
You can also find the Packet Core Control Plane resource under Network functions on the Site resource.
Export metrics using the Azure Monitor REST API
In addition to the monitoring functionalities offered by the Azure portal, you can export Azure Private 5G Core metrics for analysis with other tools using the Azure Monitor REST API. Once this data is retrieved, you may want to save it in a separate data store that allows longer data retention, or use your tools of choice to monitor and analyze your deployment. For example, you can export the platform metrics to data storage and processing services such as Azure Monitor Log Analytics, Azure Storage, or Azure Event Hubs.
Note
Exporting metrics to another application for analysis or storage may incur extra costs. Check the pricing information for the applications you want to use.
See Supported metrics with Azure Monitor for the AP5GC metrics available for retrieval. AP5GC metrics are included under microsoft.mobilenetwork/packetcorecontrolplanes and microsoft.mobilenetwork/packetcorecontrolplanes/packetcoredataplanes. You can find more information on using the Azure Monitor REST API to construct queries and retrieve metrics at Azure monitoring REST API walkthrough.
Next steps
Feedback
Coming soon: Throughout 2024 we will be phasing out GitHub Issues as the feedback mechanism for content and replacing it with a new feedback system. For more information see: https://aka.ms/ContentUserFeedback.
Submit and view feedback for