Use Logstash to stream logs with HTTP Data Collection API (legacy)
Important
Data ingestion using the Logstash output plugin is currently in public preview. This feature is provided without a service level agreement, and it's not recommended for production workloads. For more information, see Supplemental Terms of Use for Microsoft Azure Previews.
Note
A newer version of the Logstash plugin can forward logs from external data sources into custom and standard tables using the DCR based API. The new plugin allows full control over the output schema, including the configuration of the column names and types.
Using Microsoft Sentinel's output plugin for the Logstash data collection engine, you can send any type of log you want through Logstash directly to your Log Analytics workspace in Microsoft Sentinel. Your logs will be sent to a custom table that you define using the output plugin. This version of the plugin uses the HTTP Data Collection API.
To learn more about working with the Logstash data collection engine, see Getting started with Logstash.
Overview
Architecture and background

The Logstash engine is comprised of three components:
- Input plugins: Customized collection of data from various sources.
- Filter plugins: Manipulation and normalization of data according to specified criteria.
- Output plugins: Customized sending of collected and processed data to various destinations.
Note
Microsoft supports only the Microsoft Sentinel-provided Logstash output plugin discussed here. The current version of this plugin is v1.0.0, released 2020-08-25. You can open a support ticket for any issues regarding the output plugin.
Microsoft does not support third-party Logstash output plugins for Microsoft Sentinel, or any other Logstash plugin or component of any type.
Microsoft Sentinel's Logstash output plugin supports only Logstash versions 7.0 to 7.17.10, and versions 8.0 to 8.9 and 8.11. If you use Logstash 8, we recommended that you disable ECS in the pipeline.
The Microsoft Sentinel output plugin for Logstash sends JSON-formatted data to your Log Analytics workspace, using the Log Analytics HTTP Data Collector REST API. The data is ingested into custom logs.
- Learn more about the Log Analytics REST API.
- Learn more about custom logs.
Deploy the Microsoft Sentinel output plugin in Logstash
Step 1: Installation
The Microsoft Sentinel output plugin is available in the Logstash collection.
Follow the instructions in the Logstash Working with plugins document to install the microsoft-logstash-output-azure-loganalytics plugin.
If your Logstash system does not have Internet access, follow the instructions in the Logstash Offline Plugin Management document to prepare and use an offline plugin pack. (This will require you to build another Logstash system with Internet access.)
Step 2: Configuration
Use the information in the Logstash Structure of a config file document and add the Microsoft Sentinel output plugin to the configuration with the following keys and values. (The proper config file syntax is shown after the table.)
| Field name | Data type | Description |
|---|---|---|
workspace_id |
string | Enter your workspace ID GUID (see Tip). |
workspace_key |
string | Enter your workspace primary key GUID (see Tip). |
custom_log_table_name |
string | Set the name of the table into which the logs will be ingested. Only one table name per output plugin can be configured. The log table will appear in Microsoft Sentinel under Logs, in Tables in the Custom Logs category, with a _CL suffix. |
endpoint |
string | Optional field. By default, this is the Log Analytics endpoint. Use this field to set an alternative endpoint. |
time_generated_field |
string | Optional field. This property overrides the default TimeGenerated field in Log Analytics. Enter the name of the timestamp field in the data source. The data in the field must conform to the ISO 8601 format (YYYY-MM-DDThh:mm:ssZ) |
key_names |
array | Enter a list of Log Analytics output schema fields. Each list item should be enclosed in single quotes and the items separated by commas, and the entire list enclosed in square brackets. See example below. |
plugin_flush_interval |
number | Optional field. Set to define the maximum interval (in seconds) between message transmissions to Log Analytics. The default is 5. |
amount_resizing |
boolean | True or false. Enable or disable the automatic scaling mechanism, which adjusts the message buffer size according to the volume of log data received. |
max_items |
number | Optional field. Applies only if amount_resizing set to "false." Use to set a cap on the message buffer size (in records). The default is 2000. |
azure_resource_id |
string | Optional field. Defines the ID of the Azure resource where the data resides. The resource ID value is especially useful if you are using resource-context RBAC to provide access to specific data only. |
Tip
- You can find the workspace ID and primary key in the workspace resource, under Agents management.
- However, because having credentials and other sensitive information stored in cleartext in configuration files is not in line with security best practices, you are strongly encouraged to make use of the Logstash key store in order to securely include your workspace ID and workspace primary key in the configuration. See Elastic's documentation for instructions.
Sample configurations
Here are some sample configurations that use a few different options.
A basic configuration that uses a filebeat input pipe:
  input {
      beats {
          port => "5044"
      }
  }
  filter {
  }
  output {
      microsoft-logstash-output-azure-loganalytics {
        workspace_id => "<your workspace id>"
        workspace_key => "<your workspace key>"
        custom_log_table_name => "tableName"
      }
  }
A basic configuration that uses a tcp input pipe:
  input {
      tcp {
          port => "514"
          type => syslog #optional, will effect log type in table
      }
  }
  filter {
  }
  output {
      microsoft-logstash-output-azure-loganalytics {
        workspace_id => "<your workspace id>"
        workspace_key =>  "<your workspace key>"
        custom_log_table_name => "tableName"
      }
  }
An advanced configuration:
  input {
      tcp {
          port => 514
          type => syslog
      }
  }
  filter {
      grok {
          match => { "message" => "<%{NUMBER:PRI}>1 (?<TIME_TAG>[0-9]{4}-[0-9]{1,2}-[0-9]{1,2}T[0-9]{1,2}:[0-9]{1,2}:[0-9]{1,2})[^ ]* (?<HOSTNAME>[^ ]*) %{GREEDYDATA:MSG}" }
      }
  }
  output {
      microsoft-logstash-output-azure-loganalytics {
          workspace_id => "<WS_ID>"
          workspace_key => "${WS_KEY}"
          custom_log_table_name => "logstashCustomTable"
          key_names => ['PRI','TIME_TAG','HOSTNAME','MSG']
          plugin_flush_interval => 5
      }
  }
A more advanced configuration to parse a custom timestamp and a JSON string from unstructured text data and log a selected set of fields into Log Analytics with the extracted timestamp:
  # Example log line below:
  # Mon Nov 07 20:45:08 2022: { "name":"_custom_time_generated", "origin":"test_microsoft", "sender":"test@microsoft.com", "messages":1337}
  # take an input
  input {
      file {
          path => "/var/log/test.log"
      }
  }
  filter {
  # extract the header timestamp and the Json section
      grok {
          match => {
              "message" => ["^(?<timestamp>.{24}):\s(?<json_data>.*)$"]
          }
      }
  # parse the extracted header as a timestamp
  date {
      id => 'parse_metric_timestamp'
          match => [ 'timestamp', 'EEE MMM dd HH:mm:ss yyyy' ]
          timezone => 'Europe/Rome'
          target => 'custom_time_generated'
      }
  json {
      source => "json_data"
      }
  }
  # output to a file for debugging (optional)
  output {
      file {
          path => "/tmp/test.txt"
          codec => line { format => "custom format: %{message} %{custom_time_generated} %{json_data}"}
      }
  }
  # output to the console output for debugging (optional)
  output {
      stdout { codec => rubydebug }
  }
  # log into Log Analytics
  output {
      microsoft-logstash-output-azure-loganalytics {
          workspace_id => '[REDACTED]'
          workspace_key => '[REDACTED]'
          custom_log_table_name => 'RSyslogMetrics'
          time_generated_field => 'custom_time_generated'
          key_names => ['custom_time_generated','name','origin','sender','messages']
      }
  }
Note
Visit the output plugin GitHub repository to learn more about its inner workings, configuration, and performance settings.
Step 3: Restart Logstash
Step 4: View incoming logs in Microsoft Sentinel
Verify that messages are being sent to the output plugin.
From the Microsoft Sentinel navigation menu, click Logs. Under the Tables heading, expand the Custom Logs category. Find and click the name of the table you specified (with a
_CLsuffix) in the configuration.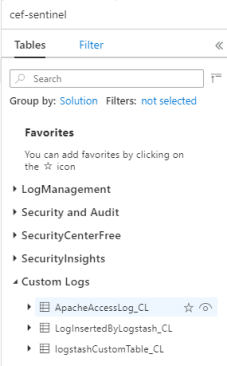
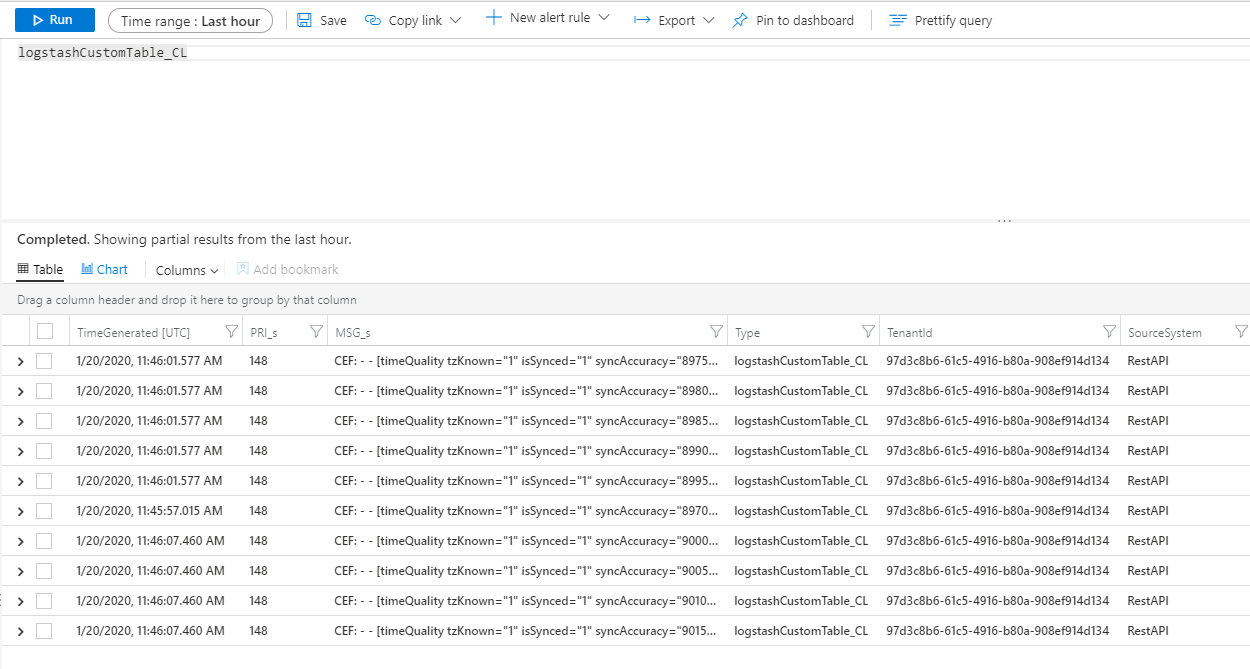
To see records in the table, query the table by using the table name as the schema.
Monitor output plugin audit logs
To monitor the connectivity and activity of the Microsoft Sentinel output plugin, enable the appropriate Logstash log file. See the Logstash Directory Layout document for the log file location.
If you are not seeing any data in this log file, generate and send some events locally (through the input and filter plugins) to make sure the output plugin is receiving data. Microsoft Sentinel will support only issues relating to the output plugin.
Next steps
In this document, you learned how to use Logstash to connect external data sources to Microsoft Sentinel. To learn more about Microsoft Sentinel, see the following articles:
- Learn how to get visibility into your data and potential threats.
- Get started detecting threats with Microsoft Sentinel, using built-in or custom rules.
Feedback
Coming soon: Throughout 2024 we will be phasing out GitHub Issues as the feedback mechanism for content and replacing it with a new feedback system. For more information see: https://aka.ms/ContentUserFeedback.
Submit and view feedback for