Turn on auditing and health monitoring for Microsoft Sentinel (preview)
Monitor the health and audit the integrity of supported Microsoft Sentinel resources by turning on the auditing and health monitoring feature in Microsoft Sentinel's Settings page. Get insights on health drifts, such as the latest failure events or changes from success to failure states, and on unauthorized actions, and use this information to create notifications and other automated actions.
To get health data from the SentinelHealth data table, or to get auditing information from the SentinelAudit data table, you must first turn on the Microsoft Sentinel auditing and health monitoring feature for your workspace.
This article instructs you how to turn on these features.
To implement the health and audit feature using API (Bicep/ARM/REST), review the Diagnostic Settings operations.
To configure the retention time for your audit and health events, see Configure data retention and archive policies in Azure Monitor Logs.
Important
The SentinelHealth and SentinelAudit data tables are currently in PREVIEW. See the Supplemental Terms of Use for Microsoft Azure Previews for additional legal terms that apply to Azure features that are in beta, preview, or otherwise not yet released into general availability.
Data tables and resource types
When the feature is turned on, the SentinelHealth and SentinelAudit data tables are created at the first event generated for the selected resources.
The following resource types are currently supported for health monitoring:
- Analytics rules (New!)
- Data connectors
- Automation rules
- Playbooks (Azure Logic Apps workflows)
Note
When monitoring playbook health, you'll also need to collect Azure Logic Apps diagnostic events from your playbooks in order to get the full picture of your playbook activity. See Monitor the health of your automation rules and playbooks for more information.
Only the analytics rule resource type is currently supported for auditing.
Turn on auditing and health monitoring for your workspace
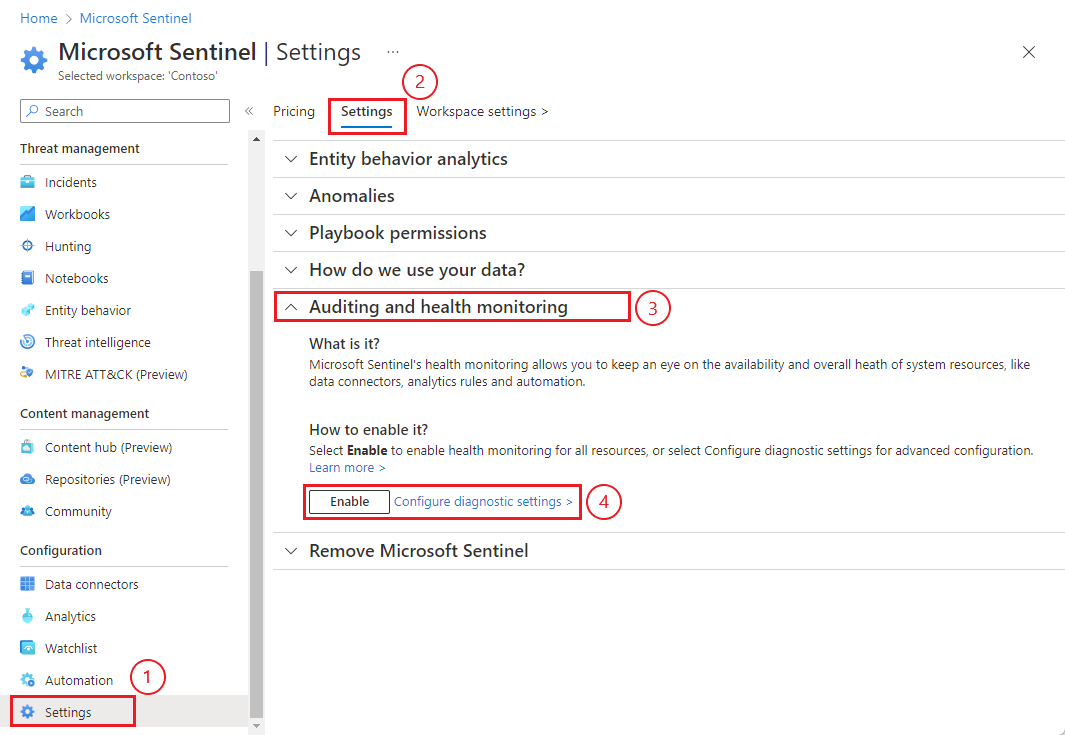
In Microsoft Sentinel, under the Configuration menu on the left, select Settings.
Select Settings from the banner.
Scroll down to the Auditing and health monitoring section that appears below, and select it to expand.
Select Enable to enable auditing and health monitoring across all resource types and to send the auditing and monitoring data to your Microsoft Sentinel workspace (and nowhere else).
Or, select the Configure diagnostic settings link to enable health monitoring only for the data collector and/or automation resources, or to configure advanced options, like additional places to send the data.
If you selected Enable, then the button will gray out and change to read Enabling... and then Enabled. At that point, auditing and health monitoring is enabled, and you're done! The appropriate diagnostic settings were added behind the scenes, and you can view and edit them by selecting the Configure diagnostic settings link.
If you selected Configure diagnostic settings, then in the Diagnostic settings screen, select + Add diagnostic setting.
(If you're editing an existing setting, select it from the list of diagnostic settings.)
In the Diagnostic setting name field, enter a meaningful name for your setting.
In the Logs column, select the appropriate Categories for the resource types you want to monitor, for example Data Collection - Connectors. Select allLogs if you want to monitor analytics rules.
Under Destination details, select Send to Log Analytics workspace, and select your Subscription and Log Analytics workspace from the dropdown menus.
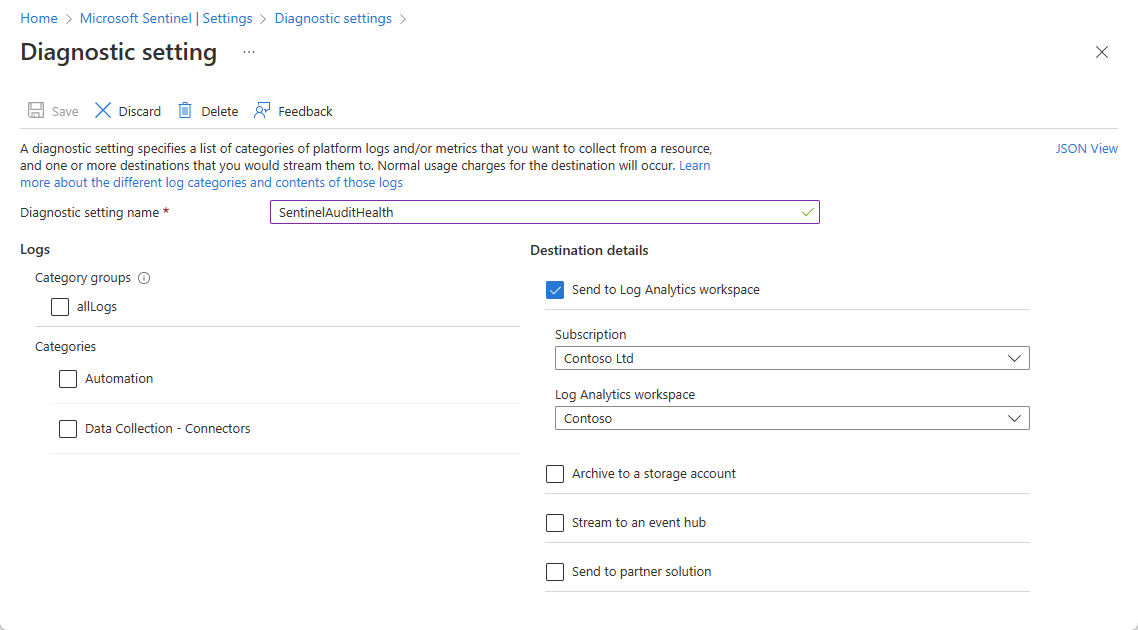
If you require, you may select other destinations to which to send your data, in addition to the Log Analytics workspace.
Select Save on the top banner to save your new setting.
The SentinelHealth and SentinelAudit data tables are created at the first event generated for the selected resources.
Verify that the tables are receiving data
In the Microsoft Sentinel Logs page, run a query on the SentinelHealth table. For example:
_SentinelHealth()
 | take 20
Next steps
- Learn about auditing and health monitoring in Microsoft Sentinel.
- Monitor the health of your automation rules and playbooks.
- Monitor the health of your data connectors.
- Monitor the health and integrity of your analytics rules.
- See more information about the SentinelHealth and SentinelAudit table schemas.
Feedback
Coming soon: Throughout 2024 we will be phasing out GitHub Issues as the feedback mechanism for content and replacing it with a new feedback system. For more information see: https://aka.ms/ContentUserFeedback.
Submit and view feedback for