Understand threat intelligence in Microsoft Sentinel
Microsoft Sentinel is a cloud native Security Information and Event Management (SIEM) solution with the ability to quickly pull threat intelligence from numerous sources.
Important
Microsoft Sentinel is available as part of the public preview for the unified security operations platform in the Microsoft Defender portal. For more information, see Microsoft Sentinel in the Microsoft Defender portal.
Introduction to threat intelligence
Cyber threat intelligence (CTI) is information describing existing or potential threats to systems and users. This intelligence takes many forms, from written reports detailing a particular threat actor's motivations, infrastructure, and techniques, to specific observations of IP addresses, domains, file hashes, and other artifacts associated with known cyber threats. CTI is used by organizations to provide essential context to unusual activity, so security personnel can quickly take action to protect their people, information, and assets. CTI can be sourced from many places, such as open-source data feeds, threat intelligence-sharing communities, commercial intelligence feeds, and local intelligence gathered in the course of security investigations within an organization.
For SIEM solutions like Microsoft Sentinel, the most common forms of CTI are threat indicators, also known as Indicators of Compromise (IoC) or Indicators of Attack (IoA). Threat indicators are data that associate observed artifacts such as URLs, file hashes, or IP addresses with known threat activity such as phishing, botnets, or malware. This form of threat intelligence is often called tactical threat intelligence because it's applied to security products and automation in large scale to detect potential threats to an organization and protect against them. Use threat indicators in Microsoft Sentinel, to detect malicious activity observed in your environment and provide context to security investigators to inform response decisions.
Integrate threat intelligence (TI) into Microsoft Sentinel through the following activities:
Import threat intelligence into Microsoft Sentinel by enabling data connectors to various TI platforms and feeds.
View and manage the imported threat intelligence in Logs and in the Threat Intelligence blade of Microsoft Sentinel.
Detect threats and generate security alerts and incidents using the built-in Analytics rule templates based on your imported threat intelligence.
Visualize key information about your imported threat intelligence in Microsoft Sentinel with the Threat Intelligence workbook.
Microsoft enriches all imported threat intelligence indicators with GeoLocation and WhoIs data, which is displayed together with other indicator details.
Threat Intelligence also provides useful context within other Microsoft Sentinel experiences such as Hunting and Notebooks. For more information, see Jupyter Notebooks in Microsoft Sentinel and Tutorial: Get started with Jupyter notebooks and MSTICPy in Microsoft Sentinel.
Note
For information about feature availability in US Government clouds, see the Microsoft Sentinel tables in Cloud feature availability for US Government customers.
Import threat intelligence with data connectors
Just like all the other event data in Microsoft Sentinel, threat indicators are imported using data connectors. Here are the data connectors in Microsoft Sentinel provided specifically for threat indicators.
- Microsoft Defender Threat Intelligence data connector to ingest Microsoft's threat indicators
- Threat Intelligence - TAXII for industry-standard STIX/TAXII feeds and
- Threat Intelligence upload indicators API for integrated and curated TI feeds using a REST API to connect
- Threat Intelligence Platform data connector also connects TI feeds using a REST API, but is on the path for deprecation
Use any of these data connectors in any combination together, depending on where your organization sources threat indicators. All three of these are available in Content hub as part of the Threat Intelligence solution. For more information about this solution, see the Azure Marketplace entry Threat Intelligence.
Also, see this catalog of threat intelligence integrations available with Microsoft Sentinel.
Add threat indicators to Microsoft Sentinel with the Microsoft Defender Threat Intelligence data connector
Bring high fidelity indicators of compromise (IOC) generated by Microsoft Defender Threat Intelligence (MDTI) into your Microsoft Sentinel workspace. The MDTI data connector ingests these IOCs with a simple one-click setup. Then monitor, alert and hunt based on the threat intelligence in the same way you utilize other feeds.
For more information on MDTI data connector, see Enable MDTI data connector.
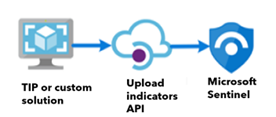
Add threat indicators to Microsoft Sentinel with the Threat Intelligence Upload Indicators API data connector
Many organizations use threat intelligence platform (TIP) solutions to aggregate threat indicator feeds from various sources. From the aggregated feed, the data is curated to apply to security solutions such as network devices, EDR/XDR solutions, or SIEMs such as Microsoft Sentinel. The Threat Intelligence Upload Indicators API data connector allows you to use these solutions to import threat indicators into Microsoft Sentinel.
This data connector utilizes a new API and offers the following improvements:
- The threat indicator fields are based off of the STIX standardized format.
- The Microsoft Entra application only requires Microsoft Sentinel Contributor role.
- The API request endpoint is scoped at the workspace level and the Microsoft Entra application permissions required allow granular assignment at the workspace level.
For more information, see Connect your threat intelligence platform using upload indicators API
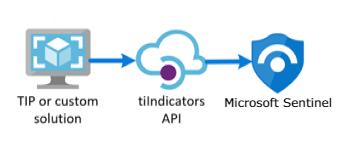
Add threat indicators to Microsoft Sentinel with the Threat Intelligence Platforms data connector
Much like the existing upload indicators API data connector, the Threat Intelligence Platform data connector uses an API allowing your TIP or custom solution to send indicators into Microsoft Sentinel. However, this data connector is now on a path for deprecation. We recommend new solutions to take advantage of the optimizations the upload indicators API has to offer.
The TIP data connector works with the Microsoft Graph Security tiIndicators API. It can also be used by any custom threat intelligence platform that communicates with the tiIndicators API to send indicators to Microsoft Sentinel (and to other Microsoft security solutions like Microsoft Defender XDR).
For more information on the TIP solutions integrated with Microsoft Sentinel, see Integrated threat intelligence platform products. For more information, see Connect your threat intelligence platform to Microsoft Sentinel.
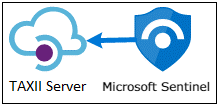
Add threat indicators to Microsoft Sentinel with the Threat Intelligence - TAXII data connector
The most widely adopted industry standard for the transmission of threat intelligence is a combination of the STIX data format and the TAXII protocol. If your organization obtains threat indicators from solutions that support the current STIX/TAXII version (2.0 or 2.1), use the Threat Intelligence - TAXII data connector to bring your threat indicators into Microsoft Sentinel. The Threat Intelligence - TAXII data connector enables a built-in TAXII client in Microsoft Sentinel to import threat intelligence from TAXII 2.x servers.
To import STIX-formatted threat indicators to Microsoft Sentinel from a TAXII server:
Obtain the TAXII server API Root and Collection ID
Enable the Threat Intelligence - TAXII data connector in Microsoft Sentinel
For more information, see Connect Microsoft Sentinel to STIX/TAXII threat intelligence feeds.
View and manage your threat indicators
View and manage your indicators in the Threat Intelligence page. Sort, filter, and search your imported threat indicators without even writing a Log Analytics query. This feature also allows you to create threat indicators directly within the Microsoft Sentinel interface, as well as perform two of the most common threat intelligence administrative tasks: indicator tagging and creating new indicators related to security investigations.
Tagging threat indicators is an easy way to group them together to make them easier to find. Typically, you might apply a tag to indicators related to a particular incident, or to those representing threats from a particular known actor or well-known attack campaign. Tag threat indicators individually, or multi-select indicators and tag them all at once. Here is an example screenshot of tagging multiple indicators with an incident ID. Since tagging is free-form, a recommended practice is to create standard naming conventions for threat indicator tags. Indicators allow applying multiple tags.

Validate your indicators and view your successfully imported threat indicators from the Microsoft Sentinel enabled log analytics workspace. The ThreatIntelligenceIndicator table under the Microsoft Sentinel schema is where all your Microsoft Sentinel threat indicators are stored. This table is the basis for threat intelligence queries performed by other Microsoft Sentinel features such as Analytics and Workbooks.
Here is an example view of a basic query for threat indicators.

TI indicators are ingested into the ThreatIntelligenceIndicator table of your log analytics workspace as read-only. Anytime an indicator is updated, a new entry in the ThreatIntelligenceIndicator table is created. Only the most current indicator is displayed in the Threat Intelligence page however. Microsoft Sentinel de-duplicates indicators based on the IndicatorId and SourceSystem properties and chooses the indicator with the newest TimeGenerated[UTC].
The IndicatorId property is generated using the STIX indicator ID. When indicators are imported or created from non-STIX sources, the IndicatorId is generated by the Source and Pattern of the indicator.
For more details on viewing and managing your threat indicators, see Work with threat indicators in Microsoft Sentinel.
View your GeoLocation and WhoIs data enrichments (Public preview)
Microsoft enriches IP and domain indicators with extra GeoLocation and WhoIs data, providing more context for investigations where the selected indicator of compromise (IOC) is found.
View GeoLocation and WhoIs data on the Threat Intelligence pane for those types of threat indicators imported into Microsoft Sentinel.
For example, use GeoLocation data to find details like Organization or Country for an IP indicator, and WhoIs data to find data like Registrar and Record creation data from a domain indicator.
Detect threats with threat indicator analytics
The most important use case for threat indicators in SIEM solutions like Microsoft Sentinel is to power analytics rules for threat detection. These indicator-based rules compare raw events from your data sources against your threat indicators to detect security threats in your organization. In Microsoft Sentinel Analytics, you create analytics rules that run on a schedule and generate security alerts. The rules are driven by queries, along with configurations that determine how often the rule should run, what kind of query results should generate security alerts and incidents, and optionally trigger an automated response.
While you can always create new analytics rules from scratch, Microsoft Sentinel provides a set of built-in rule templates, created by Microsoft security engineers, to leverage your threat indicators. These built-in rule templates are based on the type of threat indicators (domain, email, file hash, IP address, or URL) and data source events you want to match. Each template lists the required sources needed for the rule to function. This makes it easy to determine if the necessary events are already imported in Microsoft Sentinel.
By default, when these built-in rules are triggered, an alert will be created. In Microsoft Sentinel, the alerts generated from analytics rules also generate security incidents which can be found in Incidents under Threat Management on the Microsoft Sentinel menu. Incidents are what your security operations teams will triage and investigate to determine the appropriate response actions. Find detailed information in this Tutorial: Investigate incidents with Microsoft Sentinel.
For more details on using threat indicators in your analytics rules, see Use threat intelligence to detect threats.
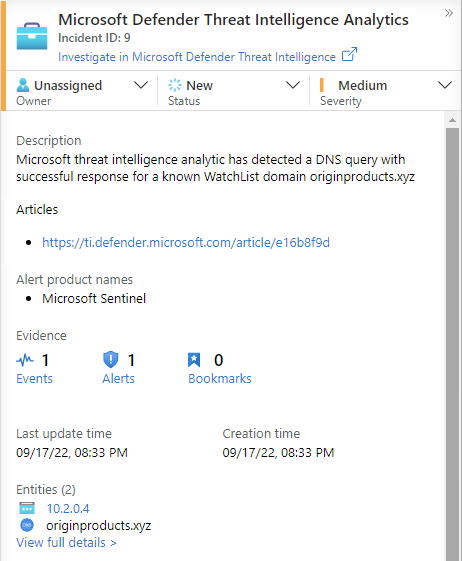
Microsoft provides access to its threat intelligence through the Microsoft Defender Threat Intelligence Analytics rule. For more information on how to take advantage of this rule which generates high fidelity alerts and incidents, see Use matching analytics to detect threats
Workbooks provide insights about your threat intelligence
Workbooks provide powerful interactive dashboards that give you insights into all aspects of Microsoft Sentinel, and threat intelligence is no exception. Use the built-in Threat Intelligence workbook to visualize key information about your threat intelligence, and easily customize the workbook according to your business needs. Create new dashboards combining many different data sources so to visualize your data in unique ways. Since Microsoft Sentinel workbooks are based on Azure Monitor workbooks, there is already extensive documentation available, and many more templates. A great place to start is this article on how to Create interactive reports with Azure Monitor workbooks.
There is also a rich community of Azure Monitor workbooks on GitHub to download additional templates and contribute your own templates.
For more details on using and customizing the Threat Intelligence workbook, see Work with threat indicators in Microsoft Sentinel.
Next steps
In this document, you learned about the threat intelligence capabilities of Microsoft Sentinel, including the Threat Intelligence blade. For practical guidance on using Microsoft Sentinel's threat intelligence capabilities, see the following articles:
- Connect Microsoft Sentinel to STIX/TAXII threat intelligence feeds.
- Connect threat intelligence platforms to Microsoft Sentinel.
- See which TIP platforms, TAXII feeds, and enrichments can be readily integrated with Microsoft Sentinel.
- Work with threat indicators throughout the Microsoft Sentinel experience.
- Detect threats with built-in or custom analytics rules in Microsoft Sentinel
- Investigate incidents in Microsoft Sentinel.
Feedback
Coming soon: Throughout 2024 we will be phasing out GitHub Issues as the feedback mechanism for content and replacing it with a new feedback system. For more information see: https://aka.ms/ContentUserFeedback.
Submit and view feedback for