Azure Stream Analytics job metrics
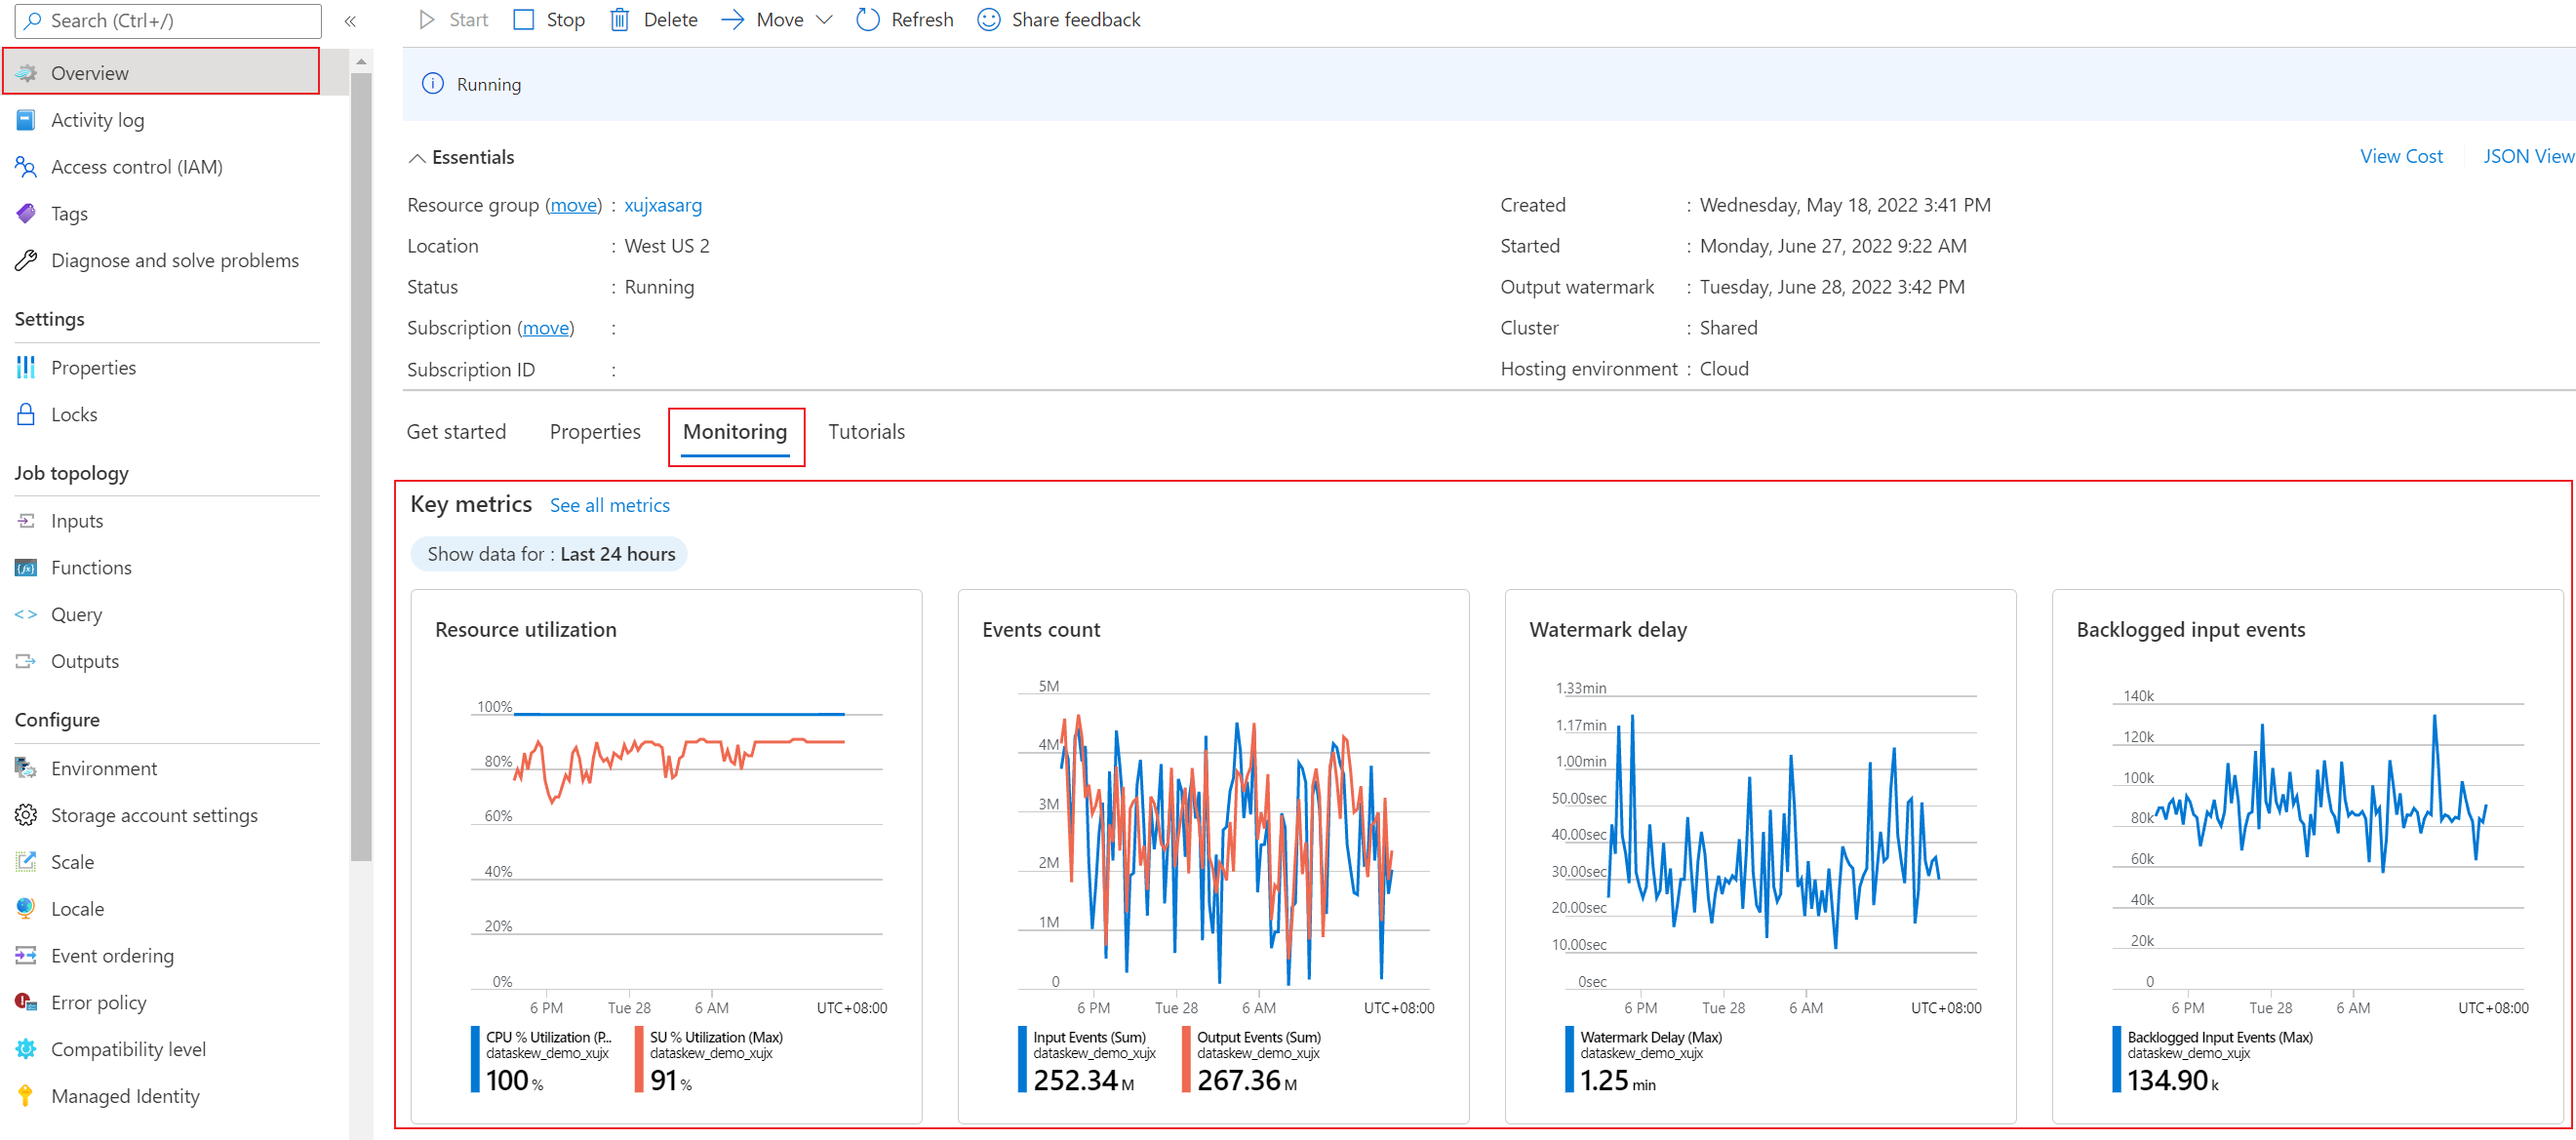
Azure Stream Analytics provides plenty of metrics that you can use to monitor and troubleshoot your query and job performance. You can view data from these metrics on the Overview page of the Azure portal, in the Monitoring section.
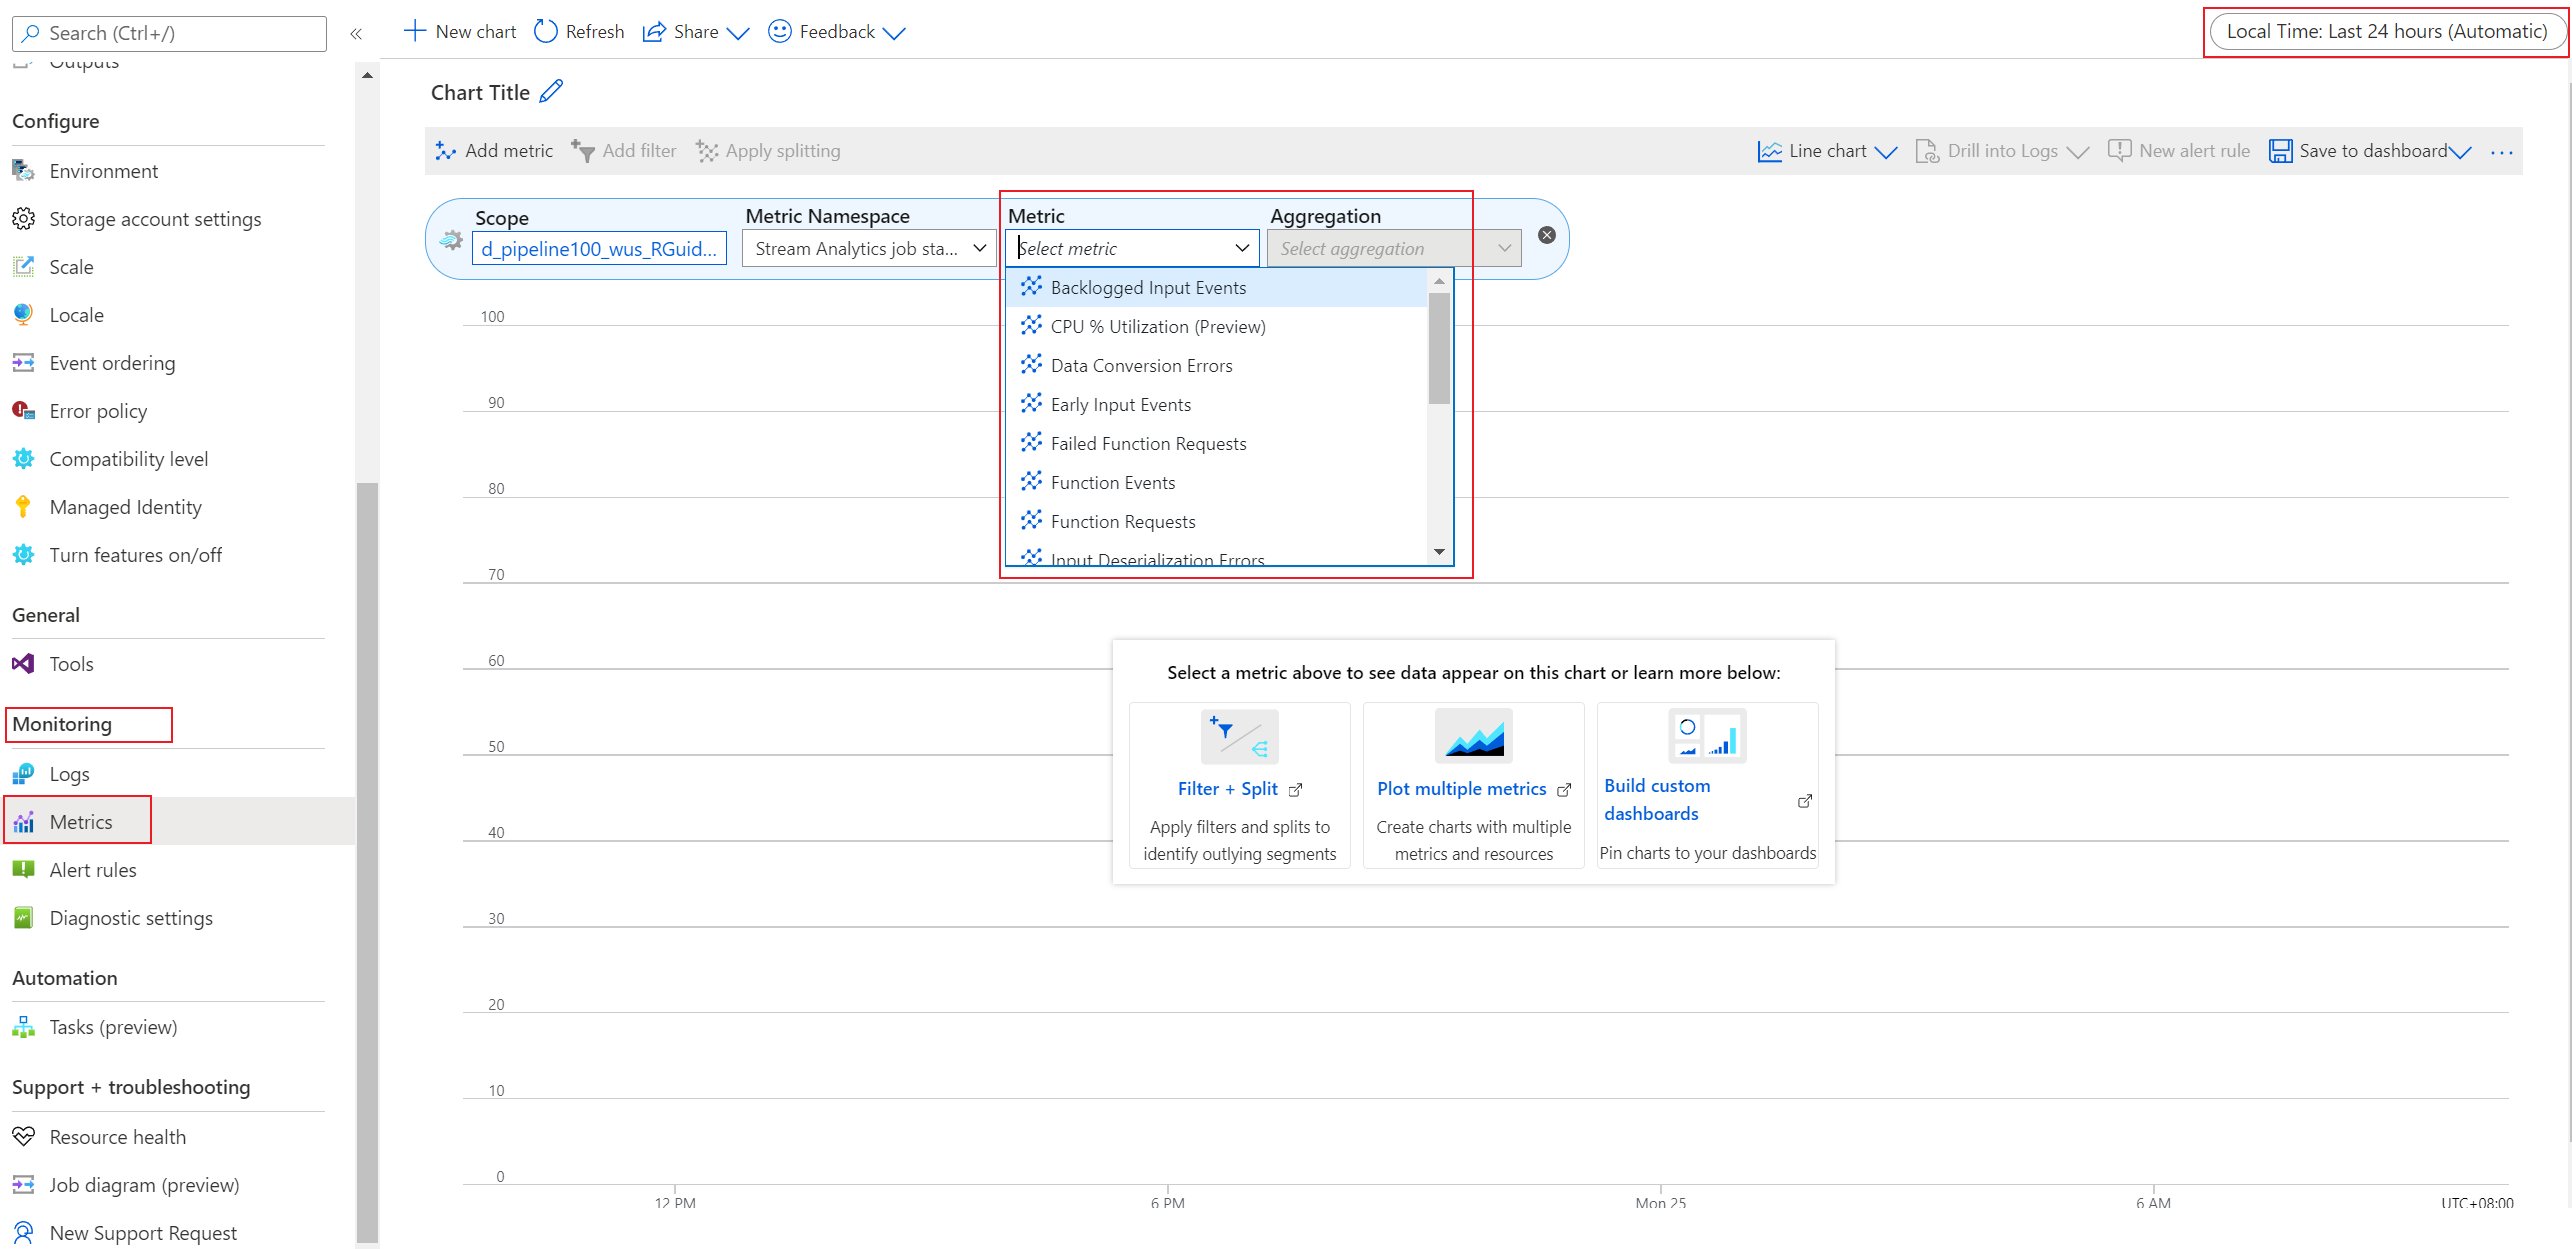
If you want to check a specific metric, select Metrics in the Monitoring section. On the page that appears, select the metric.
Metrics available for Stream Analytics
Azure Stream Analytics provides the following metrics for you to monitor your job's health.
| Metric | Definition |
|---|---|
| Backlogged Input Events | Number of input events that are backlogged. A nonzero value for this metric implies that your job can't keep up with the number of incoming events. If this value is slowly increasing or is consistently nonzero, you should scale out your job. To learn more, see Understand and adjust streaming units. |
| Data Conversion Errors | Number of output events that couldn't be converted to the expected output schema. To drop events that encounter this scenario, you can change the error policy to Drop. |
| CPU % Utilization (preview) | Percentage of CPU that your job utilizes. Even if this value is very high (90 percent or more), you shouldn't increase the number of SUs based on this metric alone. If the number of backlogged input events or watermark delays increases, you can then use this metric to determine if the CPU is the bottleneck. This metric might have intermittent spikes. We recommend that you do scale tests to determine the upper bound of your job after which inputs are backlogged or watermark delays increase because of a CPU bottleneck. |
| Early Input Events | Events whose application time stamp is earlier than their arrival time by more than 5 minutes. |
| Failed Function Requests | Number of failed Azure Machine Learning function calls (if present). |
| Function Events | Number of events sent to the Azure Machine Learning function (if present). |
| Function Requests | Number of calls to the Azure Machine Learning function (if present). |
| Input Deserialization Errors | Number of input events that couldn't be deserialized. |
| Input Event Bytes | Amount of data that the Stream Analytics job receives, in bytes. You can use this metric to validate that events are being sent to the input source. |
| Input Events | Number of records deserialized from the input events. This count doesn't include incoming events that result in deserialization errors. Stream Analytics can ingest the same events multiple times in scenarios like internal recoveries and self-joins. Don't expect Input Events and Output Events metrics to match if your job has a simple pass-through query. |
| Input Sources Received | Number of messages that the job receives. For Azure Event Hubs, a message is a single EventData item. For Azure Blob Storage, a message is a single blob. Note that input sources are counted before deserialization. If there are deserialization errors, input sources can be greater than input events. Otherwise, input sources can be less than or equal to input events because each message can contain multiple events. |
| Late Input Events | Events that arrived later than the configured tolerance window for late arrivals. Learn more about Azure Stream Analytics event order considerations. |
| Out-of-Order Events | Number of events received out of order that were either dropped or given an adjusted time stamp, based on the event ordering policy. This metric can be affected by the configuration of the Out-of-Order Tolerance Window setting. |
| Output Events | Amount of data that the Stream Analytics job sends to the output target, in number of events. |
| Runtime Errors | Total number of errors related to query processing. It excludes errors found while ingesting events or outputting results. |
| SU (Memory) % Utilization | Percentage of memory that your job utilizes. If this metric is consistently over 80 percent, the watermark delay is rising, and the number of backlogged events is rising, consider increasing streaming units (SUs). High utilization indicates that the job is using close to the maximum allocated resources. |
| Watermark Delay | Maximum watermark delay across all partitions of all outputs in the job. |
Scenarios to monitor
Azure Stream Analytics provides a serverless, distributed streaming processing service. Jobs can run on one or more distributed streaming nodes, which the service automatically manages. The input data is partitioned and allocated to different streaming nodes for processing.
| Metric | Condition | Time aggregation | Threshold | Corrective actions |
|---|---|---|---|---|
| SU (Memory) % Utilization | Greater than | Average | 80 | Multiple factors increase the utilization of SUs. You can scale with query parallelization or increase the number of SUs. For more information, see Leverage query parallelization in Azure Stream Analytics. |
| CPU % Utilization | Greater than | Average | 90 | This likely means that some operations (such as user-defined functions, user-defined aggregates, or complex input deserialization) are requiring a lot of CPU cycles. You can usually overcome this problem by increasing the number of SUs for the job. |
| Runtime Errors | Greater than | Total | 0 | Examine the activity or resource logs and make appropriate changes to the inputs, query, or outputs. |
| Watermark Delay | Greater than | Average | When the average value of this metric over the last 15 minutes is greater than the late arrival tolerance (in seconds). If you haven't modified the late arrival tolerance, the default is set to 5 seconds. | Try increasing the number of SUs or parallelizing your query. For more information on SUs, see Understand and adjust streaming units. For more information on parallelizing your query, see Leverage query parallelization in Azure Stream Analytics. |
| Input Deserialization Errors | Greater than | Total | 0 | Examine the activity or resource logs and make appropriate changes to the input. For more information on resource logs, see Troubleshoot Azure Stream Analytics by using resource logs. |
Get help
For further assistance, try the Microsoft Q&A page for Azure Stream Analytics.
Next steps
Feedback
Coming soon: Throughout 2024 we will be phasing out GitHub Issues as the feedback mechanism for content and replacing it with a new feedback system. For more information see: https://aka.ms/ContentUserFeedback.
Submit and view feedback for

