Deploy the Azure Virtual Desktop (classic) diagnostics tool
Important
This content applies to Azure Virtual Desktop (classic), which doesn't support Azure Resource Manager Azure Virtual Desktop objects.
Here's what the diagnostics tool for Azure Virtual Desktop can do for you:
- Look up diagnostic activities (management, connection, or feed) for a single user over a period of one week.
- Gather session host information for connection activities from your Log Analytics workspace.
- Review virtual machine (VM) performance details for a particular host.
- See which users are signed in to the session host.
- Send message to active users on a specific session host.
- Sign users out of a session host.
Prerequisites
You need to create a Microsoft Entra App Registration and a Log Analytics workspace before you can deploy the Azure Resource Manager template for the tool. You or the administrator need these permissions to do that:
- Owner of the Azure subscription
- Permission to create resources in your Azure subscription
- Permission to create a Microsoft Entra app
- RDS Owner or Contributor rights
You also need to install these two PowerShell modules before you get started:
Make sure you have your Subscription ID ready for when you sign in.
After you have everything in order, you can create the Microsoft Entra app registration.
Create a Microsoft Entra app registration
This section will show you how to use PowerShell to create the Microsoft Entra app with a service principal and get API permissions for it.
Note
The API permissions are Azure Virtual Desktop, Log Analytics and Microsoft Graph API permissions are added to the Microsoft Entra Application.
- Open PowerShell as an Administrator.
- Sign in to Azure with an account that has Owner or Contributor permissions on the Azure subscription you would like to use for the diagnostics tool:
Login-AzAccount - Sign in to Microsoft Entra ID with the same account:
Connect-AzureAD - Go to the RDS-Templates GitHub repo and run the CreateADAppRegistrationforDiagnostics.ps1 script in PowerShell.
- When the script asks you to name your app, enter a unique app name.
Note
Azure AD and MSOnline PowerShell modules are deprecated as of March 30, 2024. To learn more, read the deprecation update. After this date, support for these modules are limited to migration assistance to Microsoft Graph PowerShell SDK and security fixes. The deprecated modules will continue to function through March, 30 2025.
We recommend migrating to Microsoft Graph PowerShell to interact with Microsoft Entra ID (formerly Azure AD). For common migration questions, refer to the Migration FAQ. Note: Versions 1.0.x of MSOnline may experience disruption after June 30, 2024.
After the script successfully runs, it should show the following things in its output:
- A message that confirms your app now has a service principal role assignment.
- Your Client ID and Client Secret Key that you'll need for when you deploy the diagnostics tool.
Now that you've registered your app, it's time to configure your Log Analytics workspace.
Configure your Log Analytics workspace
For the best possible experience, we recommend you configure your Log Analytics workspace with the following performance counters that allow you to derive statements of the user experience in a remote session. For a list of recommended counters with suggested thresholds, see Windows performance counter thresholds.
Create an Azure Log Analytics workspace using PowerShell
You can run a PowerShell script to create a Log Analytics workspace and configure the recommended Windows performance counters to monitor user experience and app performance.
Note
If you already have an existing Log Analytics workspace that you made without the PowerShell script that you want to use, skip ahead to Validate the script results in the Azure portal.
To run the PowerShell script:
Open PowerShell as an admin.
Go to the RDS-Templates GitHub repo and run the CreateLogAnalyticsWorkspaceforDiagnostics.ps1 script in PowerShell.
Enter the following values for the parameters:
- For ResourceGroupName, enter the name for the resource group.
- For LogAnalyticsWorkspaceName, enter a unique name for your Log Analytics workspace.
- For Location, enter the Azure region you're using.
- Enter the Azure Subscription ID, which you can find in the Azure portal under Subscriptions.
Enter the credentials of a user with delegated admin access.
Sign in to the Azure portal with the same user's credentials.
Write down or memorize the LogAnalyticsWorkspace ID for later.
If you set up the Log Analytics workspace with the PowerShell script, then your performance counters should already be configured and you can skip ahead to Validate the script results in the Azure portal. Otherwise, continue to the next section.
Configure Windows performance counters in your existing Log Analytics workspace
This section is for users who want to use an existing Azure Log Analytics workspace created without the PowerShell script in the previous section. If you haven't used the script, then you must configure the recommended Windows performance counters manually.
Here's how to manually configure the recommended performance counters:
Open your internet browser and sign in to the Azure portal with your administrative account.
Next, go to Log Analytics workspaces to review the configured Windows Performance Counters.
In the Settings section, select Advanced settings.
After that, navigate to Data > Windows Performance Counters and add the following counters:
- LogicalDisk(*)\%Free Space
- LogicalDisk(C:)\Avg. Disk Queue Length
- Memory(*)\Available Mbytes
- Processor Information(*)\Processor Time
- User Input Delay per Session(*)\Max Input Delay
Learn more about the performance counters at Windows and Linux performance data sources in Azure Monitor.
Note
Any additional counters you configure won't show up in the diagnostics tool itself. To make it appear in the diagnostics tool, you need to configure the tool's config file. Instructions for how to do this with advanced administration will be available in GitHub at a later date.
Validate the script results in the Azure portal
Before you continue deploying the diagnostics tool, we recommend that you verify that your Microsoft Entra application has API permissions and your Log Analytics workspace has the preconfigured Windows performance counters.
Review your app registration
To make sure your app registration has API permissions:
- Open a browser and sign in to the Azure portal with your administrative account.
- Go to Microsoft Entra ID.
- Go to App registrations and select All Applications.
- Look for your Microsoft Entra app registration with the same app name you entered in step 5 of Create a Microsoft Entra app registration.
- On your Azure subscription, check that app registration has been assigned the Contributor role assignment.
Review your Log Analytics workspace
To make sure your Log Analytics workspace has the preconfigured Windows performance counters:
In the Azure portal, go to Log Analytics workspaces to review the configured Windows Performance Counters.
Under Settings, select Advanced settings.
After that, go to Data > Windows Performance Counters.
Make sure the following counters are preconfigured:
- LogicalDisk(*)\%Free Space: Displays the amount of free space of the total usable space on the disk as a percentage.
- LogicalDisk(C:)\Avg. Disk Queue Length: The length of disk transfer request for your C drive. The value shouldn't exceed 2 for more than a short period of time.
- Memory(*)\Available Mbytes: The available memory for the system in megabytes.
- Processor Information(*)\Processor Time: the percentage of elapsed time that the processor spends to execute a non-Idle thread.
- User Input Delay per Session(*)\Max Input Delay
Connect to VMs in your Log Analytics workspace
In order to be able to view the health of VMs, you'll need to enable the Log Analytics connection. Follow these steps to connect your VMs:
- Open a browser and sign in to the Azure portal with your administrative account.
- Go to your Log Analytics Workspace.
- In the left panel, under Workspace Data Sources, select virtual machines.
- Select the name of the VM you want to connect to.
- Select Connect.
Deploy the diagnostics tool
To deploy the Azure Resource Management template for the diagnostics tool:
Go to the GitHub Azure RDS-Templates page.
Deploy the template to Azure and follow the instructions in the template. Make sure you have the following information available:
- Client-Id
- Client-Secret
- Log Analytics workspace ID
Once the input parameters are provided, accept the terms and conditions, then select Purchase.
The deployment will take 2–3 minutes. After successful deployment, go to the resource group and make sure the web app and app service plan resources are there.
After that, you need to set the Redirect URI.
Set the Redirect URI
To set the Redirect URI:
In the Azure portal, go to App Services and locate the application you created.
Go to the overview page and copy the URL you find there.
Navigate to app registrations and select the app you want to deploy.
In the left panel, under Manage section, select Authentication.
Enter the desired Redirect URI into the Redirect URI text box, then select Save in the top-left corner of the menu.
Select Web in the drop-down menu under Type.
Enter the URL from the app overview page and add /security/signin-callback to the end of it. For example:
https://<yourappname>.azurewebsites.net/security/signin-callback.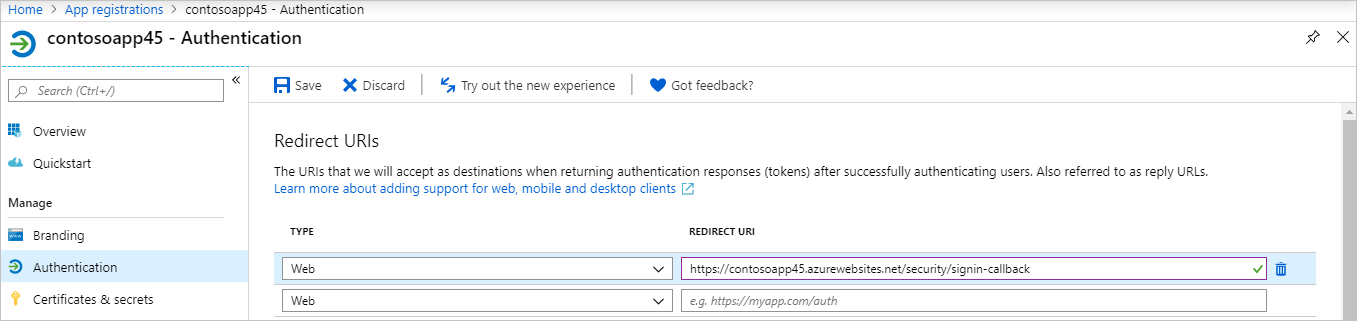
Now, go to your Azure resources, select the Azure App Services resource with the name you provided in the template and navigate to the URL associated with it. (For example, if the app name you used in the template was
contosoapp45, then your associated URL ishttp://contoso.azurewebsites.net).Sign in using the appropriate Microsoft Entra user account.
Select Accept.
Distribute the diagnostics tool
Before you make the diagnostics tool available to your users, make sure they have the following permissions:
- Users need read access for log analytics. For more information, see Get started with roles, permissions, and security with Azure Monitor.
- Users also need read access for the Azure Virtual Desktop tenant (RDS Reader role). For more information, see Delegated access in Azure Virtual Desktop.
You also need to give your users the following information:
- The app's URL
- The names of the tenant group individual tenant they can access.
Use the diagnostics tool
After you've signed in to your account using the information you've received from your organization, have the UPN ready for the user you want to query activities for. A search will give you all activities under the specified activity type that happened within the last week.
How to read activity search results
Activities are sorted by timestamp, with the latest activity first. If the results return an error, first check to see if it's a service error. For service errors, create a support ticket with the activity information to help us debug the issue. All other error types can usually be solved by the user or administrator. For a list of the most common error scenarios and how to solve them, see Identify and diagnose issues.
Note
Service errors are called "external errors" in the linked documentation. This will be changed when we update the PowerShell reference.
Connection activities might have more than one error. You can expand the activity type to see any other errors the user has come across. Select the name of the error code to open up a dialog to see more information about it.
Investigate the session host
In the search results, find and select the session host you want information about.
You can analyze session host health:
- Based on a predefined threshold, you can retrieve the session host health information that Log Analytics queries.
- When there's no activity or the session host isn't connected to Log Analytics, the information won't be available.
You can also interact with users on the session host:
- You can either sign out or send a message to signed in users.
- The user you originally searched for is selected by default, but you can also select additional users to send messages or sign out multiple users at once.
Windows performance counter thresholds
LogicalDisk(*)\%Free Space:
- Displays the percentage of the total usable space on the logical disk that is free.
- Threshold: Less than 20% is marked as unhealthy.
LogicalDisk(C:)\Avg. Disk Queue Length:
- Represents storage system conditions.
- Threshold: Higher than 5 is marked as unhealthy.
Memory(*)\Available Mbytes:
- The available memory for the system.
- Threshold: Less than 500 megabytes marked as unhealthy.
Processor Information(*)\Processor Time:
- Threshold: Higher than 80% is marked as unhealthy.
User Input Delay per Session(*)\Max Input Delay:
- Threshold: Higher than 2000 ms is marked as unhealthy.
Next steps
- Learn how to monitor activity logs at Use diagnostics with Log Analytics.
- Read about common error scenarios and how to fix them at Identify and diagnose issues.
Feedback
Coming soon: Throughout 2024 we will be phasing out GitHub Issues as the feedback mechanism for content and replacing it with a new feedback system. For more information see: https://aka.ms/ContentUserFeedback.
Submit and view feedback for