Azure Kubernetes network policies
Network policies provide micro-segmentation for pods just like Network Security Groups (NSGs) provide micro-segmentation for VMs. The Azure Network Policy Manager implementation supports the standard Kubernetes network policy specification. You can use labels to select a group of pods and define a list of ingress and egress rules to filter traffic to and from these pods. Learn more about the Kubernetes network policies in the Kubernetes documentation.
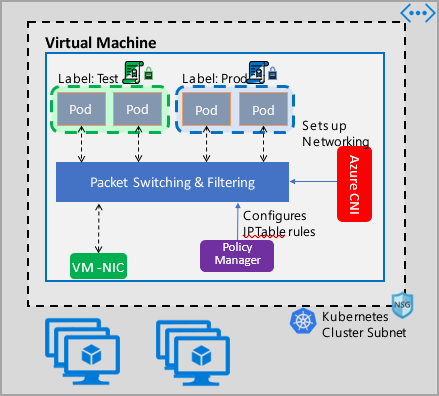
Azure Network Policy Management implementation works with the Azure CNI that provides virtual network integration for containers. Network Policy Manager is supported on Linux and Windows Server. The implementation enforces traffic filtering by configuring allow and deny IP rules based on the defined policies in Linux IPTables or Host Network Service(HNS) ACLPolicies for Windows Server.
Planning security for your Kubernetes cluster
When implementing security for your cluster, use network security groups (NSGs) to filter traffic entering and leaving your cluster subnet (North-South traffic). Use Azure Network Policy Manager for traffic between pods in your cluster (East-West traffic).
Using Azure Network Policy Manager
Azure Network Policy Manager can be used in the following ways to provide micro-segmentation for pods.
Azure Kubernetes Service (AKS)
Network Policy Manager is available natively in AKS and can be enabled at the time of cluster creation.
For more information, see Secure traffic between pods using network policies in Azure Kubernetes Service (AKS).
Do it yourself (DIY) Kubernetes clusters in Azure
For DIY clusters, first install the CNI plug-in and enable it on every virtual machine in a cluster. For detailed instructions, see Deploy the plug-in for a Kubernetes cluster that you deploy yourself.
Once the cluster is deployed run the following kubectl command to download and apply the Azure Network Policy Manager daemon set to the cluster.
For Linux:
kubectl apply -f https://raw.githubusercontent.com/Azure/azure-container-networking/master/npm/azure-npm.yaml
For Windows:
kubectl apply -f https://raw.githubusercontent.com/Azure/azure-container-networking/master/npm/examples/windows/azure-npm.yaml
The solution is also open source and the code is available on the Azure Container Networking repository.
Monitor and visualize network configurations with Azure NPM
Azure Network Policy Manager includes informative Prometheus metrics that allow you to monitor and better understand your configurations. It provides built-in visualizations in either the Azure portal or Grafana Labs. You can start collecting these metrics using either Azure Monitor or a Prometheus server.
Benefits of Azure Network Policy Manager metrics
Users previously were only able to learn about their network configuration with iptables and ipset commands run inside a cluster node, which yields a verbose and difficult to understand output.
Overall, the metrics provide:
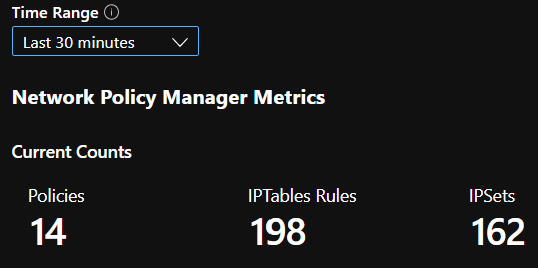
Counts of policies, ACL rules, ipsets, ipset entries, and entries in any given ipset
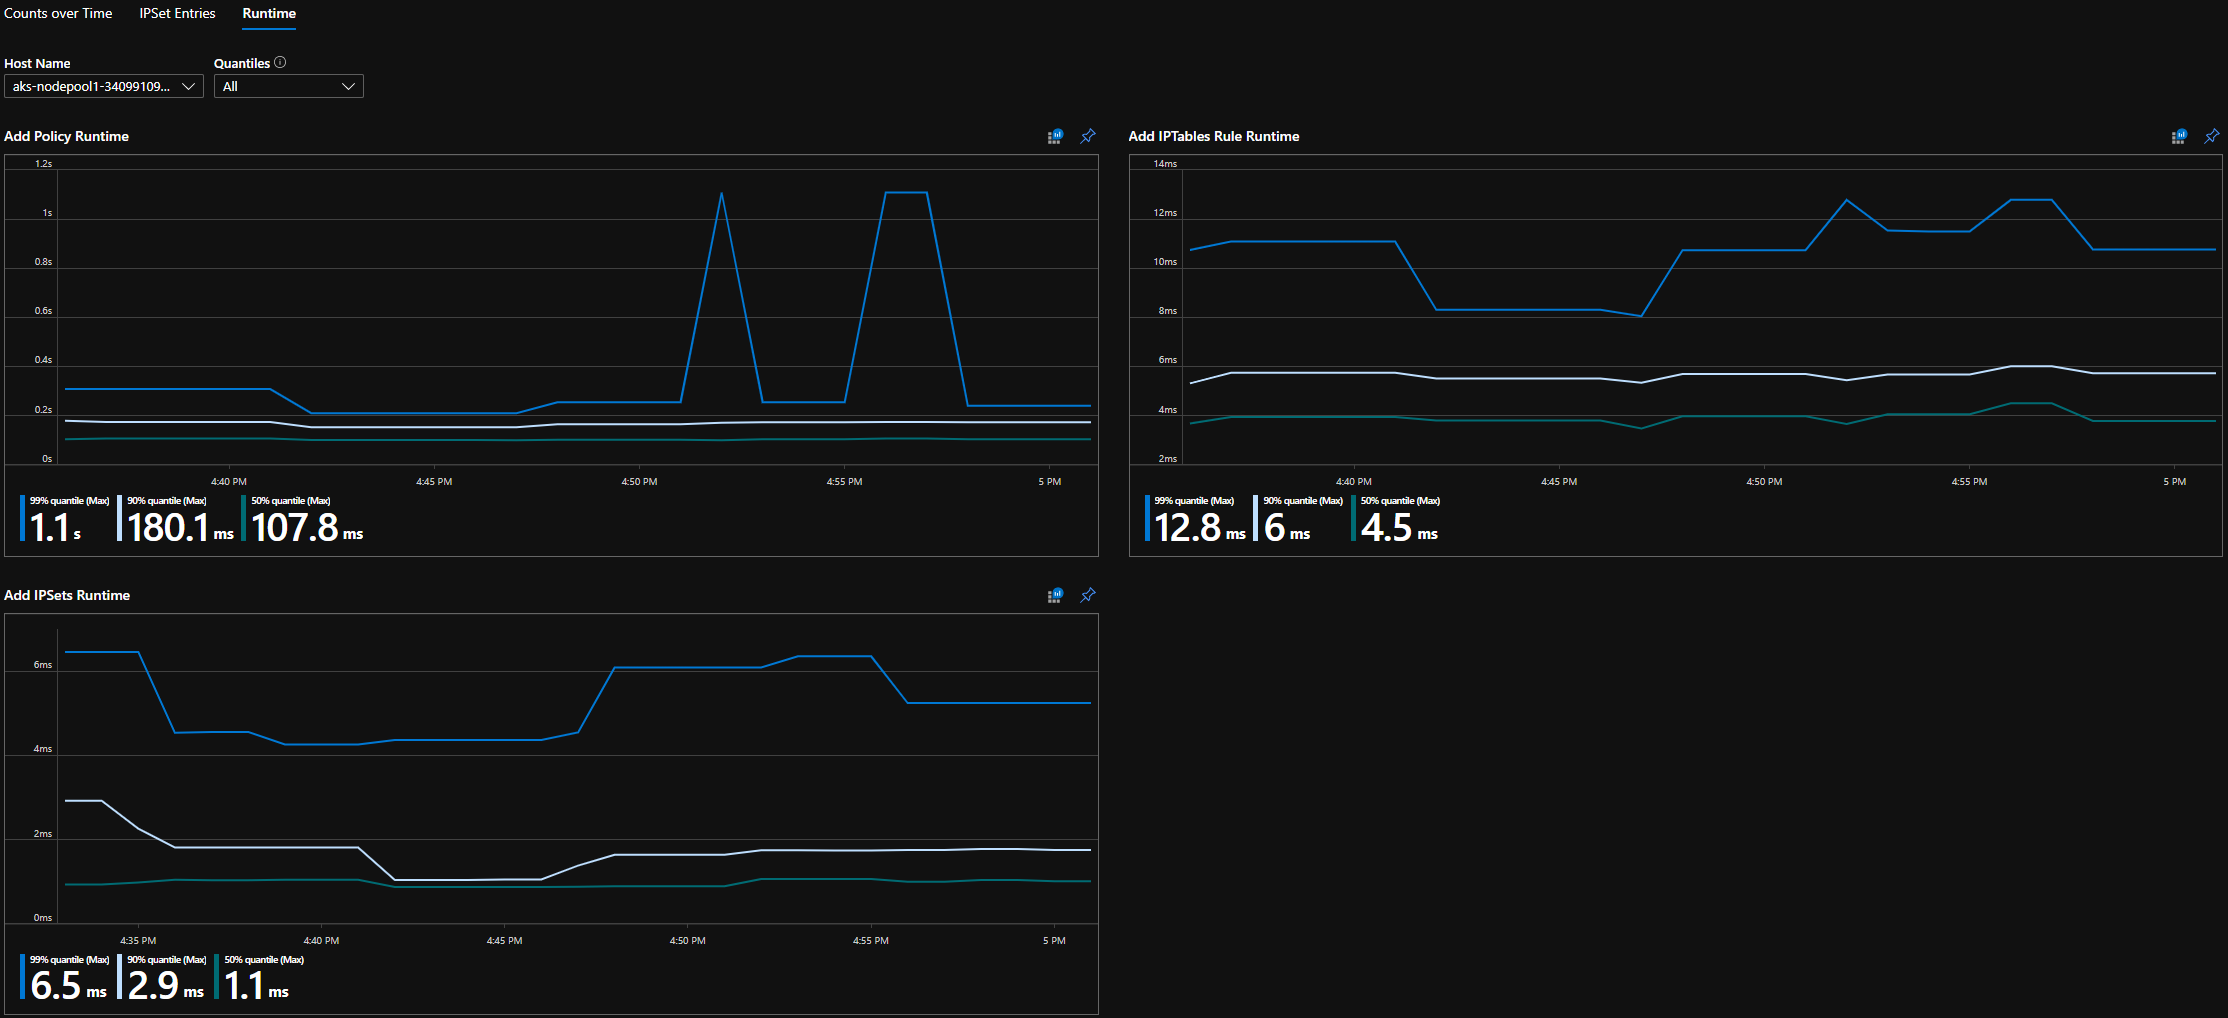
Execution times for individual OS calls and for handling kubernetes resource events (median, 90th percentile, and 99th percentile)
Failure info for handling kubernetes resource events (these resource events fail when an OS call fails)
Example metrics use cases
Alerts via a Prometheus AlertManager
See a configuration for these alerts as follows.
Alert when Network Policy Manager has a failure with an OS call or when translating a network policy.
Alert when the median time to apply changes for a create event was more than 100 milliseconds.
Visualizations and debugging via our Grafana dashboard or Azure Monitor workbook
See how many IPTables rules your policies create (having a massive number of IPTables rules may increase latency slightly).
Correlate cluster counts (for example, ACLs) to execution times.
Get the human-friendly name of an ipset in a given IPTables rule (for example,
azure-npm-487392representspodlabel-role:database).
All supported metrics
The following list is of supported metrics. Any quantile label has possible values 0.5, 0.9, and 0.99. Any had_error label has possible values false and true, representing whether the operation succeeded or failed.
| Metric Name | Description | Prometheus Metric Type | Labels |
|---|---|---|---|
npm_num_policies |
number of network policies | Gauge | - |
npm_num_iptables_rules |
number of IPTables rules | Gauge | - |
npm_num_ipsets |
number of IPSets | Gauge | - |
npm_num_ipset_entries |
number of IP address entries in all IPSets | Gauge | - |
npm_add_iptables_rule_exec_time |
runtime for adding an IPTables rule | Summary | quantile |
npm_add_ipset_exec_time |
runtime for adding an IPSet | Summary | quantile |
npm_ipset_counts (advanced) |
number of entries within each individual IPSet | GaugeVec | set_name & set_hash |
npm_add_policy_exec_time |
runtime for adding a network policy | Summary | quantile & had_error |
npm_controller_policy_exec_time |
runtime for updating/deleting a network policy | Summary | quantile & had_error & operation (with values update or delete) |
npm_controller_namespace_exec_time |
runtime for creating/updating/deleting a namespace | Summary | quantile & had_error & operation (with values create, update, or delete) |
npm_controller_pod_exec_time |
runtime for creating/updating/deleting a pod | Summary | quantile & had_error & operation (with values create, update, or delete) |
There are also "exec_time_count" and "exec_time_sum" metrics for each "exec_time" Summary metric.
The metrics can be scraped through Azure Monitor for containers or through Prometheus.
Set up for Azure Monitor
The first step is to enable Azure Monitor for containers for your Kubernetes cluster. Steps can be found in Azure Monitor for containers Overview. Once you have Azure Monitor for containers enabled, configure the Azure Monitor for containers ConfigMap to enable Network Policy Manager integration and collection of Prometheus Network Policy Manager metrics.
Azure Monitor for containers ConfigMap has an integrations section with settings to collect Network Policy Manager metrics.
These settings are disabled by default in the ConfigMap. Enablement the basic setting collect_basic_metrics = true, collects basic Network Policy Manager metrics. Enablement of the advanced setting collect_advanced_metrics = true collects advanced metrics in addition to basic metrics.
After editing the ConfigMap, save it locally and apply the ConfigMap to your cluster as follows.
kubectl apply -f container-azm-ms-agentconfig.yaml
The following snippet is from the Azure Monitor for containers ConfigMap, which shows the Network Policy Manager integration enabled with advanced metrics collection.
integrations: |-
    [integrations.azure_network_policy_manager]
        collect_basic_metrics = false
        collect_advanced_metrics = true
Advanced metrics are optional, and turning them on automatically turns on basic metrics collection. Advanced metrics currently include only Network Policy Manager_ipset_counts.
Learn more about Azure Monitor for containers collection settings in config map.
Visualization options for Azure Monitor
Once Network Policy Manager metrics collection is enabled, you can view the metrics in the Azure portal using container insights or in Grafana.
Viewing in Azure portal under insights for the cluster
Open Azure portal. Once in your cluster's insights, navigate to Workbooks and open Network Policy Manager (Network Policy Manager) Configuration.
Besides viewing the workbook, you can also directly query the Prometheus metrics in "Logs" under the insights section. For example, this query returns all the metrics being collected.
| where TimeGenerated > ago(5h)
| where Name contains "npm_"
You can also query log analytics directly for the metrics. For more information, see Getting Started with Log Analytics Queries.
Viewing in Grafana dashboard
Set up your Grafana Server and configure a log analytics data source as described here. Then, import Grafana Dashboard with a Log Analytics backend into your Grafana Labs.
The dashboard has visuals similar to the Azure Workbook. You can add panels to chart & visualize Network Policy Manager metrics from InsightsMetrics table.
Set up for Prometheus server
Some users may choose to collect metrics with a Prometheus server instead of Azure Monitor for containers. You merely need to add two jobs to your scrape config to collect Network Policy Manager metrics.
To install a Prometheus server, add this helm repo on your cluster:
helm repo add stable https://kubernetes-charts.storage.googleapis.com
helm repo update
then add a server
helm install prometheus stable/prometheus -n monitoring \
--set pushgateway.enabled=false,alertmanager.enabled=false, \
--set-file extraScrapeConfigs=prometheus-server-scrape-config.yaml
where prometheus-server-scrape-config.yaml consists of:
- job_name: "azure-npm-node-metrics"
  metrics_path: /node-metrics
  kubernetes_sd_configs:
  - role: node
  relabel_configs:
  - source_labels: [__address__]
    action: replace
    regex: ([^:]+)(?::\d+)?
    replacement: "$1:10091"
    target_label: __address__
- job_name: "azure-npm-cluster-metrics"
  metrics_path: /cluster-metrics
  kubernetes_sd_configs:
  - role: service
  relabel_configs:
  - source_labels: [__meta_kubernetes_namespace]
    regex: kube-system
    action: keep
  - source_labels: [__meta_kubernetes_service_name]
    regex: npm-metrics-cluster-service
    action: keep
# Comment from here to the end to collect advanced metrics: number of entries for each IPSet
  metric_relabel_configs:
  - source_labels: [__name__]
    regex: npm_ipset_counts
    action: drop
You can also replace the azure-npm-node-metrics job with the following content or incorporate it into a pre-existing job for Kubernetes pods:
- job_name: "azure-npm-node-metrics-from-pod-config"
  metrics_path: /node-metrics
  kubernetes_sd_configs:
  - role: pod
  relabel_configs:
  - source_labels: [__meta_kubernetes_namespace]
    regex: kube-system
    action: keep
  - source_labels: [__meta_kubernetes_pod_annotationpresent_azure_Network Policy Manager_scrapeable]
    action: keep
  - source_labels: [__address__]
    action: replace
    regex: ([^:]+)(?::\d+)?
    replacement: "$1:10091"
    target_label: __address__
Set up alerts for AlertManager
If you use a Prometheus server, you can set up an AlertManager like so. Here's an example config for the two alerting rules described previously:
groups:
- name: npm.rules
  rules:
  # fire when Network Policy Manager has a new failure with an OS call or when translating a Network Policy (suppose there's a scraping interval of 5m)
  - alert: AzureNetwork Policy ManagerFailureCreatePolicy
    # this expression says to grab the current count minus the count 5 minutes ago, or grab the current count if there was no data 5 minutes ago
    expr: (npm_add_policy_exec_time_count{had_error='true'} - (npm_add_policy_exec_time_count{had_error='true'} offset 5m)) or npm_add_policy_exec_time_count{had_error='true'}
    labels:
      severity: warning
      addon: azure-npm
    annotations:
      summary: "Azure Network Policy Manager failed to handle a policy create event"
      description: "Current failure count since Network Policy Manager started: {{ $value }}"
  # fire when the median time to apply changes for a pod create event is more than 100 milliseconds.
  - alert: AzurenpmHighControllerPodCreateTimeMedian
    expr: topk(1, npm_controller_pod_exec_time{operation="create",quantile="0.5",had_error="false"}) > 100.0
    labels:
      severity: warning
      addon: azure-Network Policy Manager
    annotations:
      summary: "Azure Network Policy Manager controller pod create time median > 100.0 ms"
      # could have a simpler description like the one for the alert above,
      # but this description includes the number of pod creates that were handled in the past 10 minutes,
      # which is the retention period for observations when calculating quantiles for a Prometheus Summary metric
      description: "value: [{{ $value }}] and observation count: [{{ printf `(npm_controller_pod_exec_time_count{operation='create',pod='%s',had_error='false'} - (npm_controller_pod_exec_time_count{operation='create',pod='%s',had_error='false'} offset 10m)) or npm_controller_pod_exec_time_count{operation='create',pod='%s',had_error='false'}` $labels.pod $labels.pod $labels.pod | query | first | value }}] for pod: [{{ $labels.pod }}]"
Visualization options for Prometheus
When you use a Prometheus Server, only Grafana dashboard is supported.
If you haven't already, set up your Grafana server and configure a Prometheus data source. Then, import our Grafana Dashboard with a Prometheus backend into your Grafana Labs.
The visuals for this dashboard are identical to the dashboard with a container insights/log analytics backend.
Sample dashboards
Following are some sample dashboard for Network Policy Manager metrics in container insights (CI) and Grafana.
CI summary counts
CI counts over time

CI IPSet entries

CI runtime quantiles
Grafana dashboard summary counts

Grafana dashboard counts over time

Grafana dashboard IPSet entries

Grafana dashboard runtime quantiles

Next steps
Learn about Azure Kubernetes Service.
Learn about container networking.
Deploy the plug-in for Kubernetes clusters or Docker containers.
Feedback
Coming soon: Throughout 2024 we will be phasing out GitHub Issues as the feedback mechanism for content and replacing it with a new feedback system. For more information see: https://aka.ms/ContentUserFeedback.
Submit and view feedback for