Improved relationship view
Important
This content is archived and is not being updated. For the latest documentation, see Microsoft Dynamics 365 product documentation. For the latest release plans, see Dynamics 365 and Microsoft Power Platform release plans.
Note
These release notes describe functionality that may not have been released yet. To see when this functionality is planned to release, please review What’s new and planned for business intelligence. Delivery timelines and projected functionality may change or may not ship (see Microsoft policy).
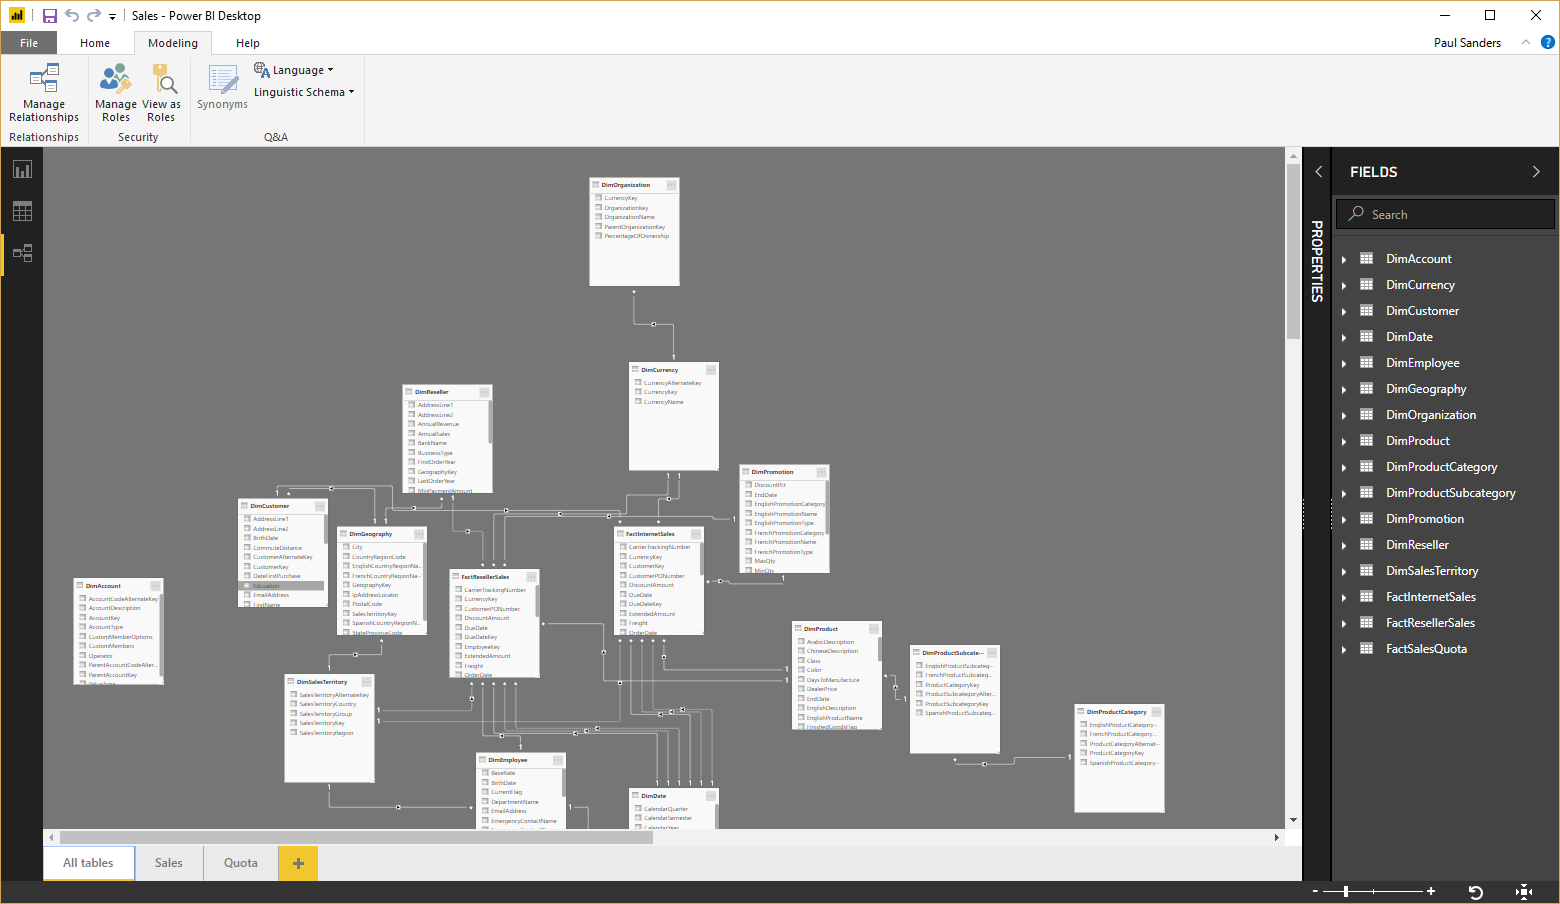
Report authors can create reports that contain dozens of tables and hundreds of fields. We will be improving the relationship view to make it easier to deal with large-scale models. As the number of tables grows, it becomes increasingly difficult to understand and maintain the network of relationships in a single diagram. The improved relationship view will allow multiple layouts to be created, each of which can show a subset of the tables, and the relationships between them. It will be possible to have separate diagrams containing just the tables that are relevant to a subject area.
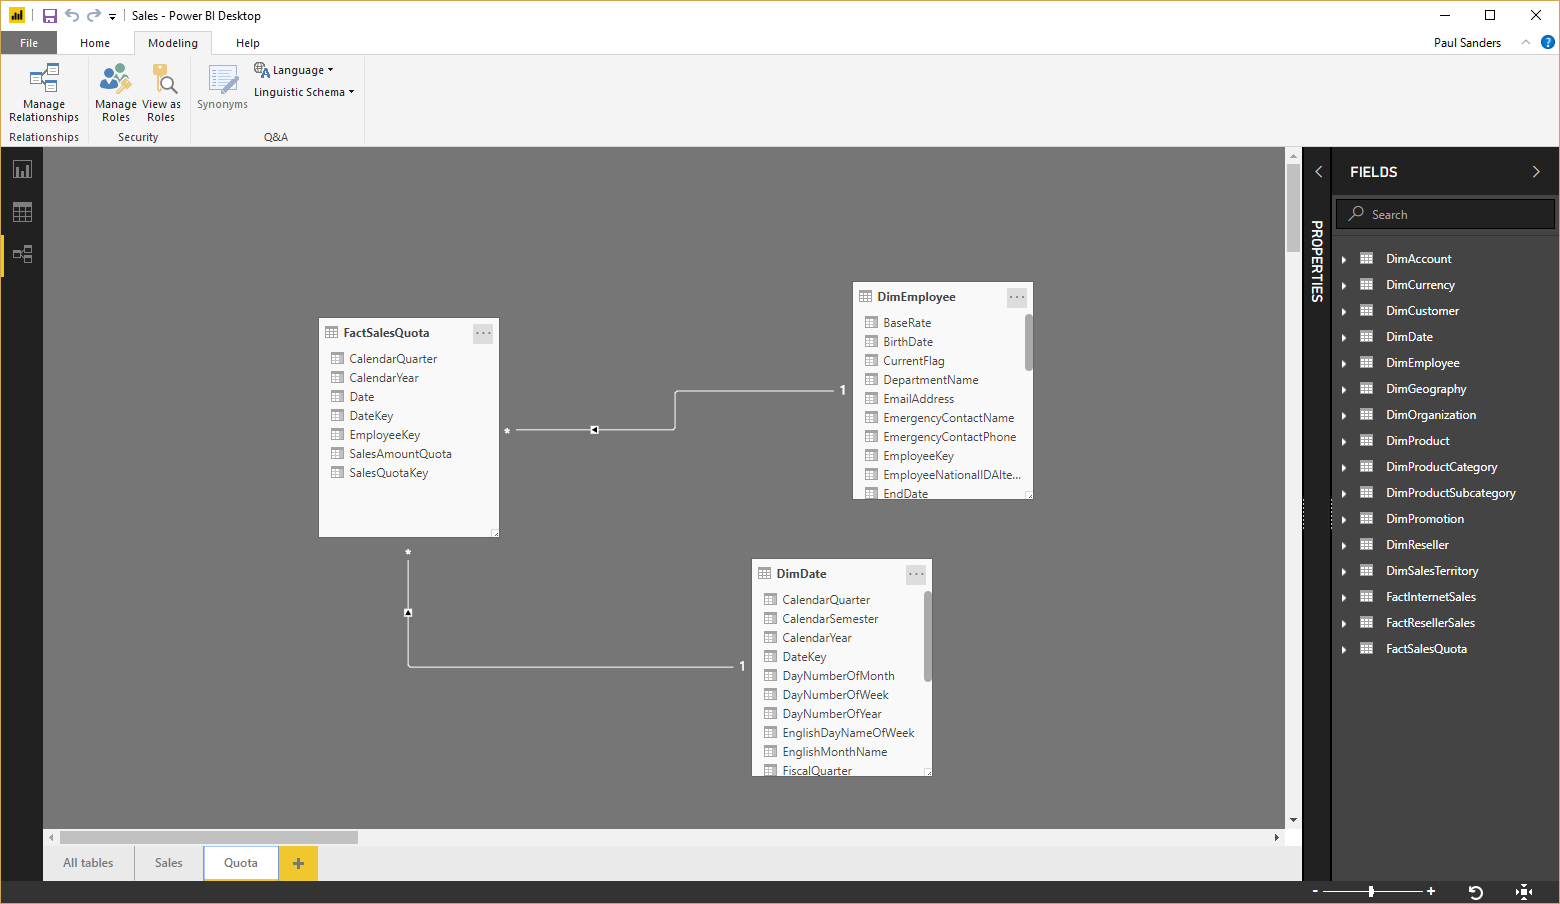
In the following example, while the main layout “All tables” includes all 16 tables in the model, the “Quota” layout includes just the three tables relevant to Quota. Tables can be added to a layout by dragging from the field list, or by including all tables that are related to a chosen table that is already included in the layout.

A model with many tables in the improved relationship view

Improved relationship view showing a subset of the tables in your model
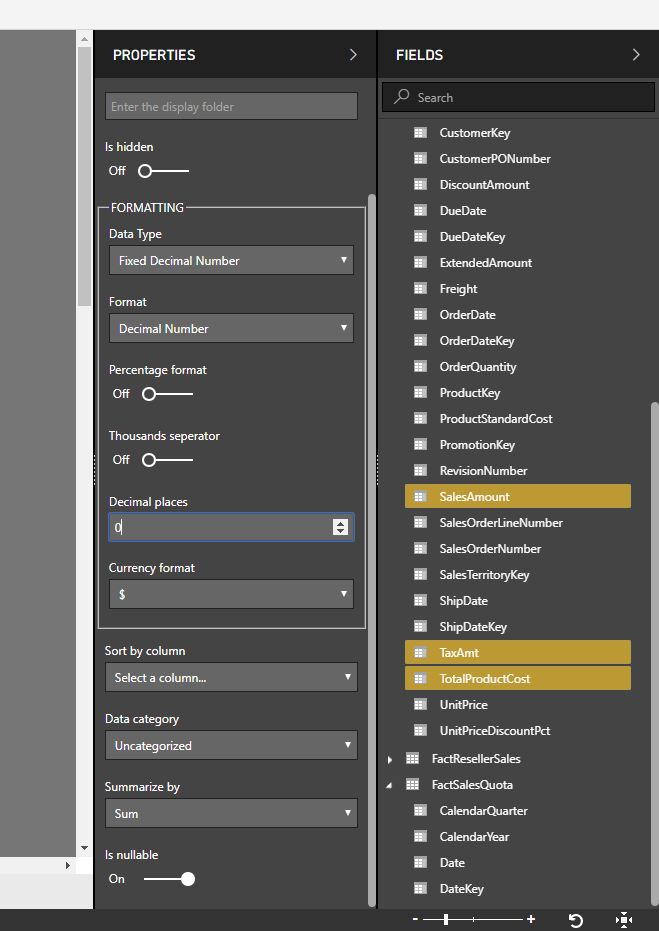
The new relationship view will also make it easier to set properties on tables and columns as the model size grows. When an object (table, column, measure, and so on) is selected in the field list, then all the properties (visibility, formatting settings, default summarization etc.) of that object will be displayed in the property pane, where the values can be changed. In addition, it will be possible to select multiple objects in the field list, and then change the value of properties for all of the selected objects, in a single edit.
In the following example, the formatting options for use of a thousand’s separator, and the number of decimal places to display, can easily be changed in one edit for the three selected fields “SalesAmount”, “TaxAmt”, and “TotalProductCost”.

Formatting of properties can easily be modified with bulk edit in the improved relationship view
It will be possible to use search to find tables and fields, as is the case for the field list in the report view.
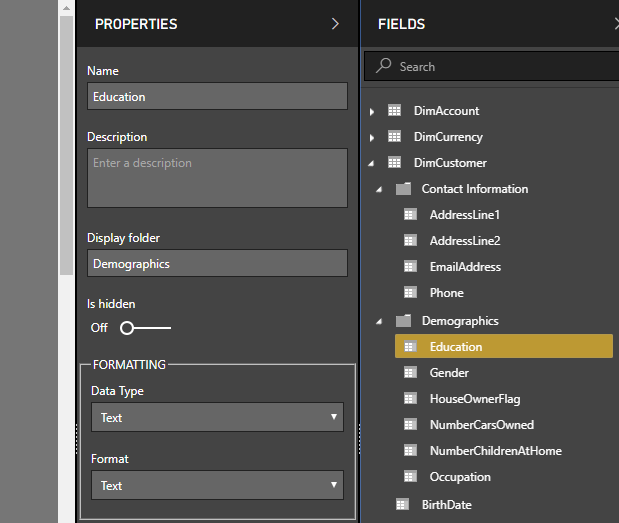
Finally, properties will include a new “Display folder” property. This allows the model author to organize fields into folders to avoid dozens of fields being presented as a single flat list. In the following example, some fields on the Customer table have been organized in folders for “Contact Information” and “Demographics”. This organization will then be used when displaying the fields, both within the Power BI Desktop and after publishing the report to the Power BI service.

Display folders can be created in Power BI Desktop
Tell us what you think
Help us improve Power BI by discussing ideas, providing suggestions, and giving feedback.
- Use the Power BI Ideas site to provide suggestions for improving the product.
- Use the feedback area (Feedback or Is this page helpful?) at the lower right of this page to provide suggestions for improving the content in release notes.