Sharing and Connectors Admin Analytics Reports (Public Preview)
Important
This content is archived and is not being updated. For the latest documentation, see Microsoft Dynamics 365 product documentation. For the latest release plans, see Dynamics 365 and Microsoft Power Platform release plans.
In late September, we announced the public preview release of Power platform Admin Analytics. In that post, we discussed a couple of upcoming reports, including sharing and connectors. Both the sharing and connectors reports now are available in Microsoft Flow Admin Analytics.
Note
The prerequisites for accessing these reports have not changed, but we are working on them. Please review the requirements in our previous post.
Both reports provide insight into how users are using Microsoft Flow within your tenant. From a sharing perspective, you are able to understand who your champions are and then figure out how you can empower them to provide even more automated solutions for your organization. The connectors report will identify Microsoft, third party, and custom connectors that are in use within your organization.
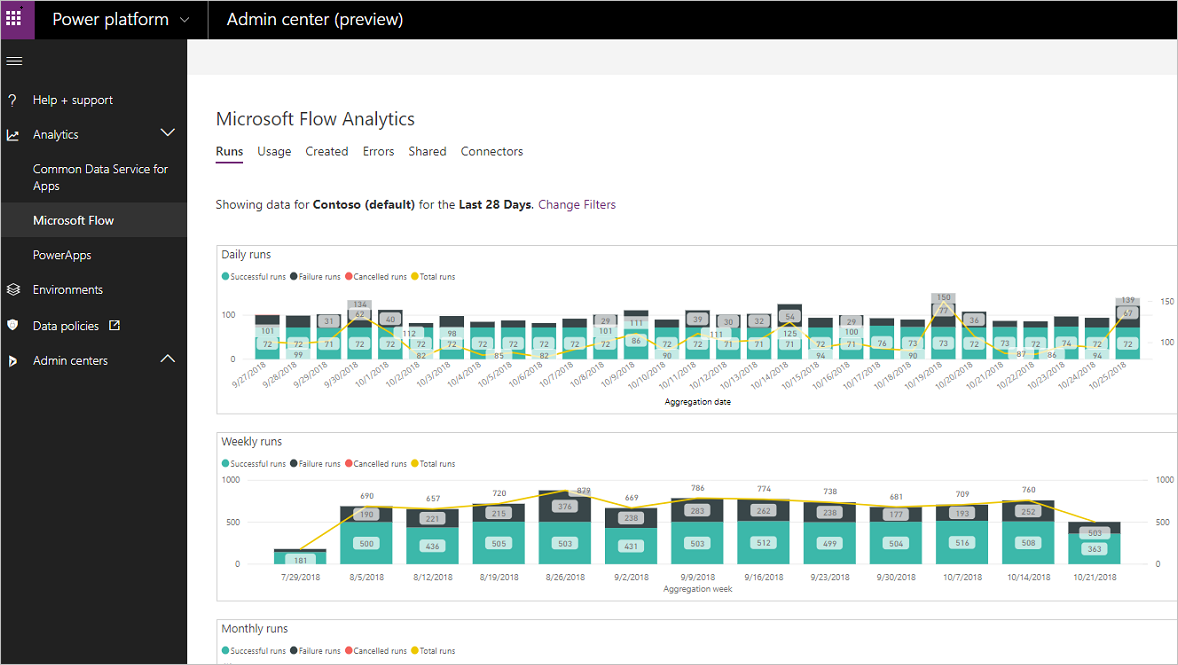
When you navigate to the Power Platform admin center, you will find an Analytics menu where you can choose to browse analytics for the Common Data Service for Apps, Microsoft Flow, and PowerApps. For the Sharing and Connectors report, select Microsoft Flow.

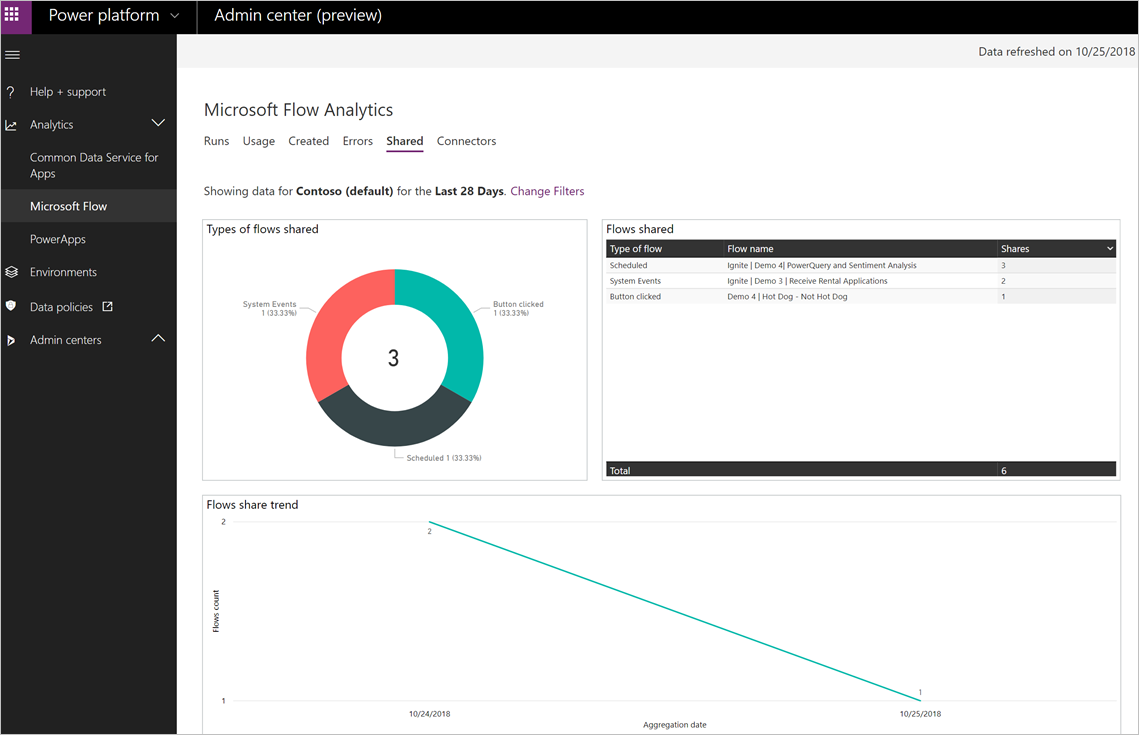
From within the Microsoft Flow Analytics feature, you can select Shared to access your sharing report. Within this report you will see three different visualizations that capture:
- The types of flows shared (System Events, Scheduled, or Button clicked).
- The name of the flow that has been shared.
- The number of shares that have taken place.
- A trendline report of these shared events.

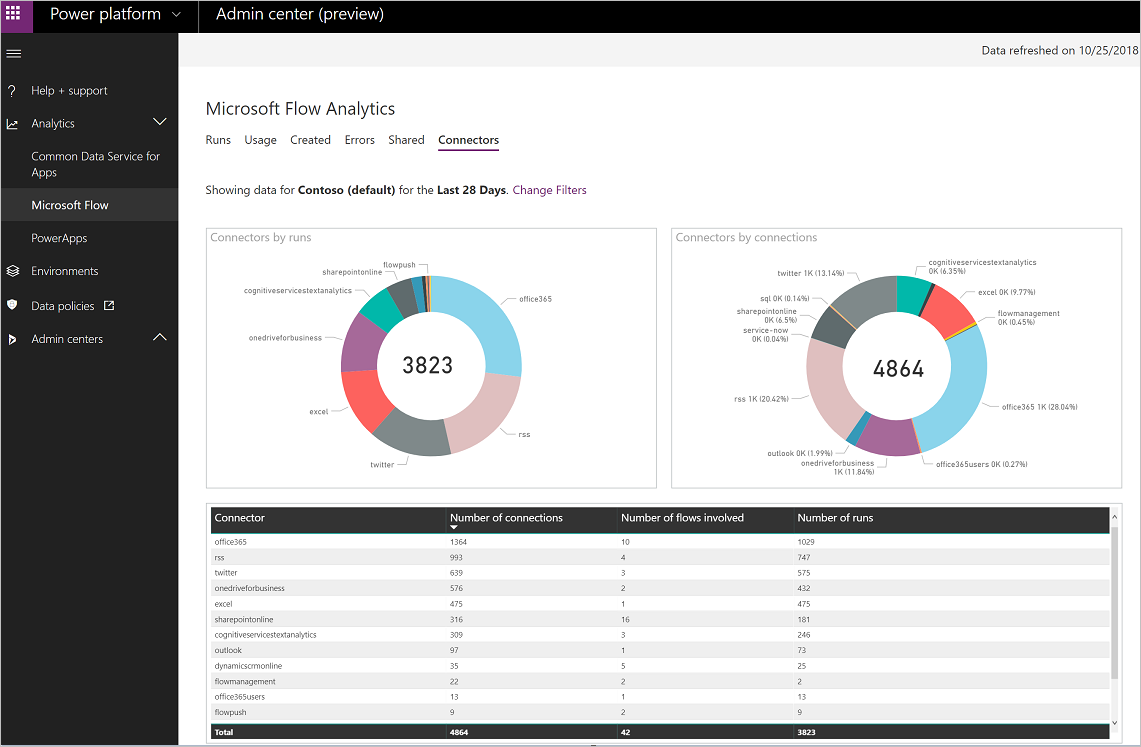
In addition to the sharing report, we have also released a report that highlights connector usage. The Connectors report provides:
Two visualizations that display connector usage by:
- Flow runs.
- Connector connections (calls to the connector).
A table visualization that lists:
- The name of connector.
- Number of connections.
- Number of flows involved.
- Number of flow runs using that connector.
