Note
Access to this page requires authorization. You can try signing in or changing directories.
Access to this page requires authorization. You can try changing directories.
After successfully linking Ads account to your Clarity project, you can start analyzing Clarity data associated with your advertising campaigns. Access the campaign details overview widget on the main Clarity Dashboard or explore a more detailed view on the Advertising Dashboard.
Campaign data widget
This card provides valuable data and insights, including a list of active and paused ads campaign per connected ad account. In addition, there are links to session recordings, heatmaps, and AI-generated insights for each campaign. Select the recordings, heatmap, or insights icons to view the corresponding data. To see more details for your campaigns on the Advertising dashboard, select View all campaign data.
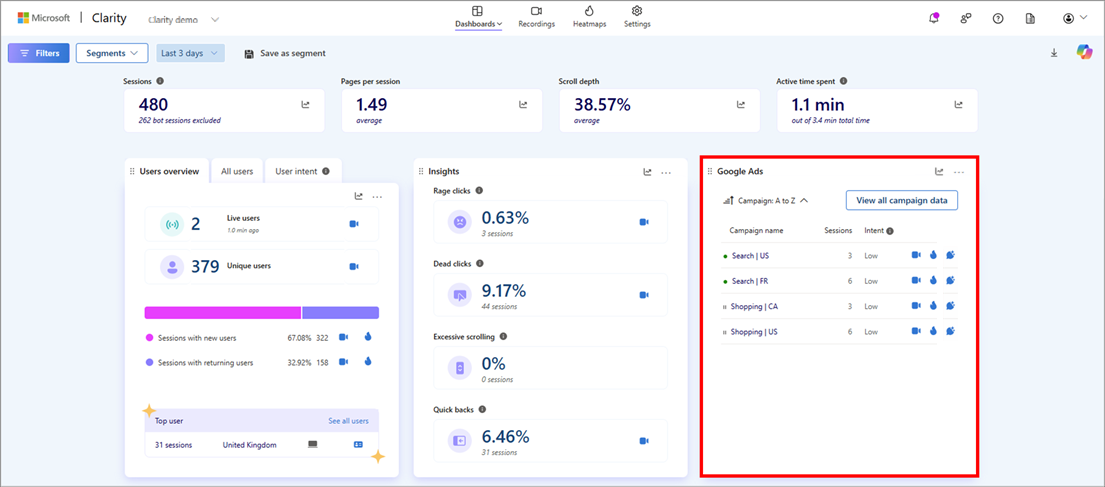
The widget also displays campaign intent, categorizing users based on their engagement levels. The intent category is determined by the highest intent percentage in a campaign, with a few exceptions:
- If High and Medium are equal, it's classified as High.
- If all levels are equal, it's classified as Medium.
- If Medium and Low are equal, it's classified as Medium.
- If High and Low are equal, it's also classified as Medium.
You can sort the data based on:
- Campaign
- Intent
- Session
Campaign detailed view
Note
- The Advertising dashboard follows the respective time zone of the connected ad account, while the Clarity dashboard uses your local time zone.
- If your ad accounts use different time zones, it can cause mismatches when comparing campaign performance across accounts or between the Advertising and Clarity dashboards. To avoid confusion, it's best to use the same time zone for all ad accounts whenever possible.
The detailed view in the Advertising Dashboard displays key ad metrics such as impressions, click-through rate (CTR), cost per click (CPC), conversion rate (CVR), and cost per acquisition (CPA). It also provides the number of Clarity sessions, campaign intent, and links to Clarity session recordings and heatmaps for each campaign.
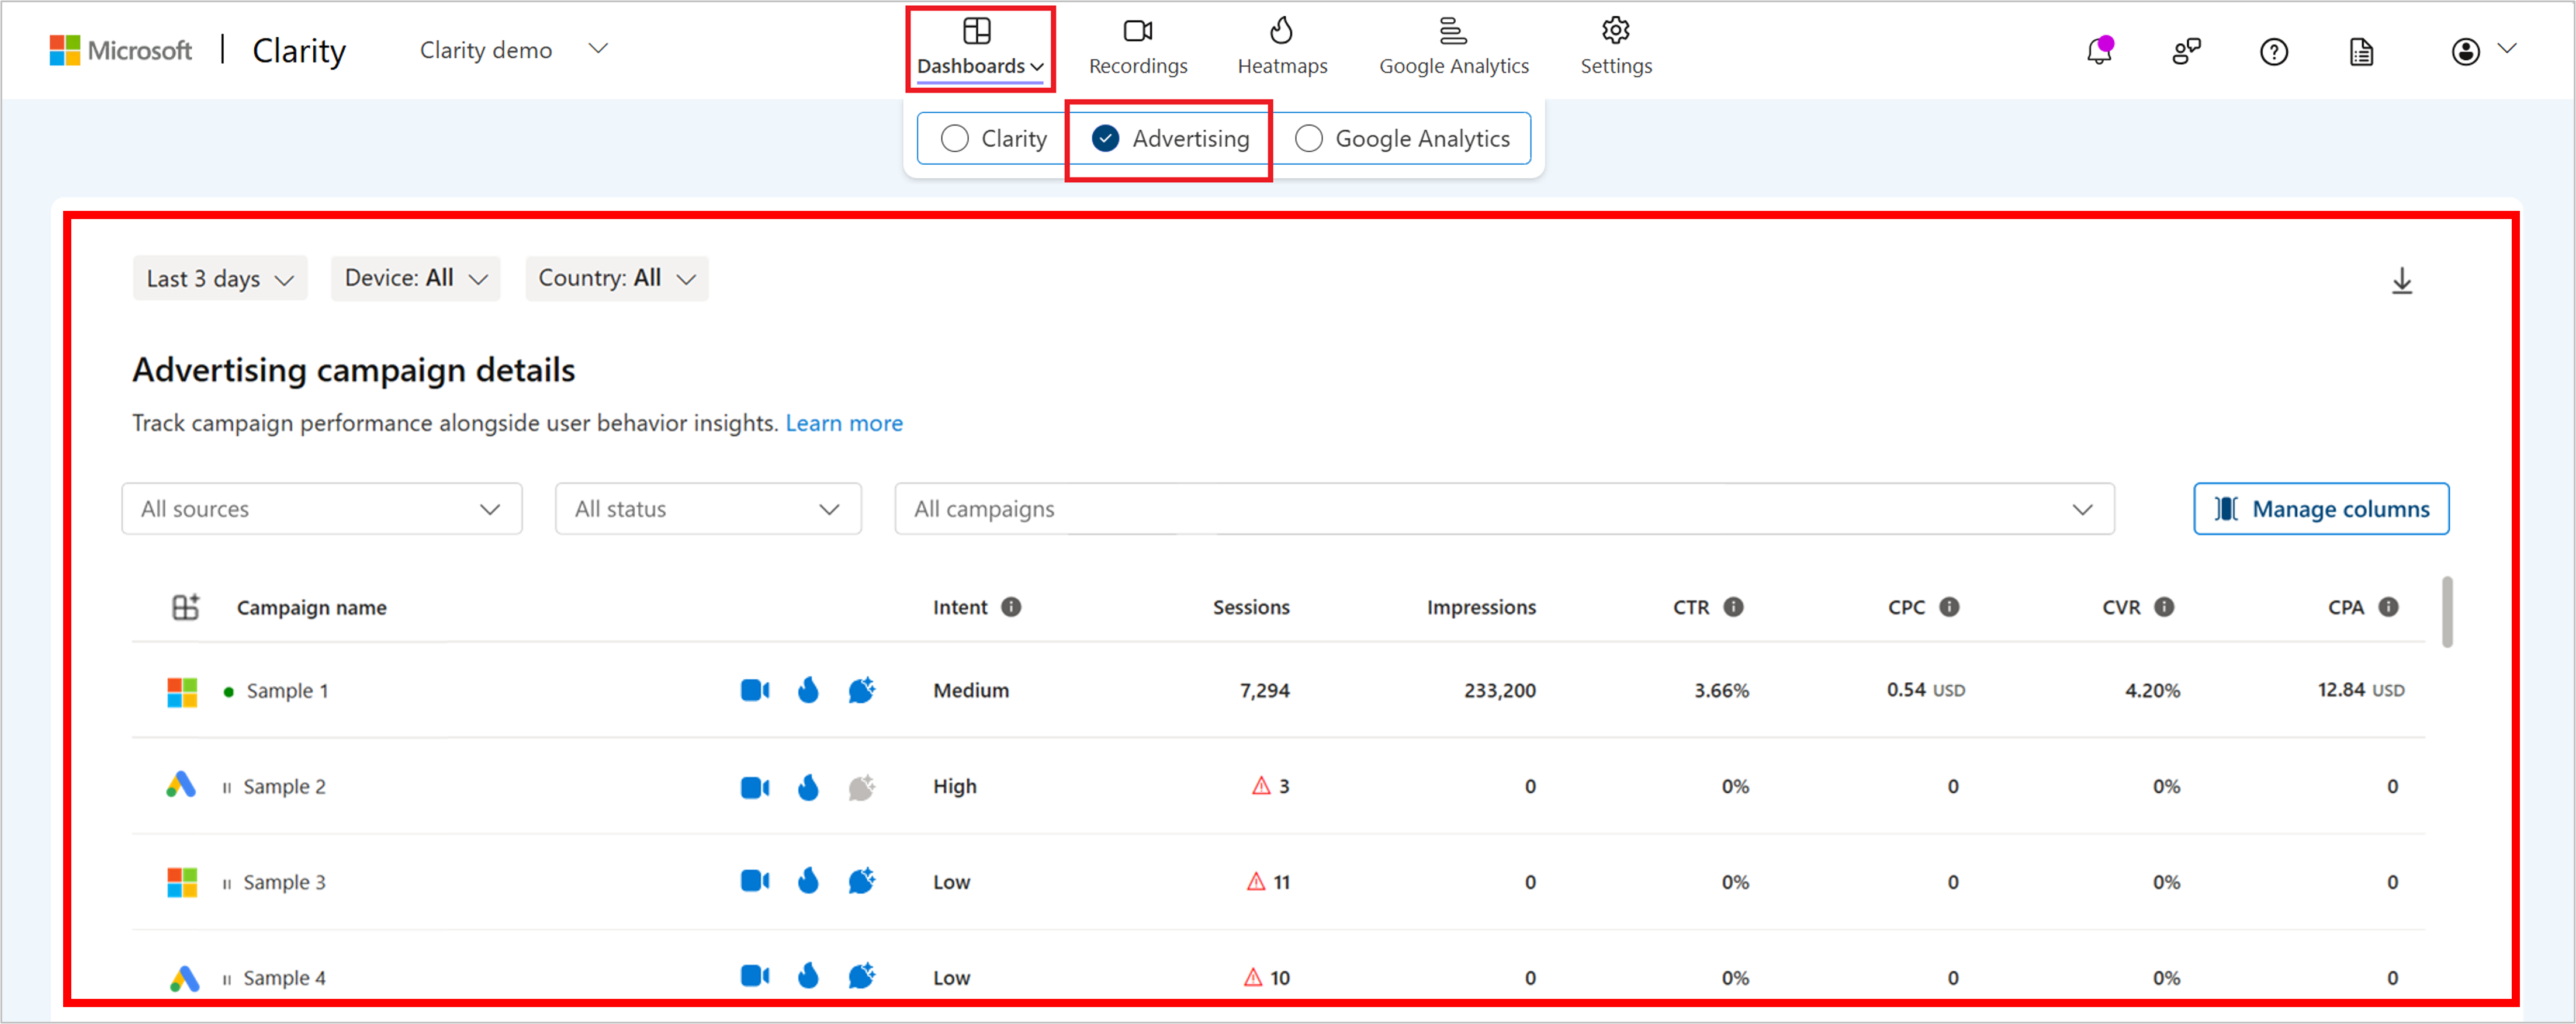
To gain more specific insights, you can also filter both Clarity, and your ads account data by:
- Campaign
- Country/Region
- Device
- Source (ad account)
- Status
- Time
You can also sort the details by selecting on any column header in the table. The Manage Columns button lets you customize your dashboard to display only the metrics that matter most to you.
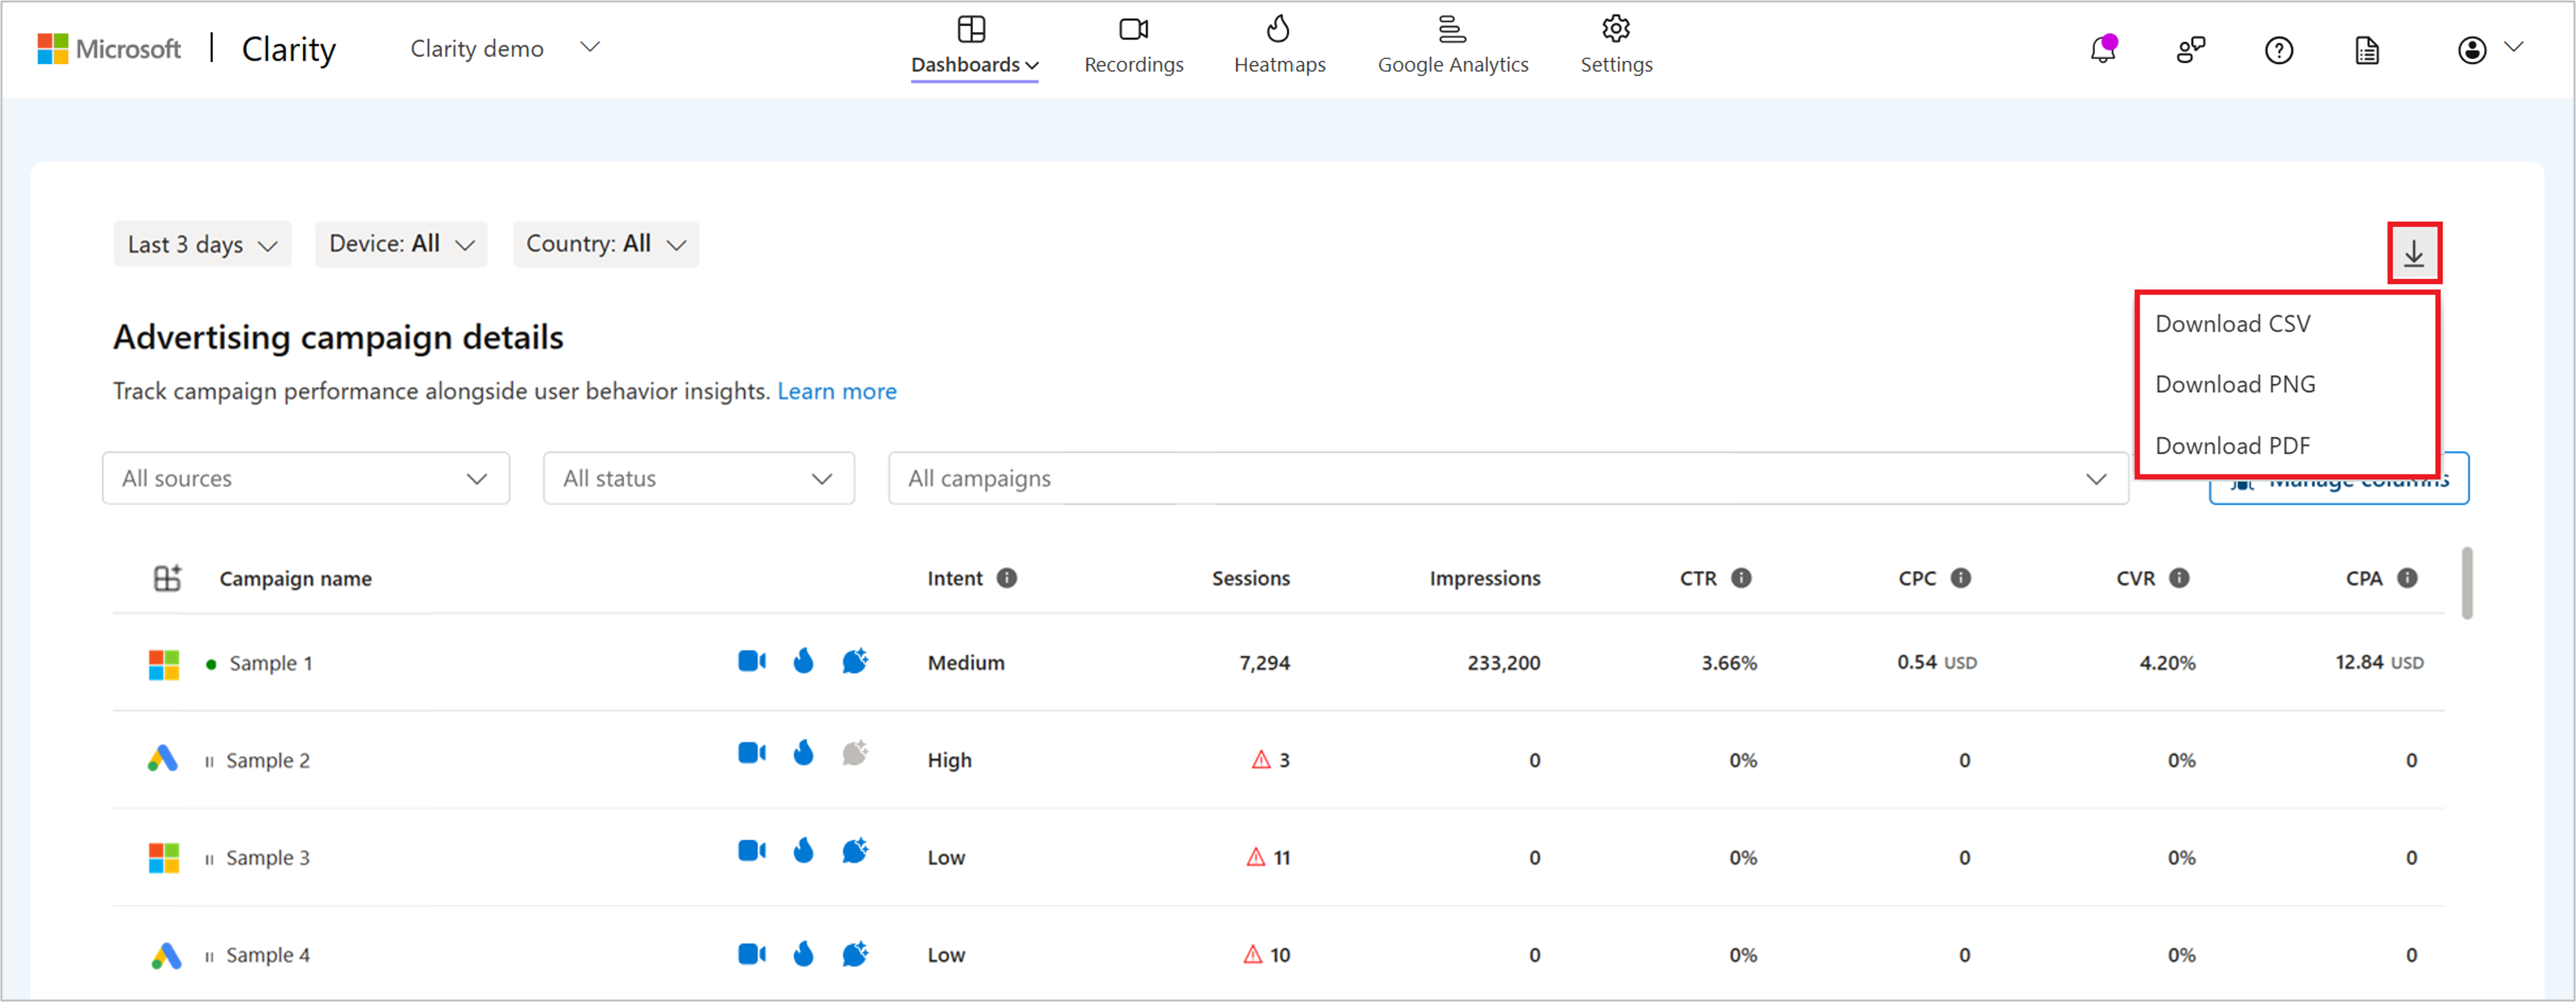
Select the download button to obtain the campaign details as CSV or PNG or PDF.
FAQ
For more answers, refer to FAQ.