Predict transaction churn
Transactional churn prediction helps predict if a customer will no longer purchase your products or services in a given time window. Transaction churn is useful to find customers who are no longer purchasing products at any time during the defined churn window. To find customers who might cancel their preset ongoing purchases, we recommend using the Subscription churn model.
You must have business knowledge to understand what churn means for your business. For instance, a business with annual events can define their churn measured in years, while a business that caters to weekly sales may measure churn in months. We support time-based churn definitions, meaning a customer is considered to have churned after a period of no purchases.
For example, Contoso wants to know how engaged customers are for an email campaign dedicated to retention. Contoso's customers visit a storefront on a variable basis, most often around 3-4 times a month. Their transactions are irregular, making it difficult to determine when a customer has stopped purchasing the Contoso brand. Through the transaction churn model, Contoso can determine the likelihood that customers will buy again. They can see the leading patterns that lead to customers leaving the brand, allowing them to adjust other strategies.
Prerequisites
- At least Contributor permissions.
- At least 500 customer profiles, preferably more than 1,000 unique customers.
- Customer Identifier, a unique identifier to match transactions to your customers.
- Transaction data for at least double the selected time window such as two to three years of transaction history. Ideally at least two transactions per customer. Transaction history must include:
- Transaction ID: Unique identifier of a purchase or transaction.
- Transaction Date: Date of the purchase or transaction.
- Value of the transaction: Currency or numerical value amount of the transaction.
- Unique product ID: ID of the product or service purchased if your data is at a line item level.
- Whether this transaction was a return: A true/false field that identifies if the transaction was a return or not. If the Value of the transaction is negative, we infer a return.
- Customer activity data:
- Customer Identifier, a unique identifier to map activities to your customers.
- Primary key: Unique identifier for an activity. For example, a website visit or a usage record showing the customer tried a sample of your product.
- Timestamp: Date and time of the event identified by the primary key.
- Event: Name of the event you want to use. For example, a field called "UserAction" in a grocery store might be a coupon use by the customer.
- Details: Detailed information about the event. For example, a field called "CouponValue" in a grocery store might be the currency value of the coupon.
- Less than 20% of missing values in the data field of the table provided
Create a transaction churn prediction
Go to Insights > Predictions.
On the Create tab, select Use model on the Customer churn model tile.
Select Transaction for the type of churn and then Get started.
Name this model and the Output table name to distinguish them from other models or tables.
Select Next.
Define customer churn
Select Save draft at any time to save the prediction as a draft. The draft prediction displays in the My predictions tab.
Set the Prediction window. For example, predict the risk of churn for your customers over the next 90 days to align to your marketing retention efforts. Predicting churn risk for a longer or shorter period of time can make it more difficult to address the factors in your churn risk profile, but it depends on your specific business requirements.
Enter the number of days to define churn in the Churn definition field. For example, if a customer hasn't made a purchase in the last 30 days, they might be considered as churned for your business.
Select Next.
Add purchase history
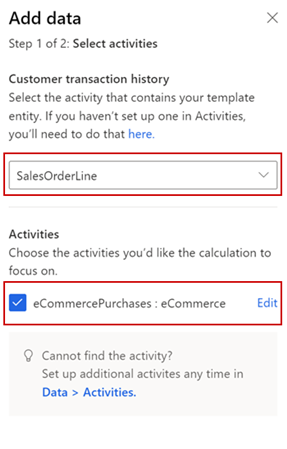
Select Add data for Customer transaction history.
Select the semantic activity type, SalesOrder or SalesOrderLine, that contains the transaction history information. If the activity hasn't been set up, select here and create it.
Under Activities, if the activity attributes were semantically mapped when the activity was created, choose the specific attributes or table you'd like the calculation to focus on. If semantic mapping didn't occur, select Edit and map your data.
Select Next and review the attributes required for this model.
Select Save.
Add more activities or select Next.
Add additional data (optional)
Select Add data for Customer activities.
Select the semantic activity type that contains the data you would like to use. If the activity hasn't been set up, select here and create it.
Under Activities, if the activity attributes were semantically mapped when the activity was created, choose the specific attributes or table you'd like the calculation to focus on. If semantic mapping didn't occur, select Edit and map your data.
Select Next and review the attributes required for this model.
Select Save.
Select Next
Set update schedule
For the Data updates step, choose a frequency to retrain your model. This setting is important to update the accuracy of predictions as new data is ingested. Most businesses can retrain once per month and get a good accuracy for their prediction.
Select Next.
Review and run the model configuration
The Review and run step shows a summary of the configuration and provides a chance to make changes before you create the prediction.
Select Edit on any of the steps to review and make any changes.
If you're satisfied with your selections, select Save and run to start running the model. Select Done. The My predictions tab displays while the prediction is being created. The process may take several hours to complete depending on the amount of data used in the prediction.
Tip
There are statuses for tasks and processes. Most processes depend on other upstream processes, such as data sources and data profiling refreshes.
Select the status to open the Progress details pane and view the progress of the tasks. To cancel the job, select Cancel job at the bottom of the pane.
Under each task, you can select See details for more progress information, such as processing time, the last processing date, and any applicable errors and warnings associated with the task or process. Select the View system status at the bottom of the panel to see other processes in the system.
View prediction results
Go to Insights > Predictions.
In the My predictions tab, select the prediction you want to view.
There are three primary sections of data within the results page:
Training model performance: Grades A, B, or C indicate the performance of the prediction and can help you make the decision to use the results stored in the output table.
Grades are determined based on the following rules:
- A when the model accurately predicted at least 50% of the total predictions, and when the percentage of accurate predictions for customers who churned is greater than the baseline rate by at least 10%.
- B when the model accurately predicted at least 50% of the total predictions, and when the percentage of accurate predictions for customers who churned is up to 10% greater than the baseline.
- C when the model accurately predicted less than 50% of the total predictions, or when the percentage of accurate predictions for customers who churned is less than the baseline.
- Baseline takes the prediction time window input for the model (for example, one year), and creates different fractions of time by dividing it by 2 until it reaches one month or less. It uses these fractions to create a business rule for customers who have not purchased in this time frame. These customers are considered as churned. The time-based business rule with the highest ability to predict who is likely to churn is chosen as the baseline model.
Likelihood to churn (number of customers): Groups of customers based on their predicted risk of churn. Optionally, create segments of customers with high churn risk. Such segments help to understand where your cutoff should be for segment membership.
Most influential factors: There are many factors that are taken into account when creating your prediction. Each of the factors has its importance calculated for the aggregated predictions a model creates. Use these factors to help validate your prediction results. Or use this information later to create segments that could help influence churn risk for customers.
Note
In the output table for this model, ChurnScore shows the predicted probability of churn and IsChurn is a binary label based on ChurnScore with 0.5 threshold. If this default threshold doesn't work for your scenario, create a new segment with your preferred threshold. Not all customers are necessarily active customers. Some of them may not have had any activity for a long time and are considered as churned already, based on you churn definition. Predicting the churn risk for customers who already churned isn't useful because they are not the audience of interest.
To view the churn score, go to Data > Tables and view the data tab for the output table you defined for this model.