Create and manage predictions
Dynamics 365 Customer Insights - Data comes with various options that leverage AI and machine learning to predict data.
Predictions offer capabilities to create better customer experiences, improve business capabilities, and revenue streams. We strongly recommend you balance the value of your prediction against the impact it has and biases that may be introduced in an ethical manner. Learn more about how Microsoft is addressing Responsible AI.
Generate insights using out-of-box prediction models
The easiest way to start with predicting data are predefined models, often referred to as out-of-box models. They only require certain data and structure to generate insights quickly.
The following models are available:
- Customer lifetime value: Predicts the potential revenue of a customer throughout the entire interaction with a business.
- Product recommendation: Suggests sets of predictive product recommendations based on purchase behavior and customers with similar purchase patterns.
- Subscription churn: Predicts whether a customer is at risk for no longer using your company’s subscription products or services.
- Transactional churn: Predicts if an individual customer will no longer purchase your products or services in a certain time frame.
- Sentiment analysis: Analyzes sentiment of customer feedback and identifies business aspects that are frequently mentioned.
To understand the readiness of your data to produce insights, see Data prep report overview.
Tip
We recommend that you regularly refresh out-of-the box models with updated data to ensure they accurately inform your business use case. Data is refreshed ad-hoc when the system ingests new or updated data sources. However, models will only rescore in this case and continue to use the existing training data.
Configure an Update schedule by setting the model retraining schedule during configuration. The model will retrain and rescore on this schedule, which you can change at any time.
Manage existing predictions
Go to the Insights > Predictions page. On the My predictions tab, view the predictions you created, their prediction type, output table name, status, the last time the prediction was edited, and the last time the data was refreshed. You can sort the list of predictions by any column.
Select a prediction to view available actions.
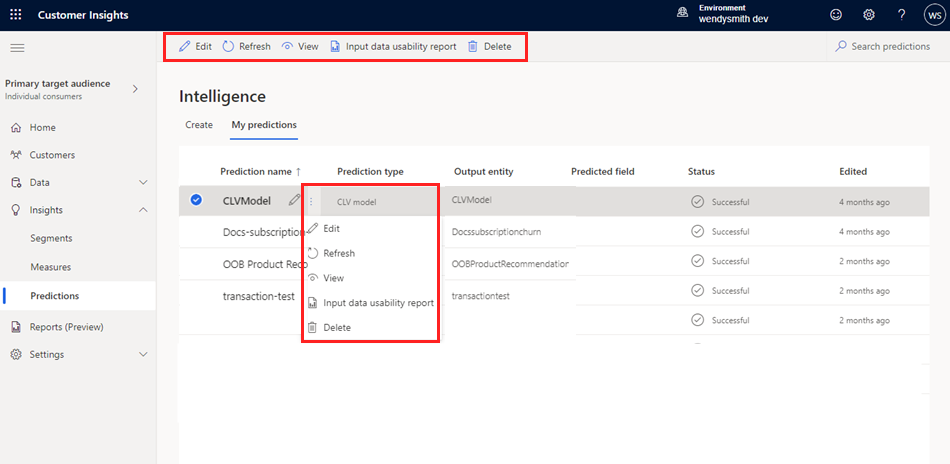
- Edit the prediction to change its properties.
- Refresh the prediction to include the latest data.
- View the prediction details.
- Input data usability report to view errors, warnings, and recommendations.
- Delete the prediction.
Refresh a prediction
Predictions can be refreshed on an automatic schedule or refreshed manually on demand. To manually refresh all predictions, select Refresh all. To manually refresh a prediction, select it and select Refresh. To schedule an automatic refresh, go to Settings > System > Schedule.
Tip
There are statuses for tasks and processes. Most processes depend on other upstream processes, such as data sources and data profiling refreshes.
Select the status to open the Progress details pane and view the progress of the tasks. To cancel the job, select Cancel job at the bottom of the pane.
Under each task, you can select See details for more progress information, such as processing time, the last processing date, and any applicable errors and warnings associated with the task or process. Select the View system status at the bottom of the panel to see other processes in the system.
View the input data usability report
The input data usability report provides a consolidated view of the errors and warnings that your out-of-box predictions may be generating. It also gives recommendations on how to improve the model performance.
The report is available after a model has completed its training process. It's created for each model separately, regardless of whether it completed training successfully or not.
On the My predictions tab, select the prediction and choose Input data usability report. Or from the prediction details view, select Input data usability report.
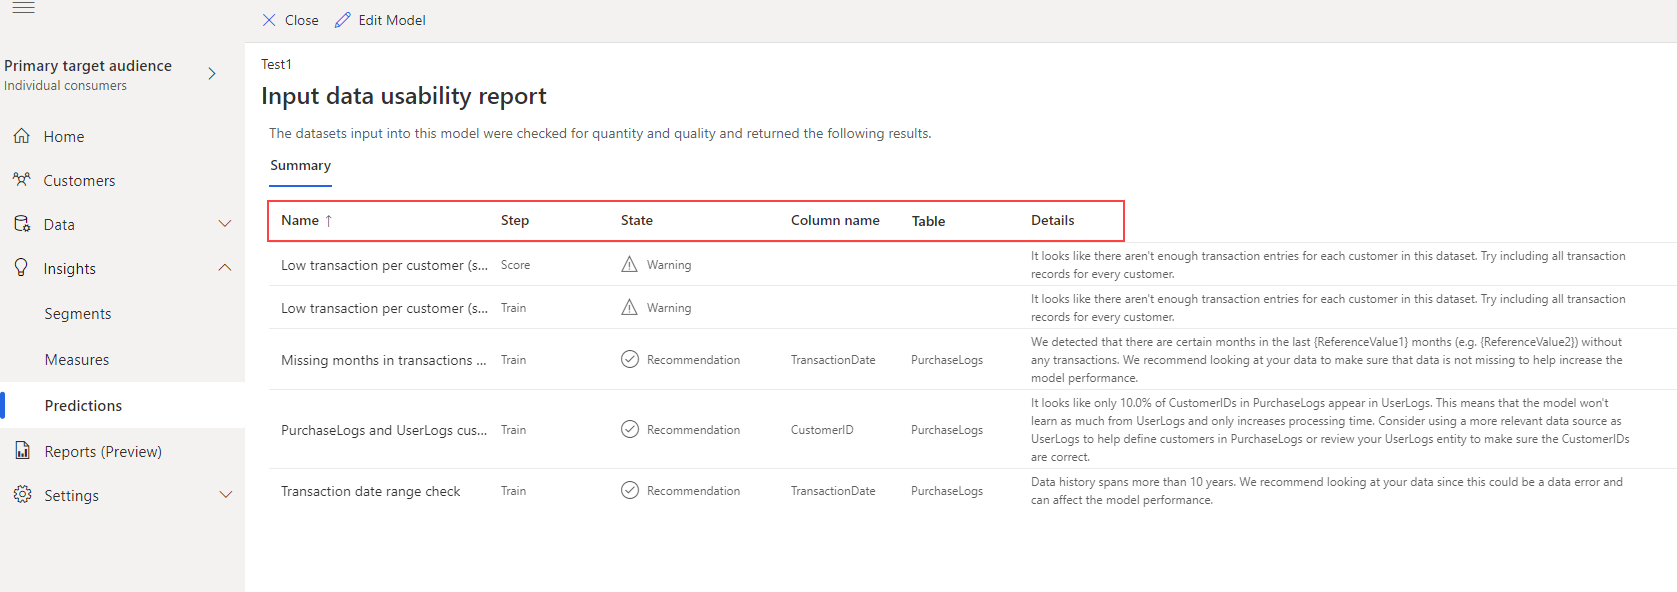
The report includes:
- Name: Descriptive name of the error, warning, or recommendation.
- Step: Model phase, train or score, the information refers to.
- State: Severity of the information (error, warning, recommendation).
- Column name: Column in a table that needs to be modified to improve the model performance.
- Table: Name of the table that needs to be modified to improve the model performance.
- Details: Details about the error, warning, or recommendation.