Personalize the opportunity pipeline view
Personalize the pipeline view to organize opportunities in a way that makes sense to you and to make it easy to update information on the fly, add notes and tasks, and more:
- Add, remove, rearrange, and sort columns in the editable grid.
- Apply filters to view records that are important to you.
- Change the layout of the view to list (grid only) or combo (grid and chart).
- Change the metrics displayed at the top of the view.
You can also ask your administrator to customize the experience further to improve your productivity.
License and role requirements
| Requirement type | You must have |
|---|---|
| License | Dynamics 365 Sales Premium, Dynamics 365 Sales Enterprise, or Dynamics 365 Sales Professional More information: Dynamics 365 Sales pricing |
| Security roles | Salesperson or higher More information: Predefined security roles for Sales |
Personalize metrics
The opportunity pipeline view lists important metrics related to the sales pipeline at the top of the view. You can personalize this space to view metrics that you want to track.
Note
Personalized metrics are only available until you log out. The current release doesn't support saving changes you make to metrics.
Open the opportunities pipeline view.
Select Combo > Edit Metrics.
In the Edit metrics side panel, you can create, update, remove, or delete a metric.
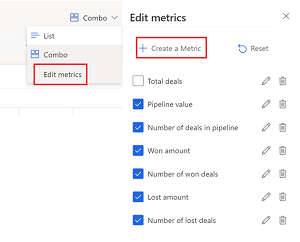

To create a metric:
Select Create a Metric.
Select the field and the aggregate function that you want to use for calculating the metric. The Field list displays all the numerical fields in the opportunity entity.
(Optional) Add filters to calculate metrics from specific records. For example, if you want to view the estimated revenue of all opportunities created this year and are in the Develop stage, create a metric with the following values:
- Field: Est. Revenue
- Aggregate function: Sum
- Filters
- Created On: This year
- Sales Stage: Develop
To edit a metric, hover over the metric in the Edit metrics side panel and select the Edit icon.
To remove a metric temporarily, clear the checkbox against the metric in the Edit metrics side panel.
Personalize the side panel
Personalize the side panel to view it in different modes, depending on the details you'd like to see and your screen size.
Open the opportunities pipeline view.
Select an opportunity from the grid to open the side panel.
Select the wand icon to switch to one of the following modes:
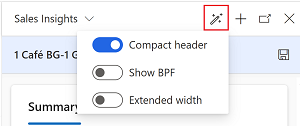
- Compact header: This is the default mode. It displays the most important fields in the opportunity table but doesn't include the business process flow.
- Show BPF: While you're in the compact mode, select this option to view the business process flow.
- Extended width: This model is ideal for large screens. It displays the business process flow and all the fields in the opportunity table.
The selected mode is saved until you change it again.
Personalize the grid
Personalize the grid to include columns that you want to see and update quickly.
- In the opportunity pipeline view, select Edit columns to add, remove, hide, show, or rearrange columns.
- In the Edit columns: Opportunities side panel:
- To add a column, select Add column.
- To show or hide columns, select or clear the checkboxes. You can't delete the default columns from the grid; however, you can hide them.
- To rearrange columns, drag the columns in the Edit columns: Opportunities panel.
- To sort columns, select the column list and select the sort option.
Apply filters
- In the opportunity pipeline view, select Edit filters.
- In the Edit filters: Opportunities panel, select Add > Add row to add a condition based on fields in the opportunity table.
You can add multiple conditions by adding more rows. The conditions are validated with the AND operator.
To specify a condition with the OR operator:
Select Add group in the Add list.
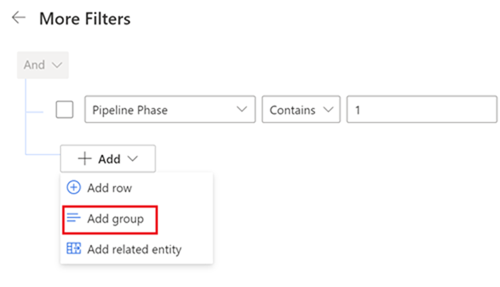
Note
Although the Add list displays Add related entity, this option isn't supported in this release.
Select the Or operator in the list next to the group filter checkbox, and specify the condition.
Learn how to create filters with grouped and nested conditions in model-driven app views.
Save personalizations to a new view
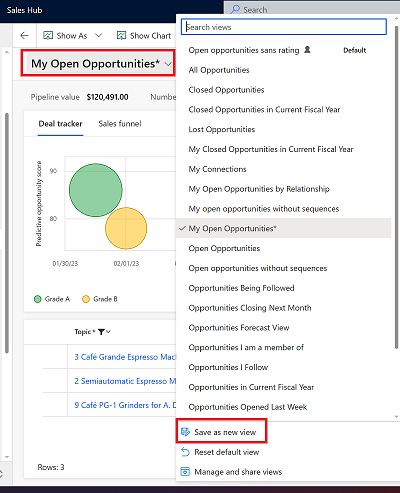
After you personalize the pipeline view, you can save your changes to a new view. An asterisk next to the view name indicates that the view has unsaved changes.
Select the My Open Opportunities view list, and then select Save as new view.
To set the new view as your default, select Set as default view.
Switch to a view
You can create multiple views with different personalizations and switch between them.
From the view list, select the view that you want to switch to.
Can't find the options in your app?
There are three possibilities:
- You don't have the necessary license or role.
- Your administrator hasn't turned on the feature.
- Your organization is using a custom app. Check with your administrator for exact steps. The steps described in this article are specific to the out-of-the-box Sales Hub and Sales Professional apps.
Feedback
Coming soon: Throughout 2024 we will be phasing out GitHub Issues as the feedback mechanism for content and replacing it with a new feedback system. For more information see: https://aka.ms/ContentUserFeedback.
Submit and view feedback for