Features in Configuration Manager technical preview version 2008
Applies to: Configuration Manager (technical preview branch)
This article introduces the features that are available in the technical preview for Configuration Manager, version 2008. Install this version to update and add new features to your technical preview site.
Review the technical preview article before installing this update. That article familiarizes you with the general requirements and limitations for using a technical preview, how to update between versions, and how to provide feedback.
The following sections describe the new features to try out in this version:
Collection query preview
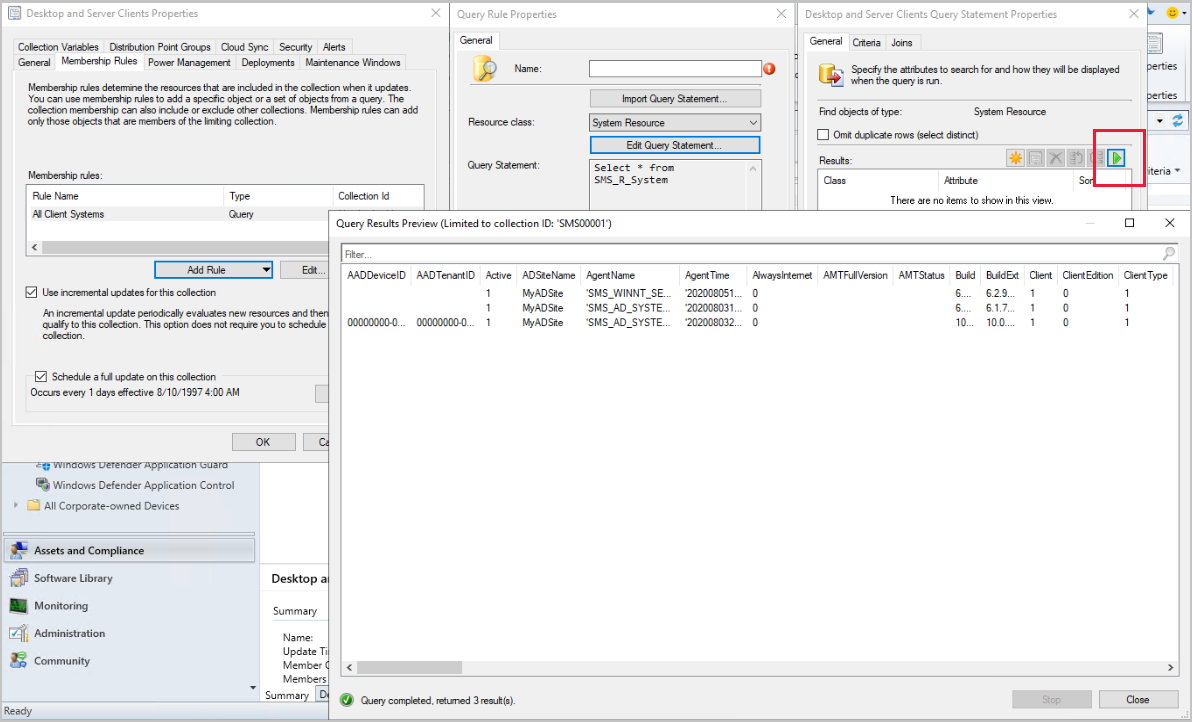
You can now preview the query results when you're creating or editing a query for collection membership. Preview the query results from the query statement properties dialog. When you select Edit Query Statement, select the green triangle on the query properties for the collection to show the Query Results Preview window. Select Stop if you want to stop a long running query.
Analyze SetupDiag errors for feature updates
With the release of Windows 10, version 2004, the SetupDiag diagnostic tool is included with Windows Setup. If there's an issue with the upgrade, SetupDiag automatically runs to determine the cause of the failure.
Configuration Manager now gathers and summarizes SetupDiag results from feature update deployments with Windows 10 servicing.
The Windows 10 Servicing dashboard in the Software Library workspace of the Configuration Manager console now includes a tile for Collection Errors:
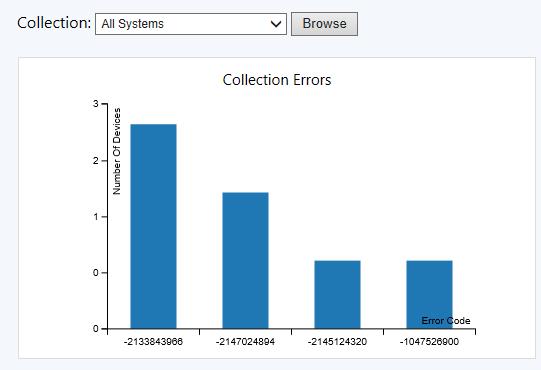
You can scope the tile to a specific collection. Each bar shows the number of devices that failed with the specified error code. For more information, see Windows upgrade error codes.
Prerequisites to analyze SetupDiag errors
Windows 10 servicing with Configuration Manager
Windows 10, version 2004, or later
Monitor scenario health
You can now use Configuration Manager to monitor the health of end-to-end scenarios. Monitoring scenario health enhances awareness of system latency and component backlogs which are critical for cloud service-attached features. Configuration Manager simulates activities to expose performance metrics and failure points. These synthetic activities are similar to methods that Microsoft uses to monitor some components in its cloud services. Use this additional data to better understand timeframes for activities. If failures occur, it can help focus your investigation. These synthetic activities are similar to methods that Microsoft uses to monitor some components in its cloud services. Use this additional data to better understand timeframes for activities. If failures occur, it can help focus your investigation.
The first scenario in this release is for SQL Server Service Broker. The service broker is a required configuration for the site database. Many of the core subsystems in Configuration Manager use the service broker.
Prerequisites for scenario health
- Full administrator role in Configuration Manager, with scope to the top-level site
Try it out!
Try to complete the tasks. Then send Feedback with your thoughts on the feature.
In the Configuration Manager console, go to the Monitoring workspace, and select the Scenario Health node.
The list view displays the available scenarios.
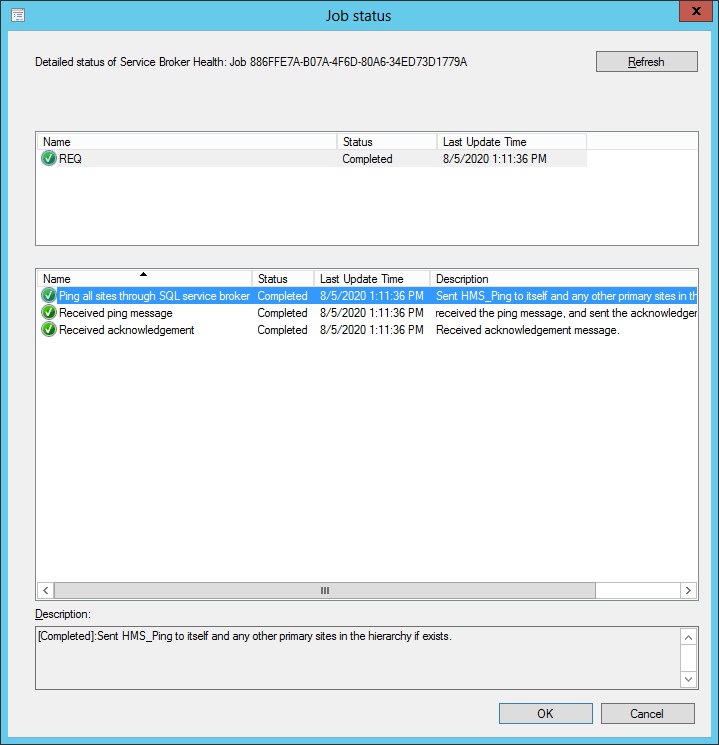
Select the Service Broker Health scenario, then in the ribbon, select Show Status.
This action opens a window with more information. The top section shows the overall status per site. Select a site, to see more detailed status for that site in the bottom section.
From the Service Broker Health node, in the ribbon, select Scenario Settings. You can configure the settings for this scenario, such as whether it's enabled, and the time interval in minutes.
From the Service Broker Health node, in the ribbon, select History. This node displays the previous instances of the synthetic transaction. Use this history to track the scenario's health over time. From the history node, you can also Show Status of a specific instance.
With this health information, you can see how long it takes for SQL Server to exchange messages via the service broker. A longer delay or timeout shows a backlog in the processing queue. A failure indicates a larger problem with the service broker, such as the queue is disabled. Since SQL Server service broker is a core component, issues with it can impact many other scenarios. For example, client notifications, client status, and some tenant attach features.
Collection evaluation view
We've integrated the functionality of Collection Evaluation Viewer into the Configuration Manager console. This change provides administrators a central location to view and troubleshoot the collection evaluation process. The console now displays the following information:
- Historic and live information for full and incremental collection evaluations
- The evaluation queue status
- The time for collection evaluations to complete
- Which collections are currently being evaluated
- The estimated time that a collection evaluation will start and complete
Add columns for the Device Collections node
- In the Configuration Manager console, go to Assets and Compliance > Overview > Device Collections.
- Add any or all of the following columns prefixed by the type of evaluation:
- Evaluation (Full)
- Last Completion Time: When the last collection evaluation completed (default column)
- Run Time: How long the last collection evaluation ran, in seconds
- Next Refresh Time: When the next full evaluation starts
- Member Changes: The member changes in the last collection evaluation. Positive numbers mean members were added while negative numbers mean members were removed.
- Last Member Change Time: The most recent time that there was a membership change in the collection evaluation
- Evaluation (Incremental)
- Last Evaluation Completion Time: When the last collection evaluation completed
- Run Time: How long the last collection evaluation ran, in seconds
- Member Changes: The member changes in the last collection evaluation. These changes are either plus (members added) or minus (members removed).
- Last Member Change Time: The most recent time that there was a membership change in the collection evaluation
- Evaluation (Full)
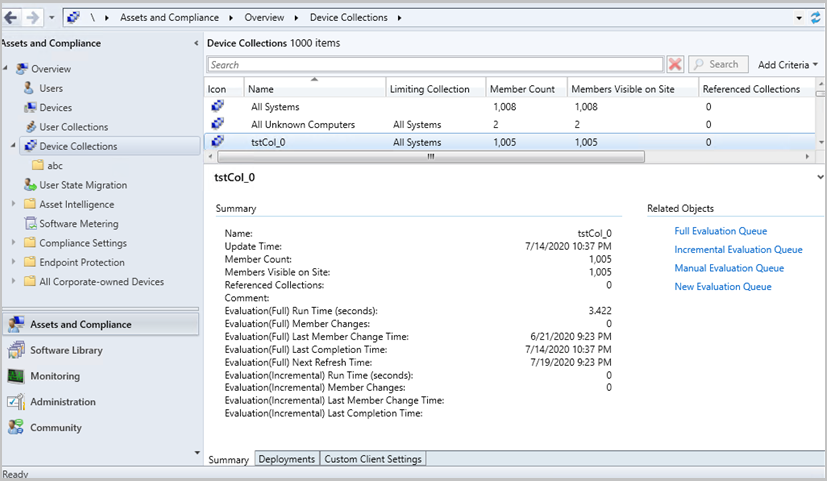
View collection summary information
- Select a collection from the Device Collections node.
- In the Summary group pane for collection, review the evaluation-related information.
- The Related Objects give links to view status of the collection in the specific queue under the Collection Evaluation node in the Monitoring workspace.
- This action creates a new node is created where you can see the evaluation status for the specific collection.
Monitoring collection evaluation queues
From the Monitoring workspace, go to the Collection Evaluation node. The following queues are summarized and have their own nodes:
- Full Evaluation Queue: For collections due for full evaluation
- Incremental Evaluation Queue: For collections with incremental evaluation
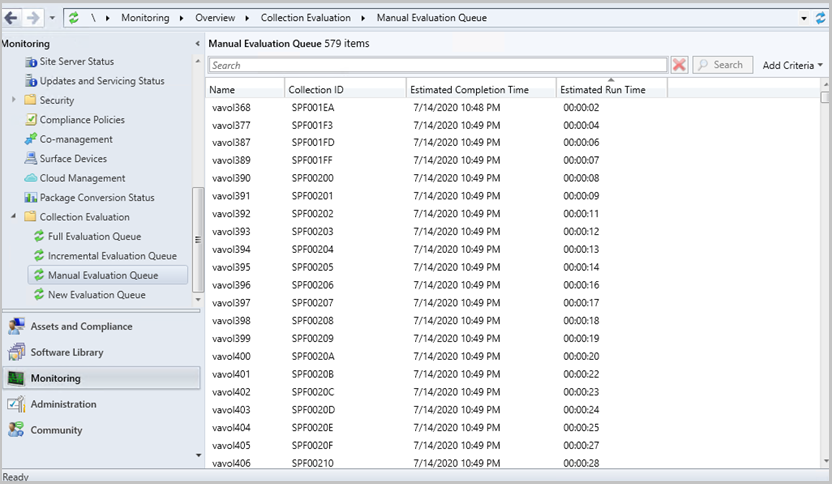
- Manual Evaluation Queue: For collections that an administrator has manually selected for evaluation from the console
- New Evaluation Queue: For newly created collections
From the Collection Evaluation node, the total number of collections in queue and queue length is listed as a summary. Additionally, the following status summaries for the evaluation queues are listed:
- Number of collections in queue
- Queue length
- Current evaluation collection
- Current evaluation started on
- Current evaluation elapsed (seconds)
Selecting the node for a queue brings up detailed status for the queue including:
- Name: Name of the collection
- Collection ID: ID of the collection
- Estimated Completion Time: When the evaluation is estimated to complete
- Estimated Run Time: How long the evaluation is estimated to run, in day:hour:minute:second format
Try it out!
Try to complete the tasks. Then send Feedback with your thoughts on the feature.
- Select a collection from the Device Collections node. In the information pane, review the evaluation-related status and the Related objects links for each evaluation queue's status.
- Add an evaluation-related column to the collection view.
- Review the collection evaluation status in Monitoring node:
- Trigger a collection evaluation (such as updating a membership rule), then navigate to the Collection Evaluation node to view the status.
- Trigger a collection evaluation, then view queue status nodes for the different types of evaluation such as the Manual Evaluation Queue.
See task sequence size in the console
This release continues to iterate on changes in technical preview version 2004 and version 2007 to help you manage the size of task sequences. When you view the list of task sequences in the Configuration Manager console, add the Size (KB) column. Use this column to identify large task sequences that can cause problems.
Note
This value is updated when the task sequence is saved. After upgrade the value will show as 0KB until the task sequence is edited and changes are saved.
Delete Aged Collected Diagnostic Files task
You now have a new maintenance task available for cleaning up collected diagnostic files. Delete Aged Collected Diagnostic Files uses a default value of 14 days when looking for diagnostic files to clean up and doesn't affect regular collected files. The new maintenance task is enabled by default.
Import objects to current folder
Based on your feedback, now when you import an object in the Configuration Manager console, it imports to the current folder. Previously, Configuration Manager always put imported objects in the root node. This new behavior applies to applications, packages, driver packages, and task sequences.
For example:
- In the Configuration Manager console, go to the Software Library workspace, expand Application Management, and select the Packages node.
- In the ribbon, on the Folder tab, select Create Folder. Name it Test. If it's not already selected, select the new folder.
- In the ribbon, on the Home tab, select Import. Import a package object.
The Configuration Manager console imports the package into the Test folder, instead of the root Packages node.
Next steps
For more information about installing or updating the technical preview branch, see Technical preview.
For more information about the different branches of Configuration Manager, see Which branch of Configuration Manager should I use?.
Feedback
Coming soon: Throughout 2024 we will be phasing out GitHub Issues as the feedback mechanism for content and replacing it with a new feedback system. For more information see: https://aka.ms/ContentUserFeedback.
Submit and view feedback for
