Note
Access to this page requires authorization. You can try signing in or changing directories.
Access to this page requires authorization. You can try changing directories.
Adoption Score provides insights into your organization's digital transformation journey through its use of Microsoft 365 and the technology experiences that support it. Your organization's score reflects people and technology experience measurements and can be compared to benchmarks from organizations similar to yours. The content collaboration category is part of the people experiences measurements. To learn more, check out the Adoption Score overview and read Microsoft's Privacy Statement.
Prerequisites
To get started with Content collaboration insights, people in your organization need to be licensed for:
- OneDrive
- SharePoint
- Exchange Online
For more information, see assign licenses to users.
After people have been active in the above products at least once in the last 28 days, you will start to see the insights.
Why your organization's content collaboration score matters
A key aspect of digital transformation is how people collaborate in files. With your content on Microsoft 365, people access, create, modify, and collaborate on content with other people from any location. Research shows that when people collaborate with online files, each person saves an average of 100 minutes per week.
How we calculate the content collaboration score
We provide a primary insight that contains the key metrics for content collaboration in your organization. Then, a scoring framework detailed below is used for these metrics to calculate your organization's score.
Note
On April 22, 2021, we changed how the collaborators metric is calculated. This affects the primary insight, the file collaboration insight, and the way the content collaboration score is measured. This change helps reduce noise in the data from non-human agents (or bots) from Microsoft and other third-party applications, resulting in a more accurate and actionable score.
Primary insight
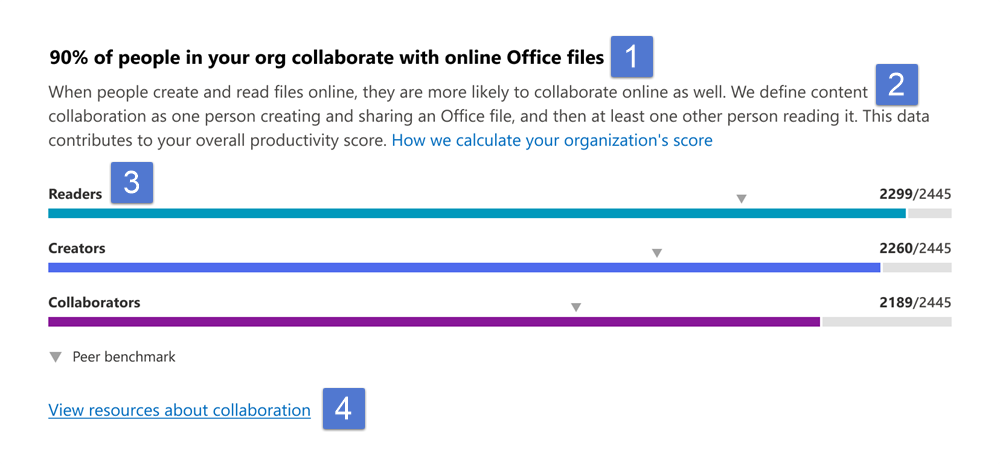
Microsoft OneDrive and SharePoint help people to easily create, read, and discover their individual and shared content in Microsoft 365 from across devices and applications. They also allow people to securely share and collaborate on content. The primary insight contains information from everyone who can use OneDrive and SharePoint. Additionally it breaks down the details about how many people read, create, and collaborate on content stored in OneDrive and SharePoint.
Types considered for this information include Word, Excel, PowerPoint, OneNote, and PDF files.
- Header: Shows the percentage of people in your org who have access to OneDrive or SharePoint who are collaborating on content.
- Body: Provides more information on how the behaviors of reading and creating files online are linked to collaborating on files.
- Visualization (current state):
Horizontal bars where the blue-colored portions represent the percentage of people enabled for file collaboration through OneDrive or SharePoint who have been readers, creators, or collaborators on online files in the last 28 days.
They're defined as follows:
Readers: People who access or download online files in OneDrive or SharePoint.
Creators: People who create, modify, upload, sync, check in, copy, or move online OneDrive or SharePoint files.
Collaborators: People who collaborate with online files by using OneDrive or SharePoint. Two people are collaborators if one of them reads or edits an online Microsoft 365 app or PDF after the other person has created or modified it, within a 28-day window.Note
The files considered in the visualization are Word, Excel, PowerPoint, OneNote, or PDF files that are online and saved to OneDrive or SharePoint.
Highlight (numerator/denominator) of the fraction is used to calculate the percentage expressed in each of the horizontal bars.
- Readers:
- Numerator: Number of people who access or download online files in OneDrive or SharePoint in the last 28 days
- Denominator: Number of people who had access to OneDrive or SharePoint for at least 1 of the last 28 days
- Creators:
- Numerator: Number of people who create, modify, upload, sync, check in, copy, or move online files in OneDrive or SharePoint in the last 28 days
- Denominator: Number of people who have had access to OneDrive or SharePoint for at least 1 of the last 28 days.
- Numerator: Number of people who create, modify, upload, sync, check in, copy, or move online files in OneDrive or SharePoint in the last 28 days
- Collaborators:
- Numerator: Number of people who have collaborated on online files in OneDrive or SharePoint in the last 28 days
- Denominator: Number of people who have had access to for OneDrive or SharePoint for at least 1 of the last 28 days
- Numerator: Number of people who have collaborated on online files in OneDrive or SharePoint in the last 28 days
- Readers:
Peer benchmark value for each of readers, creators, and collaborators is also shown as a percentage. In other words, the value of the number of creators is shown as a percentage of the number of people who have access to OneDrive or SharePoint.
- Link to resources: Select this link to view collated videos, and other related help content.
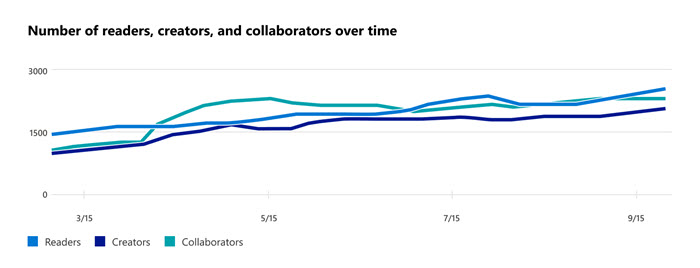
Trend visualization of primary insight
The trend visualizations chart shows the trend-line of the primary insight key metrics for readers, creators, and collaborators, over the last 180 days. Each data point on the chart is an aggregate of activity for the last 28 days. Each creator data-point provides a count of all people who were tagged as creators within the last 28 days for each date on the x axis.
Scoring framework
The content collaboration score for your organization measures at an aggregate (organization) level whether people are consistently reading, creating, or collaborating on online Microsoft 365 files such as Word, Excel, PowerPoint, OneNote, or PDFs, or in OneDrive or SharePoint.
Scores are not provided at the individual user level.
Explore how your organization collaborates
We also provide you with information that helps you gain visibility into how your organization collaborates on content. These additional metrics don't directly contribute to your Adoption Score but help you create an action plan as part of your digital transformation to help optimize the way people work.
Creating files in OneDrive or SharePoint
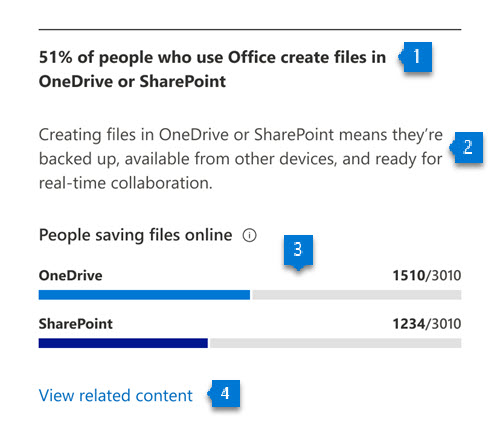
Header: Highlights the percentage of people active on apps in Microsoft 365 who create files on OneDrive or SharePoint.
Body: Provides information about the value of content creation in OneDrive and SharePoint.
Visualization: The breakdown in the visualization represents the extent to which people who are using apps in Microsoft 365 to create files in OneDrive and SharePoint, as follows:
- OneDrive: The blue (colored) portion of the bar and the fraction on the bar represent the percentage of people active on apps in Microsoft 365 creating content on OneDrive as follows:
- Numerator: The number of people who create, modify, upload, sync, check in, copy, or move online Microsoft 365 files in OneDrive within the last 28 days.
- Denominator: The number of people who have access to OneDrive or SharePoint and access office files within the last 28 days.
- Numerator: The number of people who create, modify, upload, sync, check in, copy, or move online Microsoft 365 files in OneDrive within the last 28 days.
- SharePoint: The blue (colored) portion of the bar and the fraction on the bar represent the percentage of people who are active in apps in Microsoft 365 and create content on SharePoint as:
- Numerator: The number of people who create, modify, upload, sync, check in, copy, or move online Microsoft 365 files (Microsoft Word, Excel, PowerPoint, or OneNote files) on SharePoint within the last 28 days.
- Denominator: The number of people who have access to OneDrive or SharePoint and have accessed Microsoft 365 files within the last 28 days.
- Numerator: The number of people who create, modify, upload, sync, check in, copy, or move online Microsoft 365 files (Microsoft Word, Excel, PowerPoint, or OneNote files) on SharePoint within the last 28 days.
- OneDrive: The blue (colored) portion of the bar and the fraction on the bar represent the percentage of people active on apps in Microsoft 365 creating content on OneDrive as follows:
Link to resources: Select this link to view help content.
Use of attachments in email
Use of attachments in email Understand how many users are attaching physical files in email rather than links to content in the cloud, and monitor the reduction of this number over time.
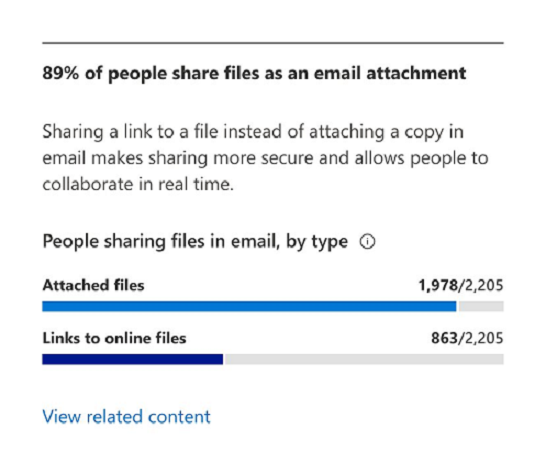
- Header: Highlights the percentage of people who use attachments in emails that were not saved to online files.
- Body: Provides information about the value of sharing links to online files from a collaboration and security perspective.
- Visualization: The breakdown in the visualization is meant to represent the extent to which people who are attaching content in emails are using different modes (files not saved to online files, links to online files):
- Attach files: The blue (colored) portion of the bar and the fraction (numerator/denominator) on the bar represents the percentage of people using attachments in emails.
- Numerator: The number of people who attach files to email that weren't saved to online file within the last 28 days.
- Denominator: The number of people who have had access to Exchange and OneDrive, SharePoint, or both, and sent at least one attachment within the last 28 days.
- Links to online files: The blue (colored) portion of the bar and the fraction (numerator/denominator) on the bar represent the percentage of people using attachments and attaching links to files in emails.
- Numerator: The number of people attaching links to online files to emails within the last 28 days.
- Denominator: The number of people who have had access to Exchange and OneDrive, SharePoint, or both, and sent at least one attachment within the last 28 days.
- Attach files: The blue (colored) portion of the bar and the fraction (numerator/denominator) on the bar represents the percentage of people using attachments in emails.
- Link to resources: Select this link to view help content.
Sharing of online files
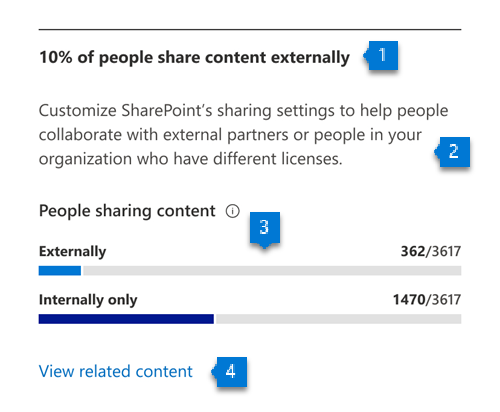
- Header: Highlights the percentage of people who have access to for OneDrive or SharePoint who are sharing files externally.
- Body: Provides information about the admins' ability to change the file- sharing settings in the organization to enable the level of collaboration best suited to your organization.
- Visualization: Represents the extent to which people who have access to OneDrive or SharePoint are sharing files internally or externally:
- Externally: The blue (colored) portion of the bar and the fraction (numerator/denominator) on the bar represent the percentage of people who have access to OneDrive or SharePoint and are sharing files externally.
- Numerator: The number of people who have shared files externally within the last 28 days.
- Denominator: The total number of people who have had access to OneDrive or SharePoint for at least 1 of the last 28 days.
- Internally only: The blue (colored) portion of the bar and the fraction (numerator/denominator) on the bar represent the percentage of people who have access to OneDrive or SharePoint and are sharing files internally only.
- Numerator: The number of people who have shared files internally only within the last 28 days.
- Denominator: The number of people who have had access to Exchange and OneDrive, SharePoint, or both, and sent at least one attachment within the last 28 days.
- Externally: The blue (colored) portion of the bar and the fraction (numerator/denominator) on the bar represent the percentage of people who have access to OneDrive or SharePoint and are sharing files externally.
- Link to resources: Select this link to view help content.
Number of files collaborated on
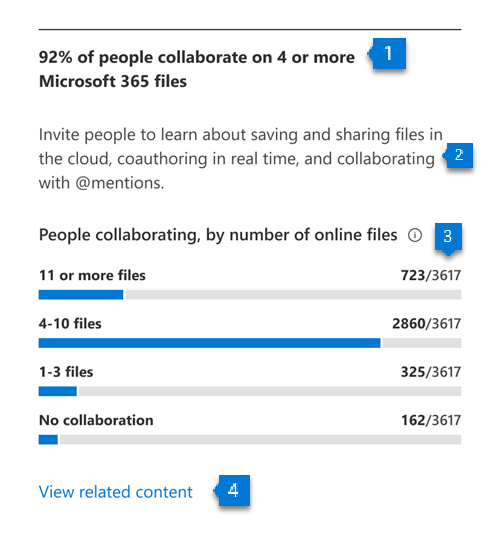
- Header: Highlights the percentage of people who have access to OneDrive or SharePoint who are collaborating on 4 or more files.
- Body: Provides information about how people can leverage online files for better collaboration.
- Visualization: Shows a distribution of the people who have access to OneDrive or SharePoint, based on the number of files they collaborate on. This is shown through the following 4 categories (for each, the blue portion of the bar and the fraction represent the percentage of people who have access to OneDrive or SharePoint that fall into that category):
- No collaboration:
- Numerator: Number of people not collaborating on any files in the last 28 days.
- Denominator: Total number of people who have access to OneDrive or SharePoint for at least 1 of the last 28 days.
- Collaboration on 1-3 files:
- Numerator: Number of people collaborating on 1-3 files in the last 28 days.
- Denominator: Total number of people who have had access to OneDrive or SharePoint for at least 1 of the last 28 days.
- Collaboration on 4-10 files:
- Numerator: Number of people collaborating on 4-10 files in the last 28 days.
- Denominator: Total number of people who have had access to OneDrive or SharePoint for at least 1 of the last 28 days.
- Collaboration on 11 or more files:
- Numerator: Number of people collaborating on 11 or more files in the last 28 days.
- Denominator: Total number of people who have had access to OneDrive or SharePoint for at least 1 of the last 28 days.
- No collaboration:
- Link to resources: Select this link to view help content.
Network performance strength for OneDrive and SharePoint
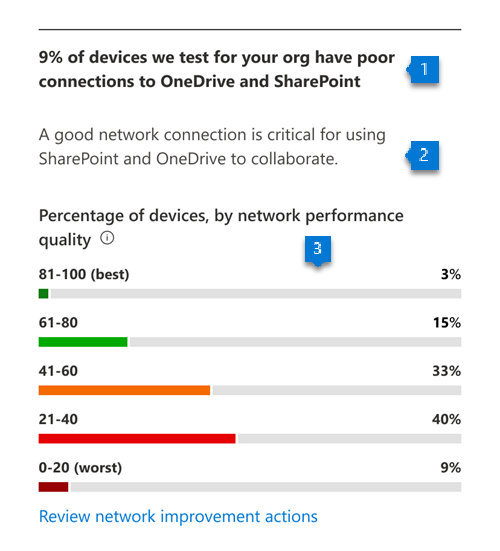
- Header: Highlights the percentage of devices out of all tested that has poor network connection to OneDrive and SharePoint.
- Body: Provides information about why network connection performance important for collaboration.
- Visualization: Shows a percentage of devices with different levels of network connectivity performance related to OneDrive and SharePoint:
- 81-100 (best): The dark green (colored) portion of the bar represents the percentage of devices with the best performance.
- 61-80: The green (colored) portion of the bar represents the percentage of devices with a network performance score between 60-80.
- 41-60: The orange (colored) portion of the bar represents the percentage of devices with a network performance score between 40-60.
- 21-40: The red (colored) portion of the bar represents the percentage of devices with a network performance score between 20-40.
- 0-20: The dark red (colored) portion of the bar represents the percentage of devices with the worst network performance score between 0-20.
View content collaboration trends over time
For each of the insights above, you can see how the metrics trend over time by selecting an option from the dropdown shown below:
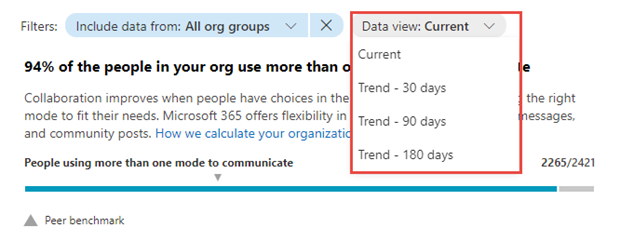
After you select an option, the charts in the report will update to show a trend over time rather than a snapshot of the past month.
Related content
Microsoft 365 apps health – Technology experiences (article)
Communication – People experiences (article)
Meetings – People experiences (article)
Mobility – People experiences (article)
Privacy controls for Adoption Score (article)
Teamwork – People experiences (article)