Microsoft product NPS feedback and insights for your organization
As the admin of a Microsoft 365 organization, you can access and obtain insights from NPS product surveys sent by Microsoft.
Net Promoter Score (NPS) surveys gather user feedback and measure how likely users say they are to recommend products and services to friends and colleagues. This data can be used at your organization to determine strategies for adoption and rollout of Microsoft 365 products and services.
We use NPS surveys and feedback from your end-users to provide you with insights about Microsoft products and services. This information can help you find out about what products and services end-users in your organization are using, as well as help you identify issues and quickly resolve them. With this information you can:
- Access to the top themes users are discussing.
- Identify happy users.
- Address complaints from unhappy users.
- See what operating system or platform people are using.
- Filter by product, platform, channel, or search using keywords.
- See end-user comments on the top products and issues.
- Export feedback and survey information to a CSV file.
Watch: NPS feedback and insights
Before you begin
You need to be an administrator to view and read survey reports. Your organization needs to have feedback surveys turned on to view and read survey reports. Check out Manage Microsoft feedback for your organization to learn more.
Important
A minimum of 30 NPS survey submissions is required from your end-users before you can see NPS survey insights.
NPS survey insights
- In the Microsoft 365 admin center, go to Health > Product feedback > NPS survey insights.
- From the NPS survey insights page, navigate on the page to see survey insights related to NPS for your organization.

Top topic filters
We've identified the common themes from user feedback. Then we used machine learning models that train the data sets and automatically organize the feedback into Top Topics. You can then identify the top five topics with the most volume of verbatim feedback.

Note
We only publish an intelligent topic after it meets a minimum quality bar set in partnership with subject matter experts. Precision and recall metrics are used to determine the same.
Verbatim precision is how likely it is that a verbatim classified in this topic is correct.
Verbatim Recall is how likely that a verbatim related to this topic is classified in this topic.
The topics that currently are available as follows:
Change Management refers to customer comments related to updated experiences, including the update process, how to use favorite apps, and design changes.
- Verbatim Precision- 82%
- Verbatim Recall- 81%
Collaboration refers to how easy users find it to collaborate using Microsoft apps.
- Verbatim Precision- 92%
- Verbatim Recall-91%
Complexity refers to customer feedback on whether they feel the apps are complex or straightforward to use.
- Verbatim Precision- 92%
- Verbatim Recall- 89%
General Praise refers to customers comments that have a positive sentiment and don't fit into other topic.
- Verbatim Precision- 93%
- Verbatim Recall- 98%
Reliability includes customer comments about app and system behavior resulting in an unexpected termination.
- Verbatim Precision- 97%
- Verbatim Recall- 94%
Navigation includes customer comments about app navigation and usability.
- Verbatim Precision- 93%
- Verbatim Recall- 98%
Performance refers to customer comments that addresses issues related to perceived speed of operations that a user experiences while using a Microsoft product. This topic doesn't cover the areas of crashes or broader reliability issues.
- Verbatim Precision- 92%
- Verbatim Recall- 98%
Reliability refers to customer comments about app and system behavior resulting in an unexpected termination.
Verbatim Precision- 97% Verbatim Recall- 94%
User Education consists of customer comments on help documentation, tutorials, guides and other in-product or online learning content.
- Verbatim Precision- 83%
- Verbatim Recall- 87%
Value refers to customer perceptions about topics including pricing and payment preferences.
- Verbatim Precision- 86%
- Verbatim Recall- 100%
Chart information
Total feedback shows the total number of NPS feedback responses submitted by end users, include NPS feedback with comments and without comments.
Comments shows the total number of NPS feedback responses submitted by end user that include comments.
Response volume by application shows the total number of NPS feedback response volume by application.
Response volume by platform shows the total number of NPS feedback response volume by platform.
Feedback volume by month shows the total number of NPS feedback response volume by the last twelve months.
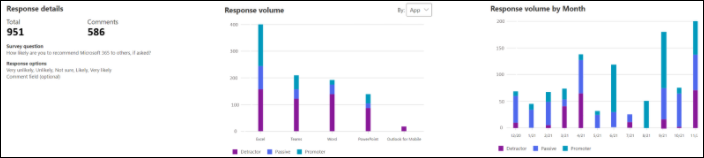
Charts are filtered by the NPS rating as follows:
- Detractors are unhappy customers who are unlikely to recommend your product or service. For example, 1-3 on the 5 point scale.
- Passives are customers that are satisfied with the service but not enough to recommend your product or service. For example, 4 on the 5 point scale.
- Promoters- Happy customers that are loyal, enthusiastic and are likely to recommend your product or service. For example, 5 on the 5 point scale.

Export to CSV and Search
You can export raw data for further analysis using the Export to CSV functionality. You can search for keywords in the comment section that corresponds to the feedback area.

Note
The raw data includes all types of feedback, including non NPS feedback.
Filters
You can filter by Channels, Products, Platforms and Feedback Types.
Channels are a way for organizations to select how often they get feature updates for Microsoft 365. Learn more at Overview of update channels for Microsoft 365 apps. This filter allows you to filter down to feedback submitted from a user on a specific channel.
Feedback can be submitted on various Platforms like Android, iOS, Mac, and Windows. This filter allows you to filter feedback based on the platform it was submitted on.
The majority of Microsoft 365 for business Products can be found under this filter. Use this filter to select the products that have had feedback submitted.
Use Feedback Types (set only to NPS feedback types) to filter feedback that we collect.

We want to hear from you
Share your thoughts about the NPS survey insight dashboard and your ideas about how to improve it. Use the Feedback sections in the products and services. You can also email us at prosight@microsoft.com
Feedback
Coming soon: Throughout 2024 we will be phasing out GitHub Issues as the feedback mechanism for content and replacing it with a new feedback system. For more information see: https://aka.ms/ContentUserFeedback.
Submit and view feedback for