Device entity page in Microsoft Defender
Note
Want to experience Microsoft Defender XDR? Learn more about how you can evaluate and pilot Microsoft Defender XDR.
The device entity page in the Microsoft Defender portal helps you in your investigation of device entities. The page contains all the important information about a given device entity. If an alert or incident indicates that a device is behaving suspiciously or might be compromised, investigate the details of the device to identify other behaviors or events that might be related to the alert or incident, and discover the potential scope of the breach. You can also use the device entity page to perform some common security tasks, as well as some response actions to mitigate or remediate security threats.
Important
The content set displayed on the device entity page may differ slightly, depending on the device's enrollment in Microsoft Defender for Endpoint and Microsoft Defender for Identity.
If your organization onboarded Microsoft Sentinel to the Defender portal, additional information will appear.
In Microsoft Sentinel, device entities are also known as host entities. Learn more.
Microsoft Sentinel is available as part of the public preview for the unified security operations platform in the Microsoft Defender portal. For more information, see Microsoft Sentinel in the Microsoft Defender portal.
Device entities can be found in the following areas:
- Devices list, under Assets
- Alerts queue
- Any individual alert/incident
- Any individual user entity page
- Any individual file details view
- Any IP address or domain details view
- Activity log
- Advanced hunting queries
- Action center
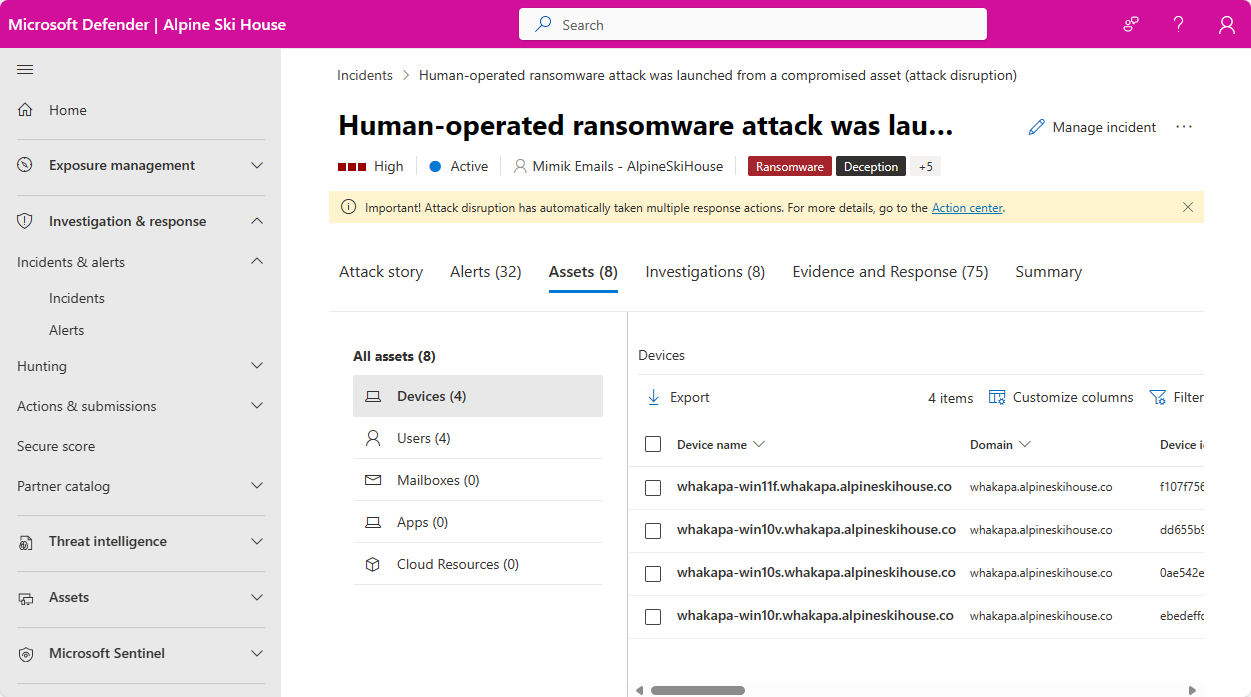
You can select devices whenever you see them in the portal to open the device's entity page, which displays more details about the device. For example, you can see the details of devices listed in the alerts of an incident in the Microsoft Defender portal at Incidents & alerts > Incidents > incident > Assets > Devices.
The device entity page presents its information in a tabbed format. This article lays out the types of information available in each tab, and also the actions you can take on a given device.
The following tabs are displayed on the device entity page:
- Overview
- Incidents and alerts
- Timeline
- Security recommendations
- Inventories
- Discovered vulnerabilities
- Missing KBs
- Security baselines
- Security policies
- Sentinel events
Entity page header
The topmost section of the entity page includes the following details:
- Entity name
- Risk severity, criticality, and device value indicators
- Tags by which the device can be classified. Can be added by Defender for Endpoint, Defender for Identity, or by users. Tags from Microsoft Defender for Identity aren't editable.
- Response actions are also located here. Read more about them below.
Overview tab
The default tab is Overview. It provides a quick look at the most important security facts about the device. The Overview tab contains the device details sidebar and a dashboard with some cards displaying high-level information.
Device details
The sidebar lists the device's full name and exposure level. It also provides some important basic information in small subsections, which can be expanded or collapsed, such as:
| Section | Included information |
|---|---|
| VM details | Machine and domain names and IDs, health and onboarding statuses, timestamps for first and last seen, IP addresses, and more |
| DLP policy sync details | If relevant |
| Configuration status | Details regarding Microsoft Defender for Endpoint configuration |
| Cloud resource details | Cloud platform, resource ID, subscription information, and more |
| Hardware and firmware | VM, processor, and BIOS information, and more |
| Device management | Microsoft Defender for Endpoint enrollment status and management info |
| Directory data | UAC flags, SPNs, and group memberships. |
Dashboard
The main part of the Overview tab shows several dashboard-type display cards:
- Active alerts and risk level involving the device over the last six months, grouped by severity
- Security assessments and exposure level of the device
- Logged on users on the device over the last 30 days
- Device health status and other information on the most recent scans of the device.
Tip
Exposure level relates to how much the device is complying with security recommendations, while risk level is calculated based on a number of factors, including the types and severity of active alerts.

Incidents and alerts tab
The Incidents and alerts tab contains a list of incidents that contain alerts that have been raised on the device, from any of a number of Microsoft Defender detection sources, including, if onboarded, Microsoft Sentinel. This list is a filtered version of the incidents queue, and shows a short description of the incident or alert, its severity (high, medium, low, informational), its status in the queue (new, in progress, resolved), its classification (not set, false alert, true alert), investigation state, category, who is assigned to address it, and last activity observed.
You can customize which columns are displayed for each item. You can also filter the alerts by severity, status, or any other column in the display.
The impacted entities column refers to all the device and user entities referenced in the incident or alert.
When an incident or alert is selected, a fly-out appears. From this panel you can manage the incident or alert and view more details such as incident/alert number and related devices. Multiple alerts can be selected at a time.
To see a full page view of an incident or alert, select its title.

Timeline tab
The Timeline tab displays a chronological view of all events that have been observed on the device. This can help you correlate any events, files, and IP addresses in relation to the device.
The choice of columns displayed on the list can both be customized. The default columns list the event time, active user, action type, associated entities (processes, files, IP addresses), and additional information about the event.
You can govern the time period for which events are displayed by sliding the borders of the time period along the overall timeline graph at the top of the page. You can also pick a time period from the drop-down at the top of the list (the default is 30 days). To further control your view, you can filter by event groups or customize the columns.
You can export up to seven days' worth of events to a CSV file, for download.
Drill down into the details of individual events by selecting and event and viewing its details in the resulting flyout panel. See Event details below.
Note
For firewall events to be displayed, you'll need to enable the audit policy, see Audit Filtering Platform connection.
Firewall covers the following events:

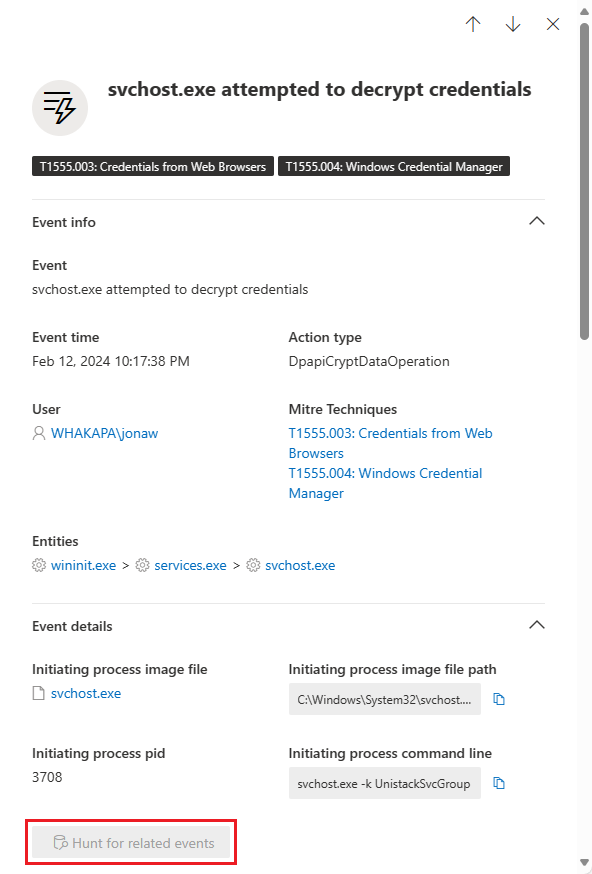
Event details
Select an event to view relevant details about that event. A flyout panel displays to show much more information about the event. The types of information displayed depends on the type of event. When applicable and data is available, you might see a graph showing related entities and their relationships, like a chain of files or processes. You might also see a summary description of the MITRE ATT&CK tactics and techniques applicable to the event.
To further inspect the event and related events, you can quickly run an advanced hunting query by selecting Hunt for related events. The query returns the selected event and the list of other events that occurred around the same time on the same endpoint.
Security recommendations tab
The Security recommendations tab lists actions you can take to protect the device. Selecting an item on this list opens a flyout where you can get instructions on how to apply the recommendation.
As with the previous tabs, the choice of displayed columns can be customized.
The default view includes columns that detail the security weaknesses addressed, the associated threat, the related component or software affected by the threat, and more. Items can be filtered by the recommendation's status.
Learn more about security recommendations.

Inventories tab
This tab displays inventories of four types of components: Software, vulnerable components, browser extensions, and certificates.
Software inventory
This card lists software installed on the device.
The default view displays the software vendor, installed version number, number of known software weaknesses, threat insights, product code, and tags. The number of items displayed and which columns are displayed can both be customized.
Selecting an item from this list opens a flyout containing more details about the selected software, and the path and timestamp for the last time the software was found.
This list can be filtered by product code, weaknesses, and the presence of threats.

Vulnerable components
This card lists software components that contain vulnerabilities.
The default view and filtering options are the same as for software.
Select an item to display more information in a flyout.
Browser extensions
This card shows the browser extensions installed on the device. The default fields displayed are the extension name, the browser for which it's installed, the version, the permission risk (based on the type of access to devices or sites requested by the extension), and the status. Optionally, the vendor can also be displayed.
Select an item to display more information in a flyout.
Certificates
This card displays all the certificates installed on the device.
The fields displayed by default are the certificate name, issue date, expiration date, key size, issuer, signature algorithm, key usage, and number of instances.
The list can be filtered by status, self-signed or not, key size, signature hash, and key usage.
Select a certificate to display more information in a flyout.
Discovered vulnerabilities tab
This tab lists any Common Vulnerabilities and Exploits (CVEs) that may affect the device.
The default view lists the severity of the CVE, the Common Vulnerability Score (CVSS), the software related to the CVE, when the CVE was published, when the CVE was first detected and last updated, and threats associated with the CVE.
As with the previous tabs, the choice of columns to be displayed can be customized. The list can be filtered by severity, threat status, device exposure, and tags.
Selecting an item from this list opens a flyout that describes the CVE.

Missing KBs tab
The Missing KBs tab lists any Microsoft Updates that have yet to be applied to the device. The "KBs" in question are Knowledge Base articles, which describe these updates; for example, KB4551762.
The default view lists the bulletin containing the updates, OS version, the KB ID number, products affected, CVEs addressed, and tags.
The choice of columns to be displayed can be customized.
Selecting an item opens a flyout that links to the update.
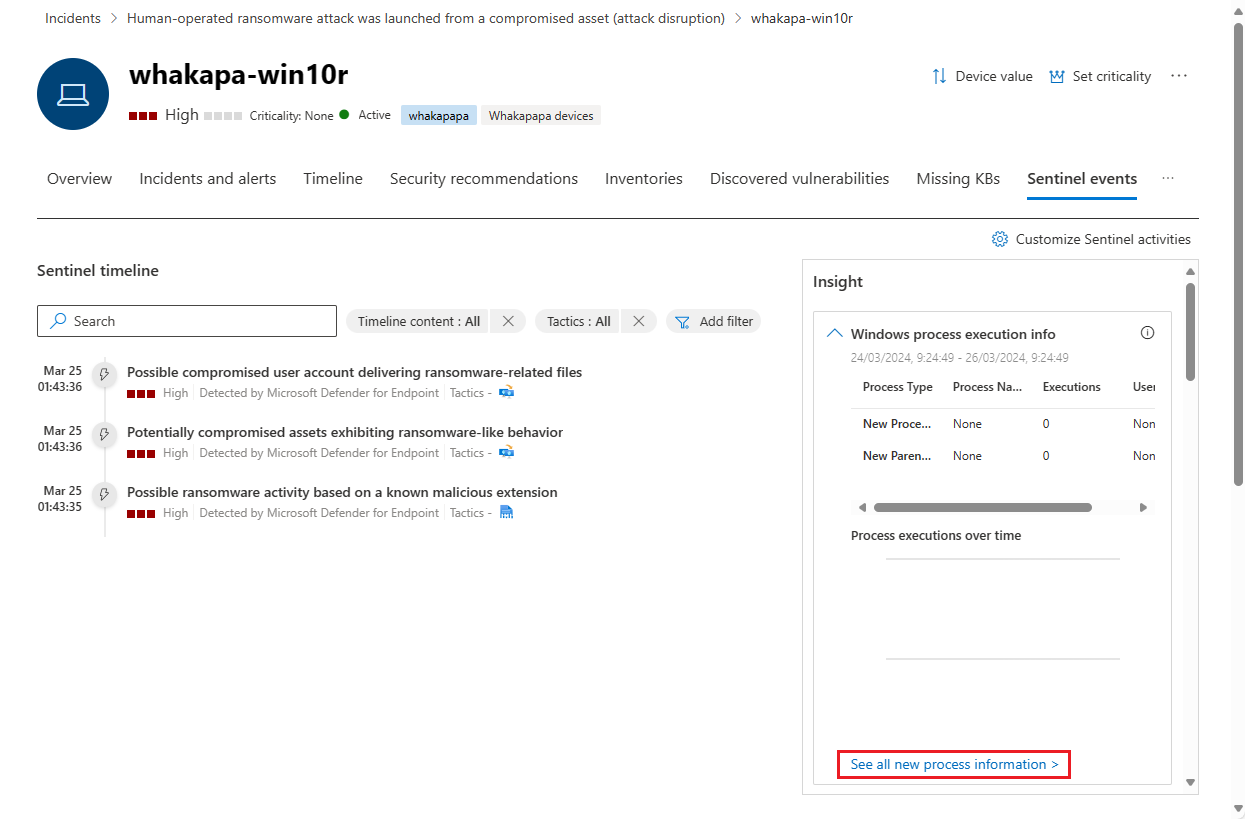
Sentinel events tab
If your organization onboarded Microsoft Sentinel to the Defender portal, this additional tab is on the device entity page. This tab imports the Host entity page from Microsoft Sentinel.
Sentinel timeline
This timeline shows alerts associated with the device entity, known in Microsoft Sentinel as the host entity. These alerts include those seen on the Incidents and alerts tab and those created by Microsoft Sentinel from third-party, non-Microsoft data sources.
This timeline also shows bookmarked hunts from other investigations that reference this user entity, user activity events from external data sources, and unusual behaviors detected by Microsoft Sentinel's anomaly rules.
Insights
Entity insights are queries defined by Microsoft security researchers to help you investigate more efficiently and effectively. These insights automatically ask the big questions about your device entity, providing valuable security information in the form of tabular data and charts. The insights include data regarding sign-ins, group additions, process executions, anomalous events and more, and include advanced machine learning algorithms to detect anomalous behavior.
The following are some of the insights shown:
- Screenshot taken on the host.
- Processes unsigned by Microsoft detected.
- Windows process execution info.
- Windows sign-in activity.
- Actions on accounts.
- Event logs cleared on host.
- Group additions.
- Enumeration of hosts, users, groups on host.
- Microsoft Defender Application Control.
- Process rarity via entropy calculation.
- Anomalously high number of a security event.
- Watchlist insights (Preview).
- Windows Defender Antivirus events.
The insights are based on the following data sources:
- Syslog (Linux)
- SecurityEvent (Windows)
- AuditLogs (Microsoft Entra ID)
- SigninLogs (Microsoft Entra ID)
- OfficeActivity (Office 365)
- BehaviorAnalytics (Microsoft Sentinel UEBA)
- Heartbeat (Azure Monitor Agent)
- CommonSecurityLog (Microsoft Sentinel)
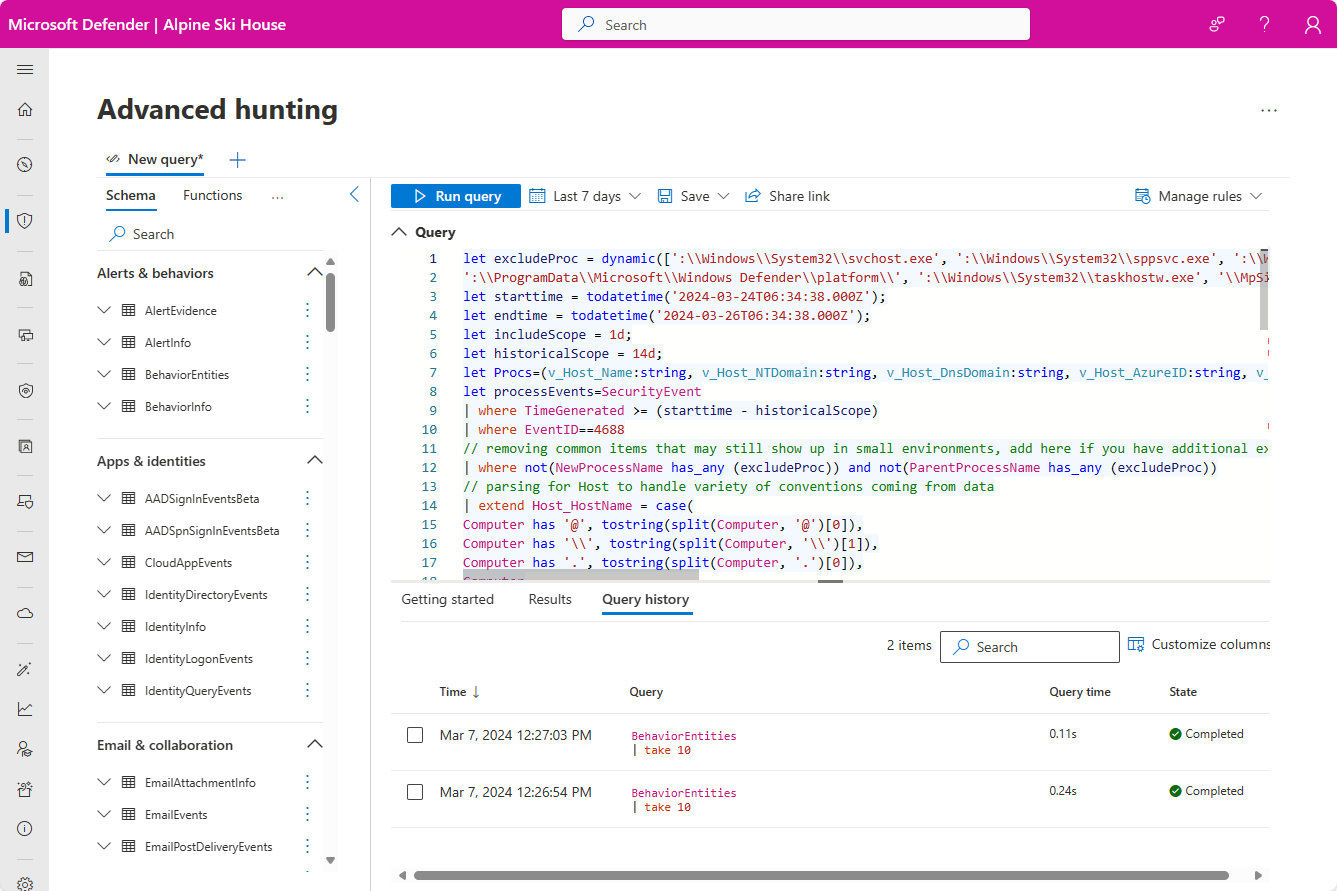
If you want to further explore any of the insights in this panel, select the link accompanying the insight. The link takes you to the Advanced hunting page, where it displays the query underlying the insight, along with its raw results. You can modify the query or drill down into the results to expand your investigation or just satisfy your curiosity.
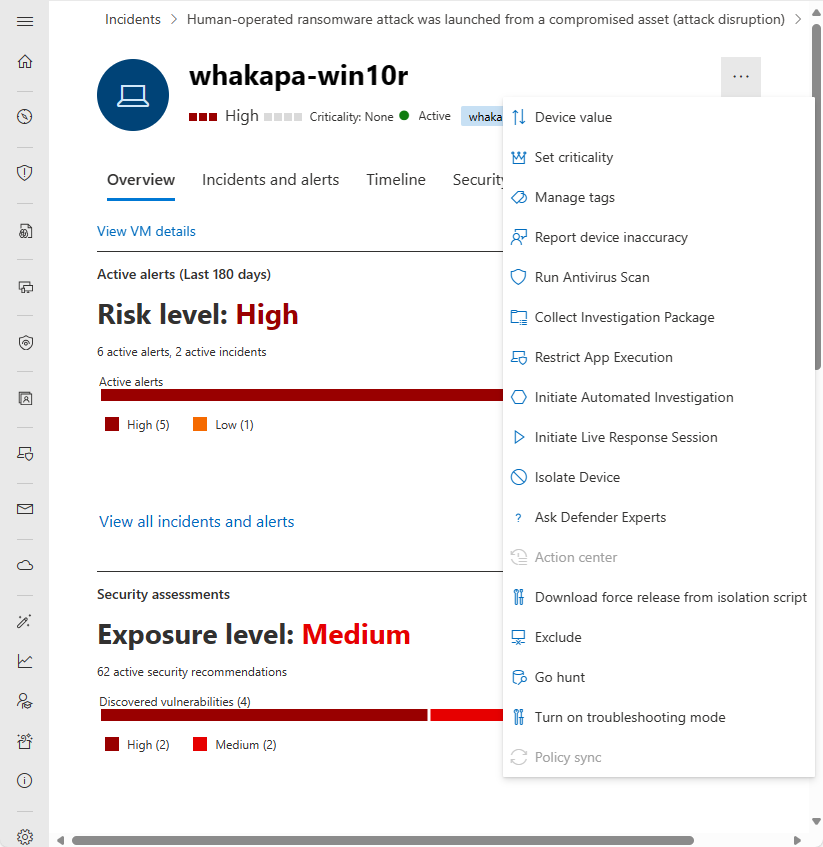
Response actions
Response actions offer shortcuts to analyze, investigate, and defend against threats.
Important
- Response actions are only available if the device is enrolled in Microsoft Defender for Endpoint.
- Devices that are enrolled in Microsoft Defender for Endpoint may display different numbers of response actions, based on the device's OS and version number.
Response actions run along the top of a specific device page and include:
| Action | Description |
|---|---|
| Device value | |
| Set criticality | |
| Manage tags | Updates custom tags you've applied to this device. |
| Report device inaccuracy | |
| Run Antivirus Scan | Updates Microsoft Defender Antivirus definitions and immediately runs an antivirus scan. Choose between Quick scan or Full scan. |
| Collect Investigation Package | Gathers information about the device. When the investigation is completed, you can download it. |
| Restrict app execution | Prevents applications that aren't signed by Microsoft from running. |
| Initiate automated investigation | Automatically investigates and remediates threats. Although you can manually trigger automated investigations to run from this page, certain alert policies trigger automatic investigations on their own. |
| Initiate Live Response Session | Loads a remote shell on the device for in-depth security investigations. |
| Isolate device | Isolates the device from your organization's network while keeping it connected to Microsoft Defender. You can choose to allow Outlook, Teams, and Skype for Business to run while the device is isolated, for communication purposes. |
| Ask Defender Experts | |
| Action Center | Displays information about any response actions that are currently running. Only available if another action has already been selected. |
| Download force release from isolation script | |
| Exclude | |
| Go hunt | |
| Turn on troubleshooting mode | |
| Policy sync |
Related topics
- Microsoft Defender XDR overview
- Turn on Microsoft Defender XDR
- User entity page in Microsoft Defender
- IP address entity page in Microsoft Defender
- Microsoft Defender XDR integration with Microsoft Sentinel
- Connect Microsoft Sentinel to Microsoft Defender XDR (preview)
Tip
Do you want to learn more? Engage with the Microsoft Security community in our Tech Community: Microsoft Defender XDR Tech Community.
Feedback
Coming soon: Throughout 2024 we will be phasing out GitHub Issues as the feedback mechanism for content and replacing it with a new feedback system. For more information see: https://aka.ms/ContentUserFeedback.
Submit and view feedback for