Console overview
The Console is like an intelligent, rich command line within DevTools, and is great companion tool to use with others tools. The Console provides a powerful way to script functionality, inspect the current webpage, and manipulate the current webpage using JavaScript.
The Console tool helps with several tasks, which are covered in more detail in the following articles:
- Track down problems to find out why something isn't working in the current project. See Fix JavaScript errors that are reported in the Console.
- Get information about the web project in the browser as log messages. See Filter Console messages.
- Log information in scripts for debugging purposes. See Log messages in the Console tool.
- Try JavaScript expressions live in a REPL environment. See Run JavaScript in the Console.
- Interact with the web project in the browser using JavaScript. See Interact with the DOM using the Console.
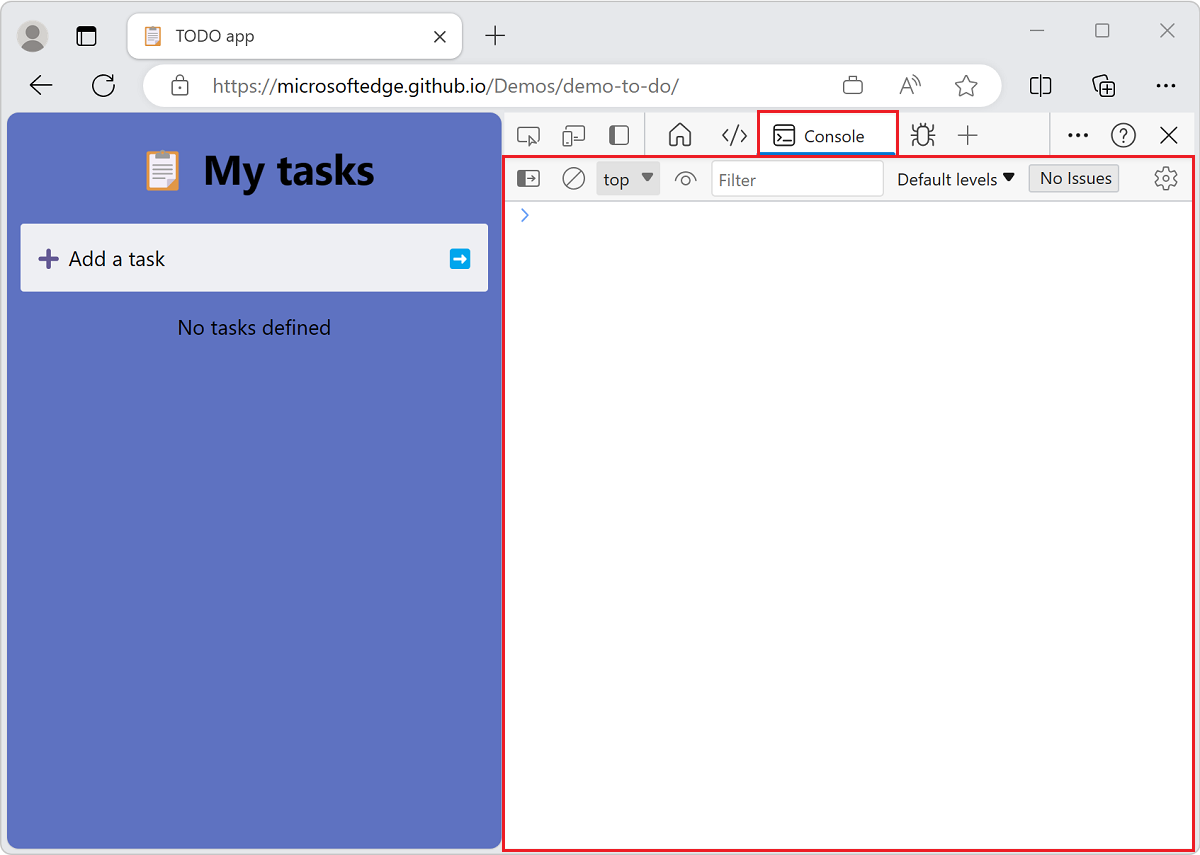
You can open the Console tool in the top or bottom of DevTools; it's shown here in upper part, on the Activity Bar:
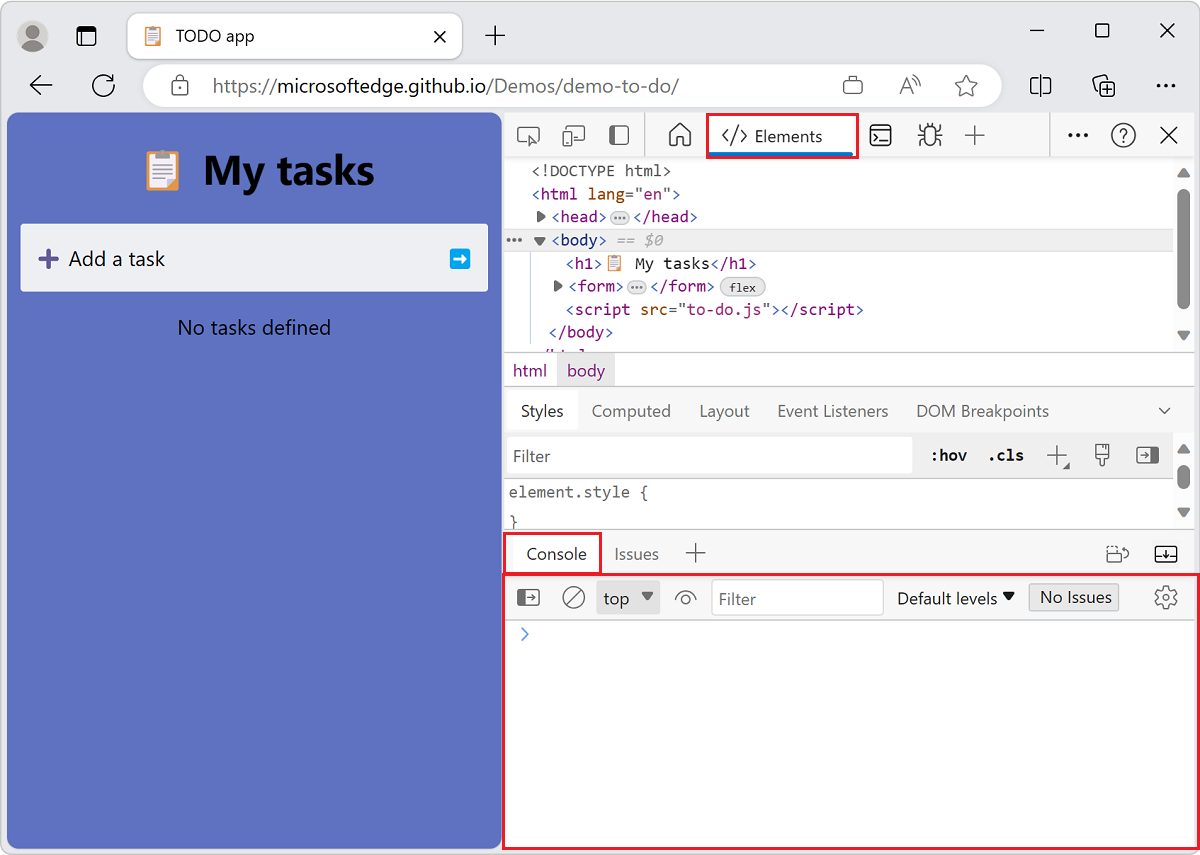
The Console is shown here in the lower part of DevTools (the Quick View panel), with the Elements tool open above it:
The fastest way to directly open the Console is to press Ctrl+Shift+J (Windows, Linux) or Command+Option+J (macOS).
Error reports and the Console
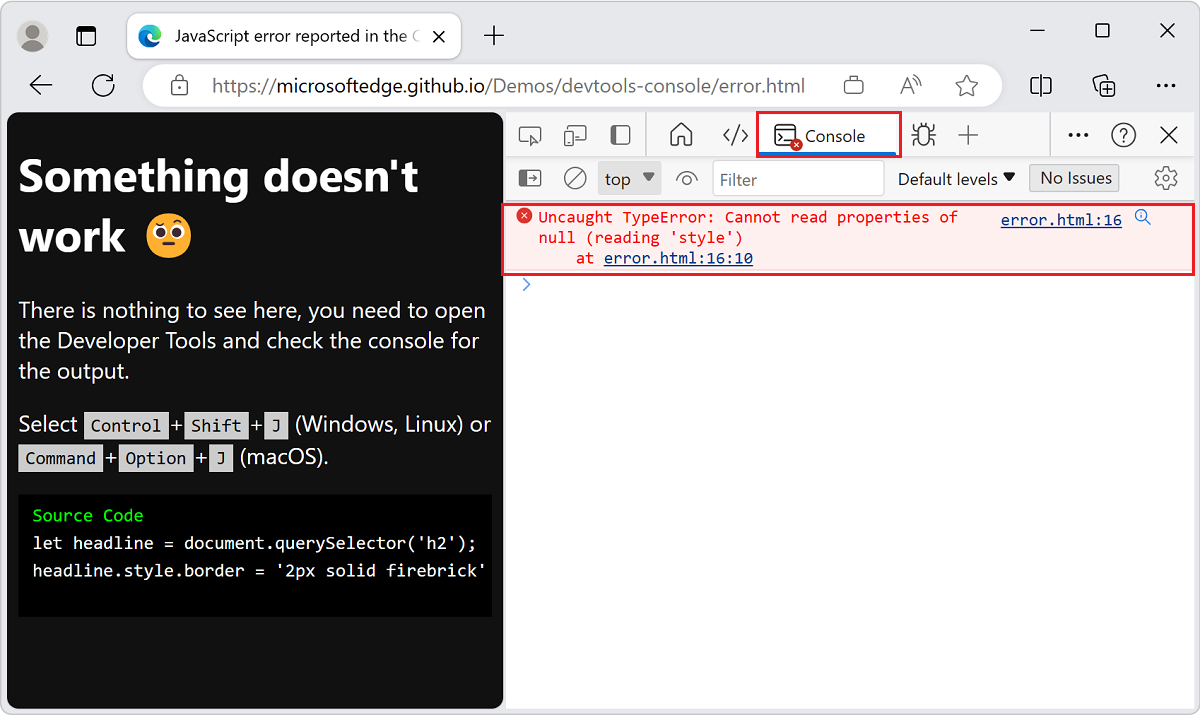
The Console is the default place where JavaScript and connectivity errors are reported. For more information, see Fixing JavaScript errors that are reported in the Console.
DevTools gives detailed information about the error in the Console:
Search the web for a Console error message string
Search the web for your Console error messages, right from within DevTools. In the Console, many error messages have a Search for this message on the Web button, shown as a magnifying glass:
![]()
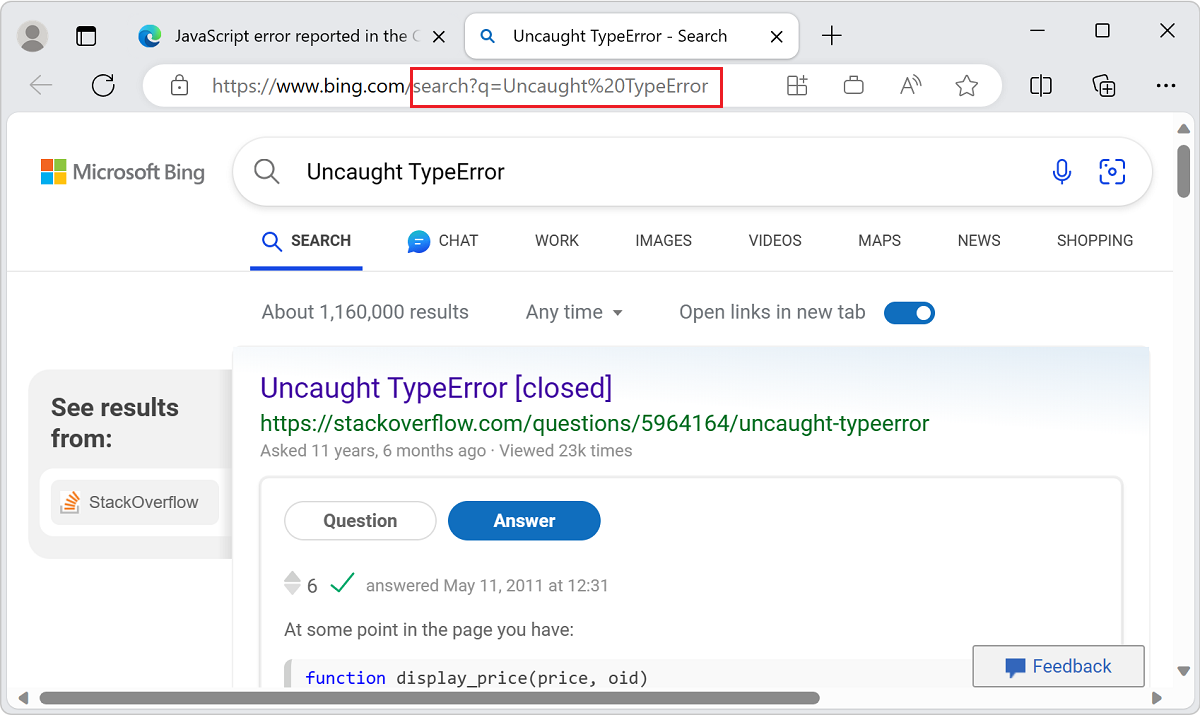
When you click the Search for this message on the Web button, a new tab opens in the browser and shows search results for the error message:
Inspect and filter information on the current webpage
When you open DevTools on a webpage, there may be an overwhelming amount of information in the Console. The amount of information becomes a problem when you need to identify important information. To view the important information that needs action, use the Issues tool in DevTools.
Issues are gradually being moved from the Console to the Issues tool. However, there's still a lot of information in the Console, which is why it's a good idea to know about the automated log and filter options in the Console. For more information, see Filter Console messages.
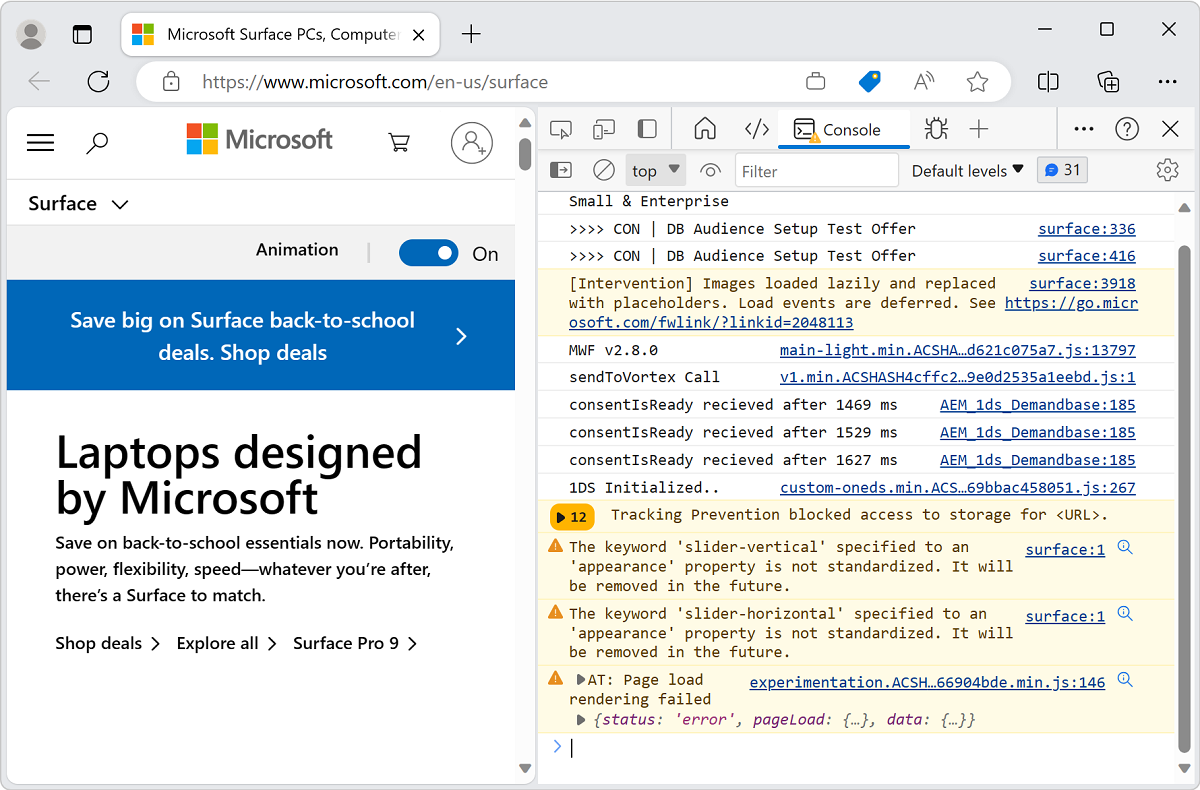
DevTools with a Console full of messages:
Log information to display in the Console
The most popular use case for the Console is logging information from your scripts using the console.log() method or other similar methods.
Example code
// prints the text to the console as  a log message
console.log('This is a log message');

// prints the text to the console as an informational message
console.info('This is some information');

// prints the text to the console as an error message
console.error('This is an error');

// prints the text to the console as a warning
console.warn('This is a warning');

// prints the geometry of the document body as an object
console.log(document.body.getBoundingClientRect());

// prints the geometry of the document body as a table
console.table(document.body.getBoundingClientRect());

// shows a list of techologies as a collapsed group
let technologies = ["HTML", "CSS", "SVG", "ECMAScript"];
console.groupCollapsed('Technolgies');
technologies.forEach(tech => {console.info(tech);})
console.groupEnd('Technolgies');
To log information to display in the Console:
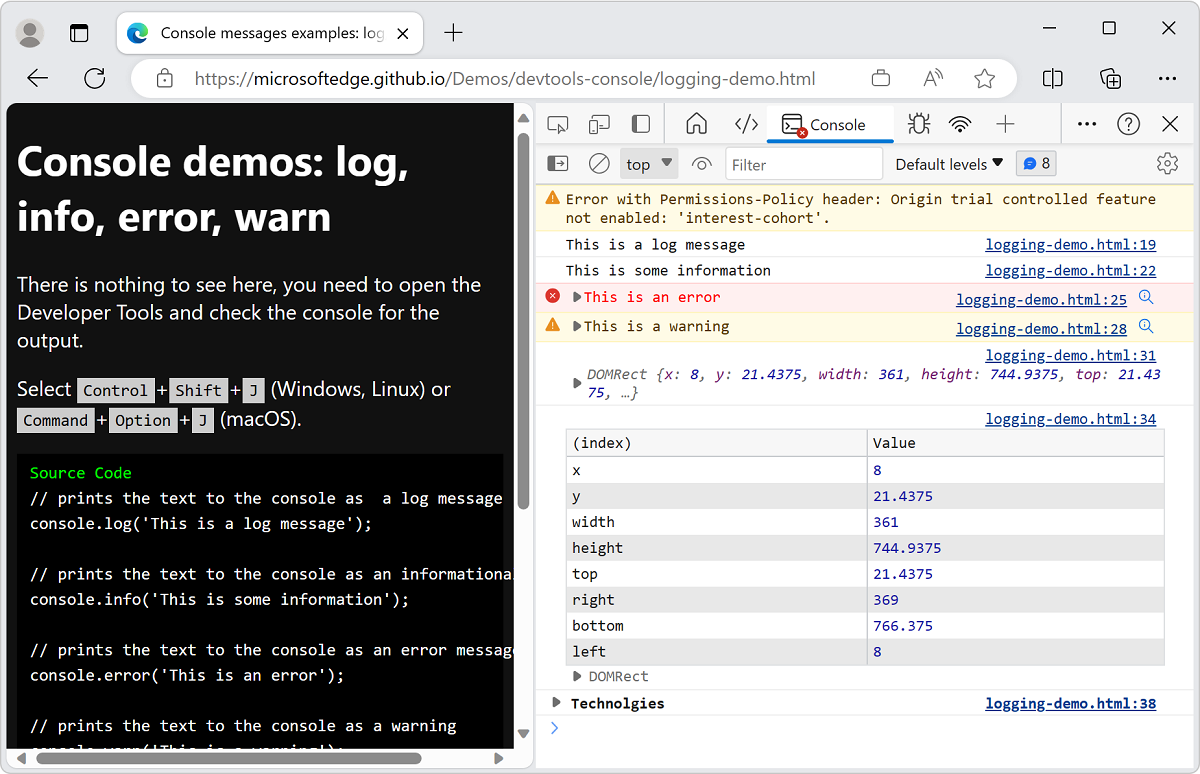
Open the demo webpage Console messages examples: log, info, error and warn in a new window or tab.
To open the Console, press Ctrl+Shift+J (Windows, Linux) or Command+Option+J (macOS).
The Console displays the resulting messages that are caused by the demo code:
Paste the above code into the Console, and then press Enter.
If you get a message:
Uncaught SyntaxError: Identifier 'technologies' has already been declared:Open a new tab or window.
To open the Console, press Ctrl+Shift+J (Windows, Linux) or Command+Option+J (macOS).
Paste the above code into the Console, and then press Enter.
Many useful methods are available when you work with the Console. For more information, see Log messages in the Console tool.
Try your JavaScript live in the Console
The Console isn't only a place to log information. The Console is a REPL environment. When you write any JavaScript in the Console, the code runs immediately. You may find it useful to test some new JavaScript features or to do some quick calculations. Also, you get all of the features you expect from a modern editing environment, such as autocompletion, syntax highlighting, and history.
To try running JavaScript in the Console:
Open the Console.
Type
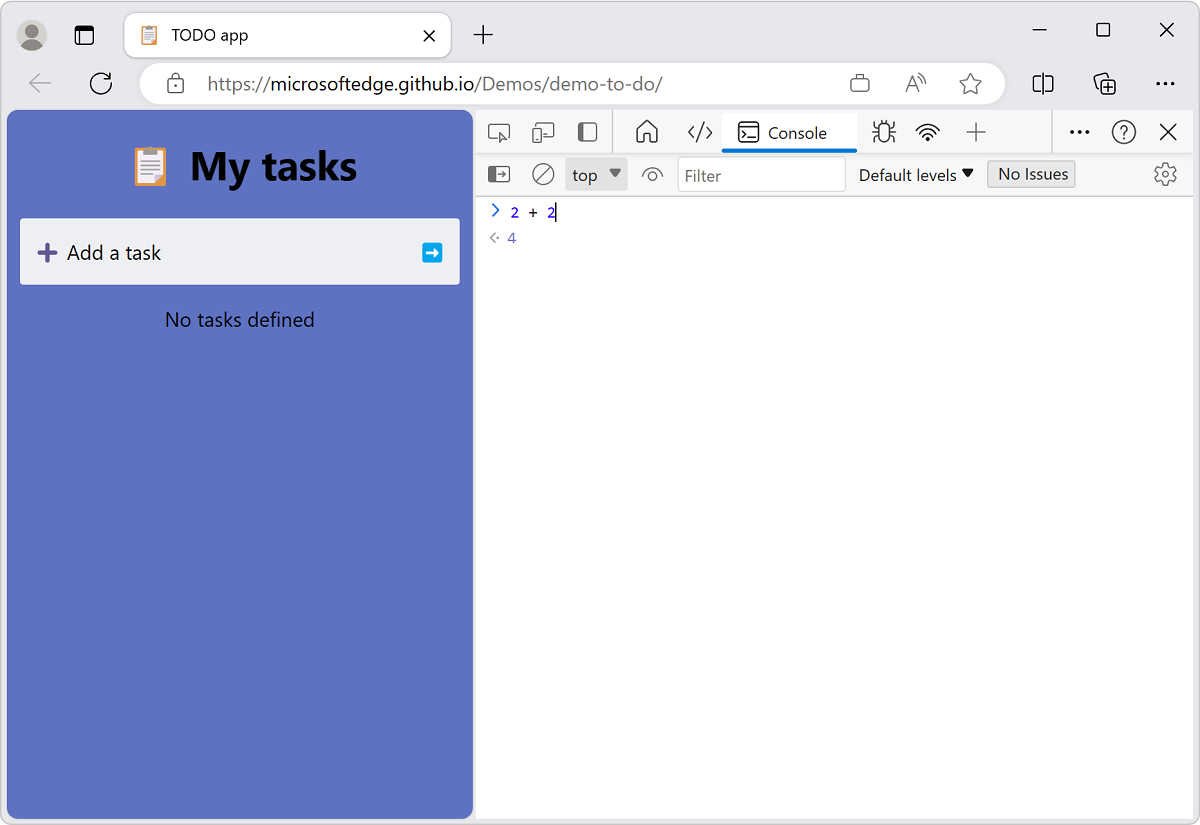
2+2.
The Console displays the result of 2+2 live as you type it, displaying the result 4 on the following line:
This Eager evaluation feature is useful to debug and verify that you aren't making mistakes in your code.
To run the JavaScript expression in the Console and optionally display a result, press Enter. Then, you can write the next JavaScript code to run in the Console.
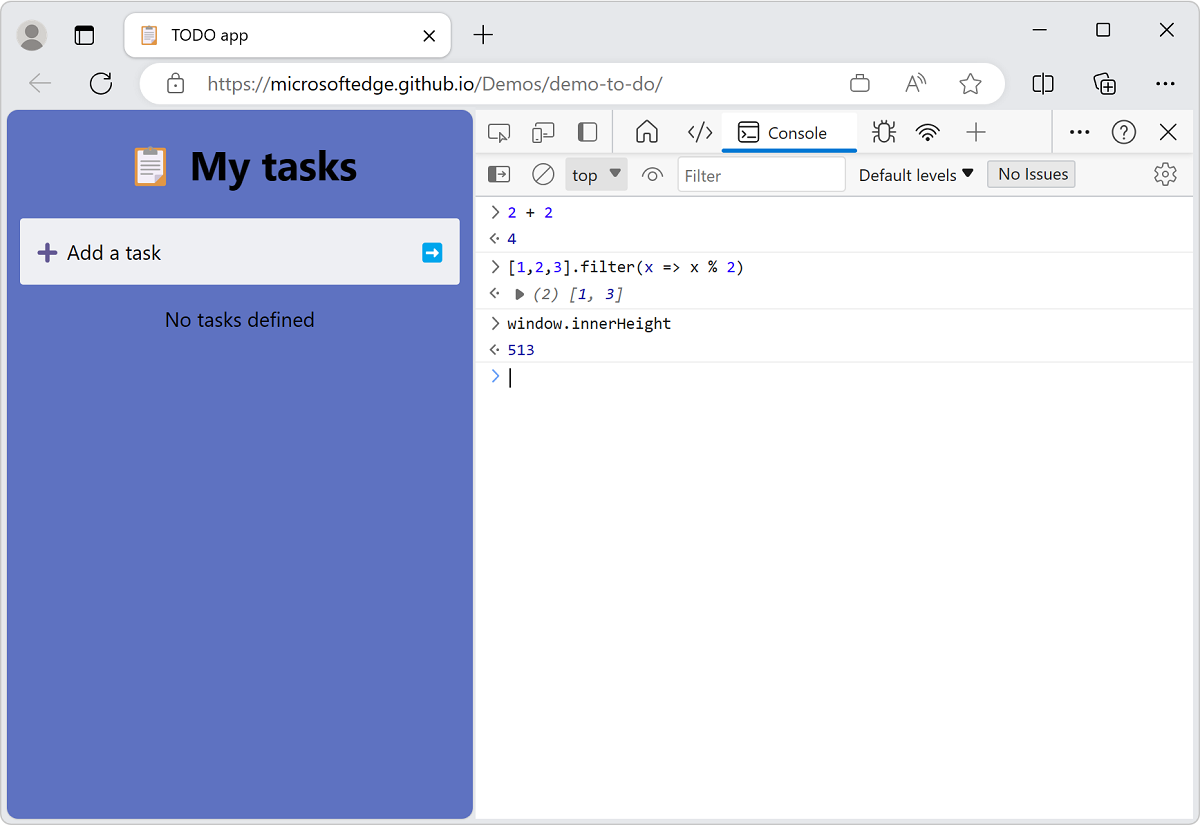
Running several lines of JavaScript code in succession:
By default, you run JavaScript code on a single line. To run a line, type your JavaScript and then press Enter. To work around the single-line limitation, press Shift+Enter instead of Enter.
Similar to other command-line experiences, to access your previous JavaScript commands, press Up Arrow. The autocompletion feature of the Console is a great way to learn about unfamiliar methods.
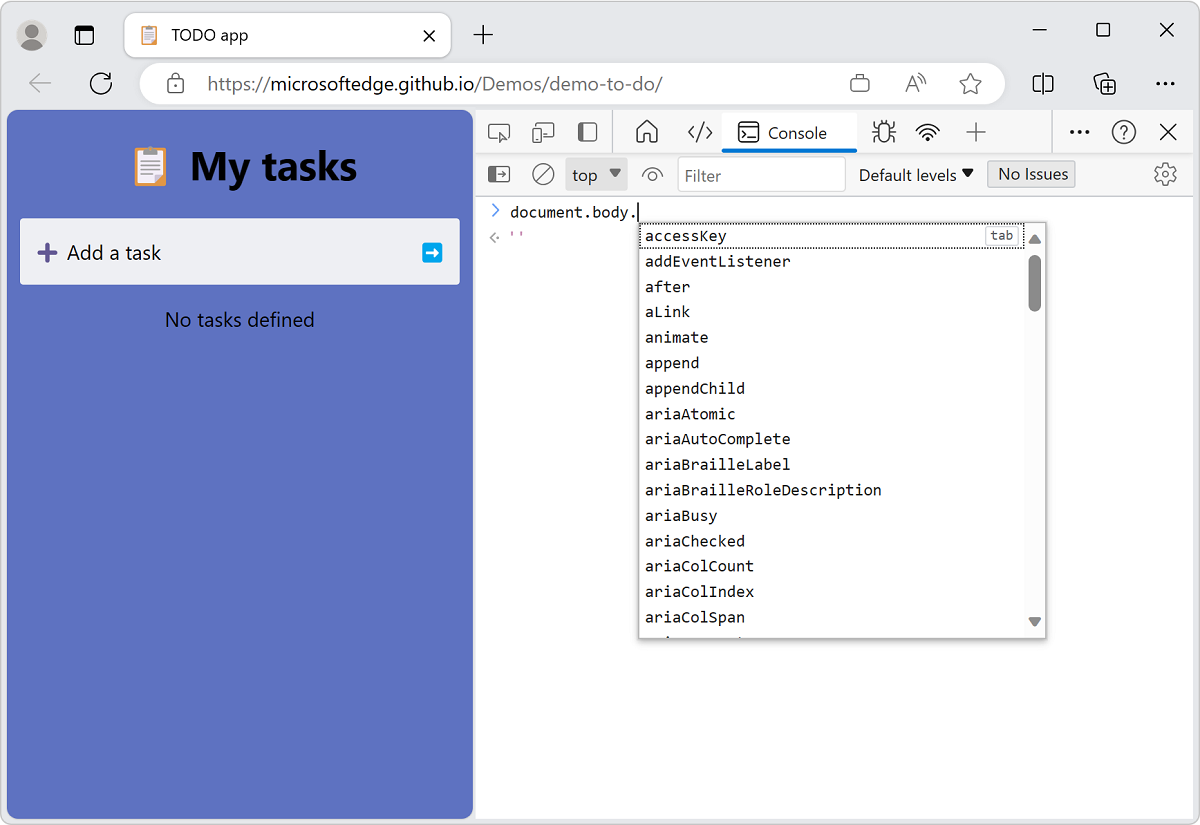
To try autocompletion:
- Open the Console.
- Type
doc. - Select
documentfrom the dropdown menu. - Press Tab to select
document. - Type
.bo. - Press Tab to select
document.body. - Type another
.to display the complete list of properties and methods available on the body of the current webpage.
For more information about all the ways to work with Console, see Console as a JavaScript environment.
Autocompletion of JavaScript expressions in the Console:
Interact with the current webpage in the browser
The Console has access to the Window object of the browser. You can write scripts that interact with the current webpage, by reading data from the DOM and assigning data to DOM elements.
Reading from the DOM tree in the Console
To use a JavaScript expression to read from the current page by reading a selected element from the DOM tree:
Open the Console.
Paste the following code into the Console, and then press Enter:
document.querySelector('h1').innerHTMLThis expression selects the first heading-level 1 from the DOM and then selects the HTML content that's contained between the
<h1>start and end tags. The Console displays the output of the expression, which is the text of the heading: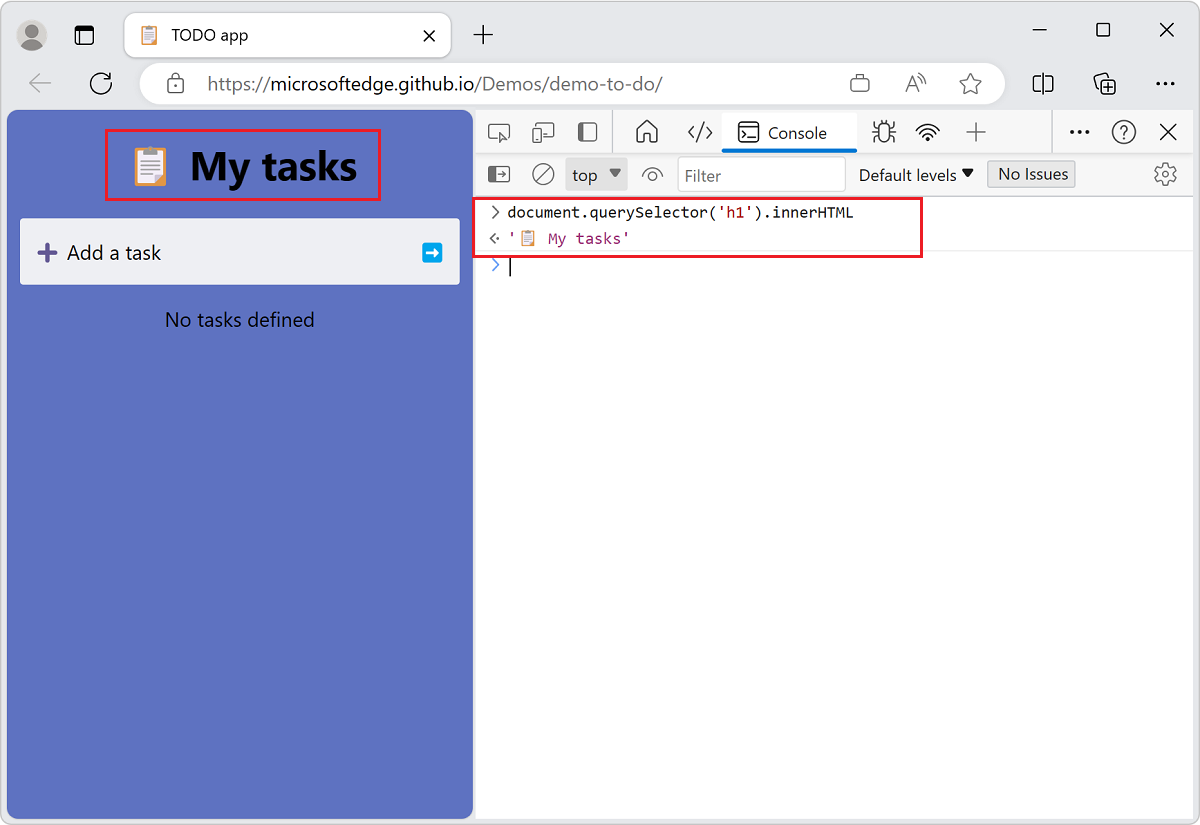
You have read from the DOM representation of the webpage, by entering a JavaScript expression in the Console and displaying the output in the Console.
Writing to the DOM tree and webpage from the Console
You can also change the rendered webpage, by changing the DOM (or writing to the DOM), from within the Console.
To change the rendered webpage:
Open the Console.
Paste the following code into the Console, and then press Enter:
document.querySelector('h1').innerHTML = 'Rocking the Console';The above JavaScript expression uses the
=sign to assign a value to the selected DOM item. The evaluated value of the expression is a string for a heading, in this example. The expression's value (the heading string) is shown both in the Console and in the rendered webpage: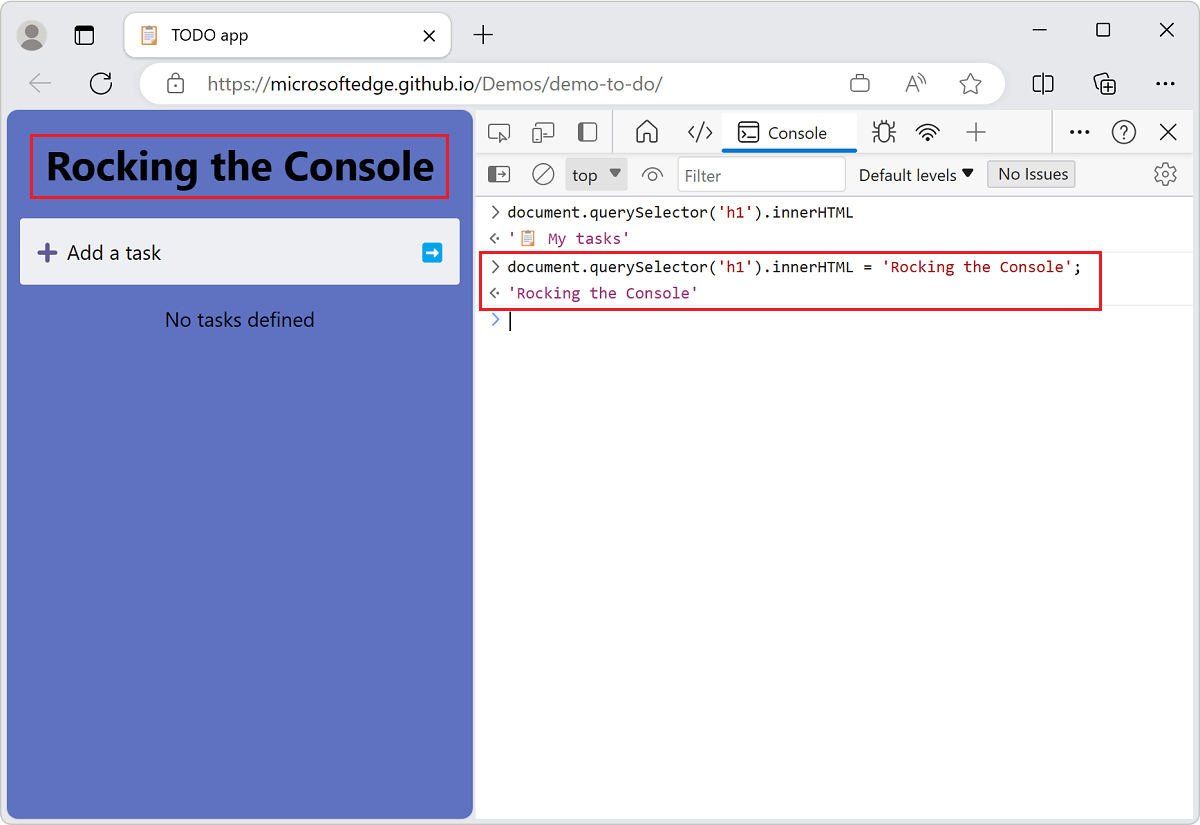
You changed the main heading of the webpage to Rocking the Console.
Using the $$ Console utility method to
The Console Utility methods make it easy to access and manipulate the current webpage.
For example, to add a green border around all the links in the current webpage:
Open the Console.
Paste the following code into the Console, and then press Enter:
$$('a').forEach(a => a.style.border='1px solid lime');The
$$(selector)console utility function is "Query selector all". This DOM query selector function returns an array of all the elements that match the specified CSS selector, like the JavaScript functiondocument.querySelectorAll(). In this example, we select all the<a>hyperlink elements and then apply a green box around them: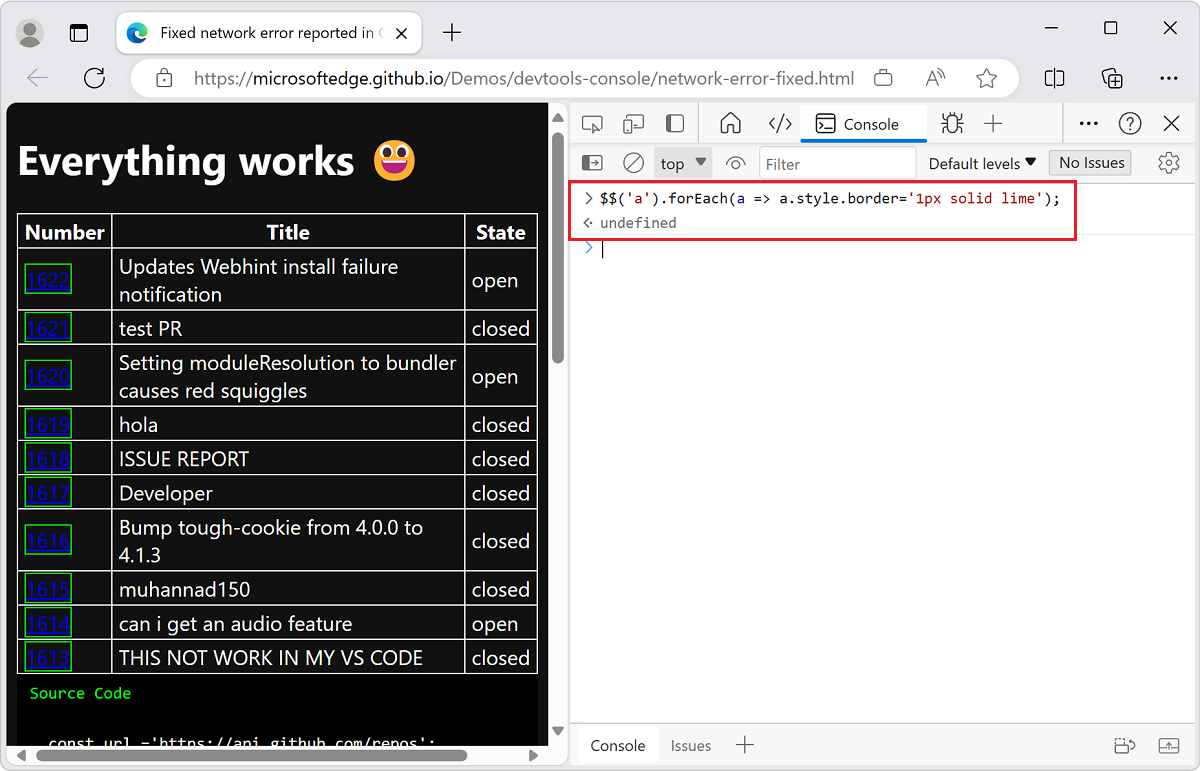
For more information, see Console tool utility functions and selectors.
See also
Feedback
Coming soon: Throughout 2024 we will be phasing out GitHub Issues as the feedback mechanism for content and replacing it with a new feedback system. For more information see: https://aka.ms/ContentUserFeedback.
Submit and view feedback for