When you know the name of a webpage's resource file that you want to inspect, the Command Menu in DevTools provides a fast way of finding and opening that resource.
To open DevTools, right-click the webpage, and then select Inspect. Or press Ctrl+Shift+I (Windows, Linux) or Command+Option+I (macOS).
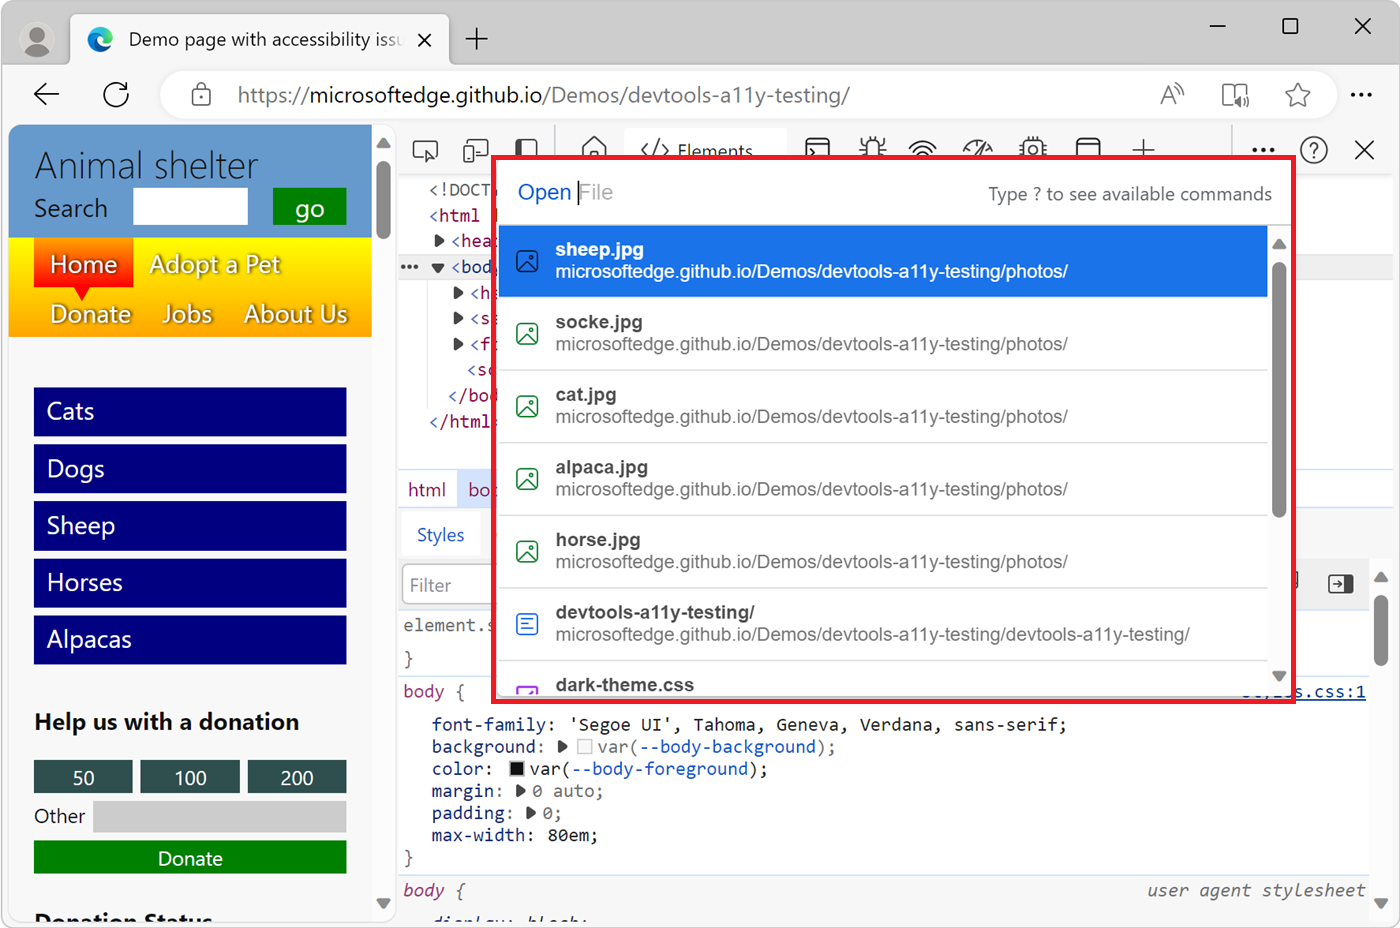
When DevTools has focus, press Ctrl+P (Windows, Linux) or Command+P (macOS). Or, click the Customize and control DevTools () button in DevTools and then select Open file. The Command Menu opens, displaying the Open File list:
If there's a greater-than (>) prompt, press Backspace to get to the Open File prompt.
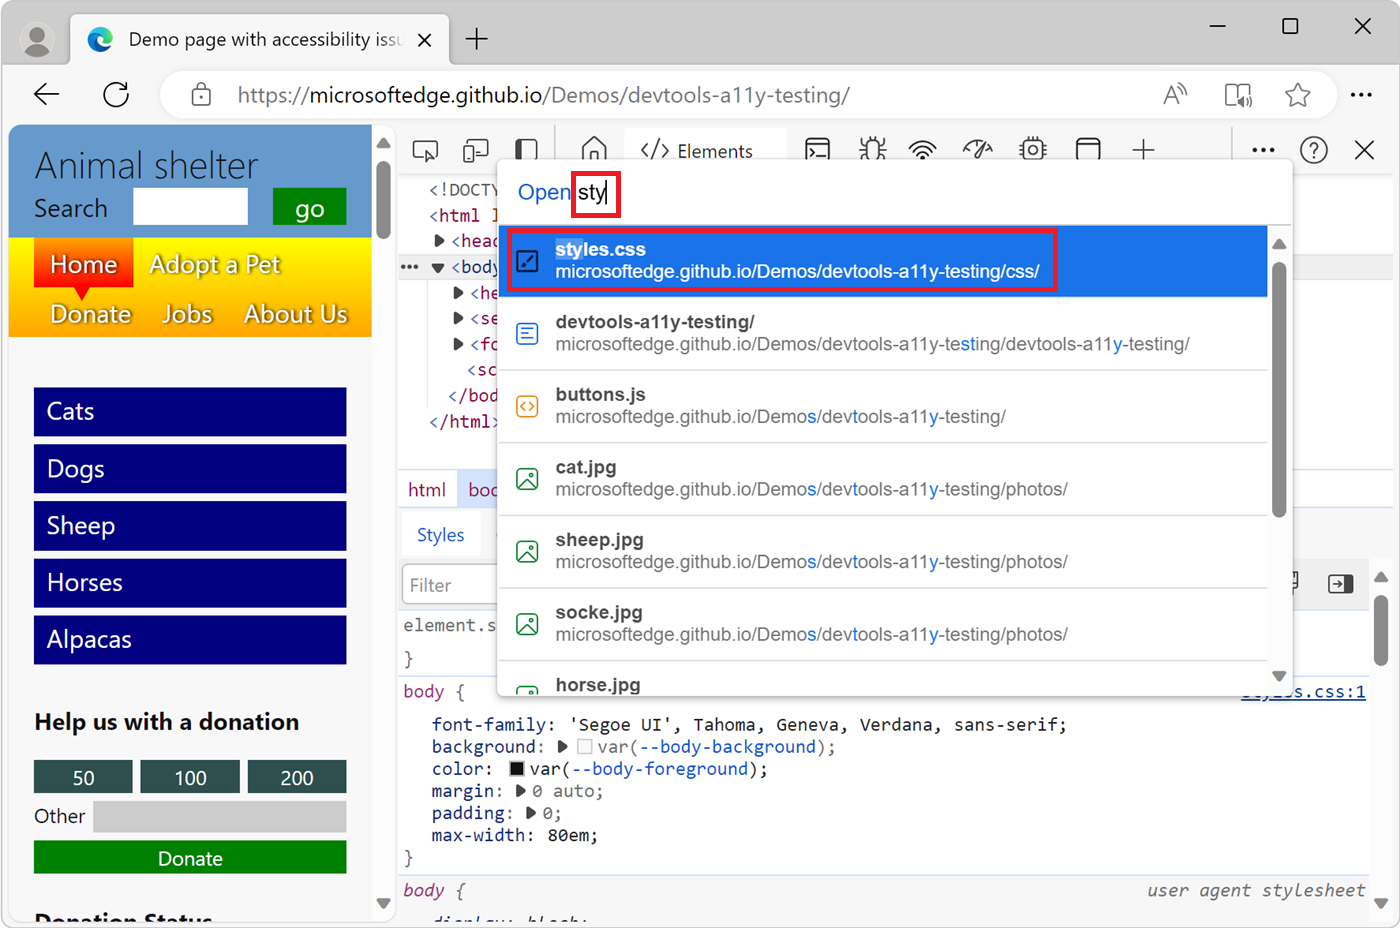
Start typing the file name, and then press Enter when the correct file is highlighted in the autocomplete box, or select the file from the dropdown list:
Browse resource files in the Network tool
In the Network tool, you can inspect the resource files that make up the current webpage, such as .html, .css, .js, and image files. To learn how to get the details for a specific resource, see Inspect the details of the resource in Inspect network activity.
To open DevTools, right-click the webpage, and then select Inspect. Or, press Ctrl+Shift+I (Windows, Linux) or Command+Option+I (macOS). DevTools opens.
In DevTools, on the Activity Bar, select the Network tab. If that tab isn't visible, click the More Tools () button.
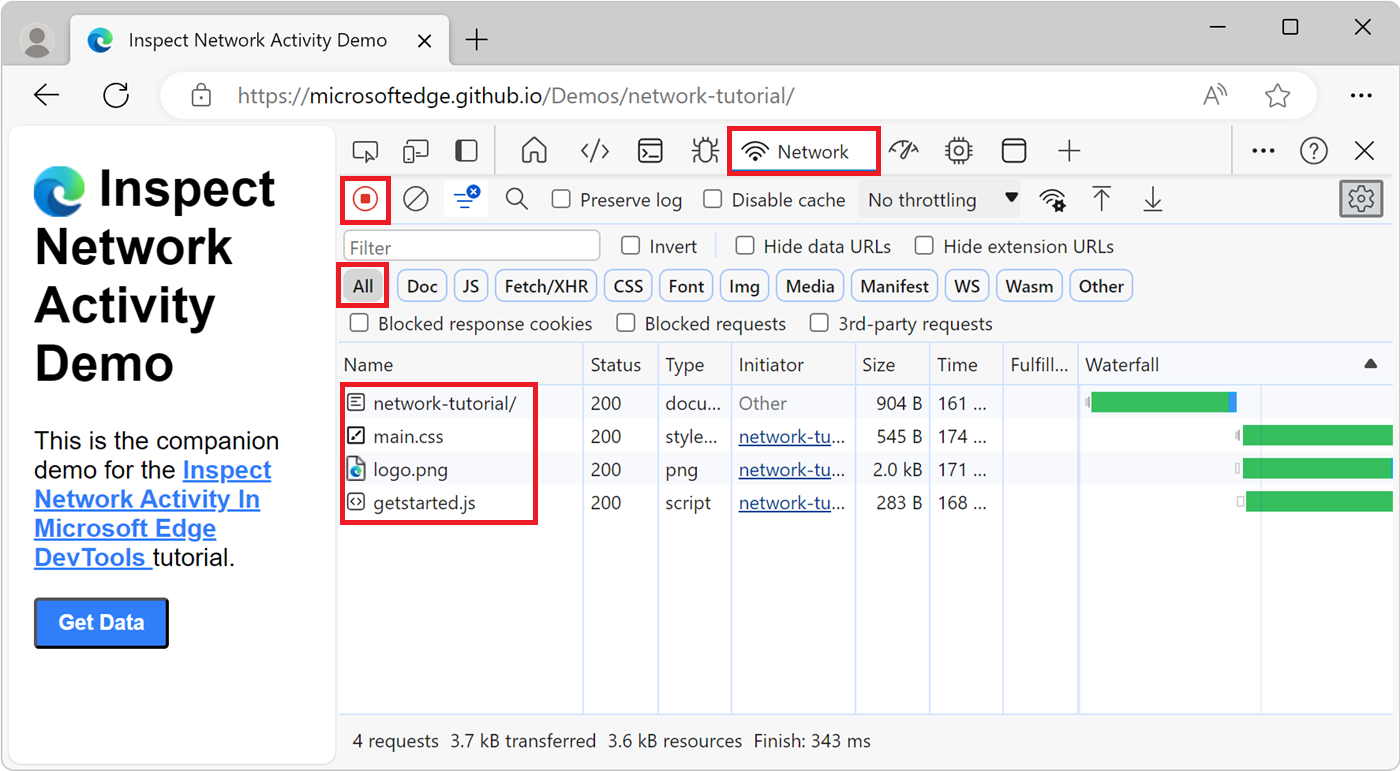
Make sure the Record network log button in the upper left is selected (red).
Refresh the page. By default, the All filter button is selected, so all the webpage's resource files are listed in the Network tool, one row per resource file:
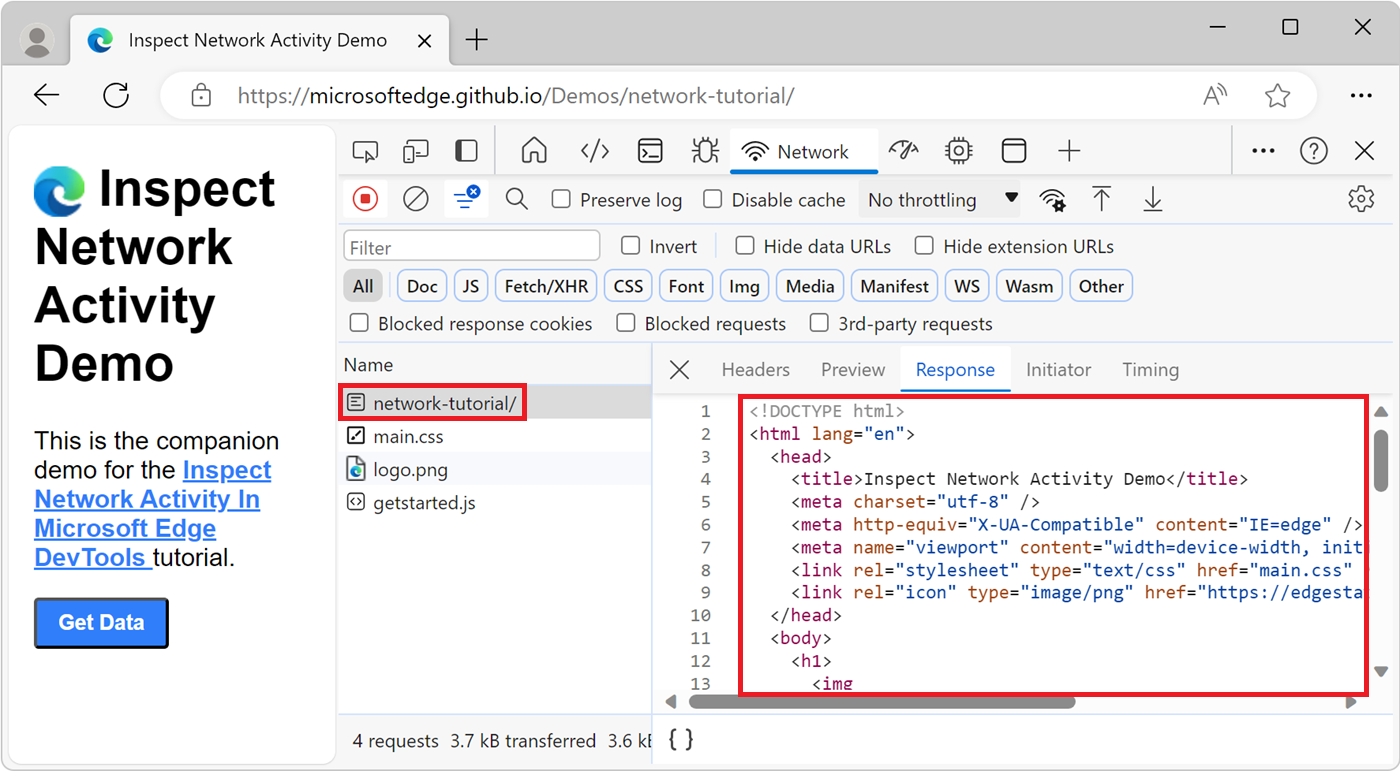
Select a resource to view it. For example, select the network-tutorial path to display index.html:
To learn more about how to show the network activity that's generated by the page resources, see Log network activity in the article Inspect network activity.
Browse resource files by file type by filtering in the Network tool
In the Network tool, when you view the list of resource files that make up the current webpage, you can filter which type of resources to list, such as only showing .css or .js files.
To open DevTools, right-click the webpage, and then select Inspect. Or, press Ctrl+Shift+I (Windows, Linux) or Command+Option+I (macOS). DevTools opens.
In DevTools, on the Activity Bar, select the Network tab. If that tab isn't visible, click the More Tools () button.
Refresh the page. By default, the All filter button is selected, so all the webpage's resource files are listed in the Network tool.
Click CSS to filter and only display CSS files. Only the main.css file is listed:
Show resource files in the Network tool from other tools
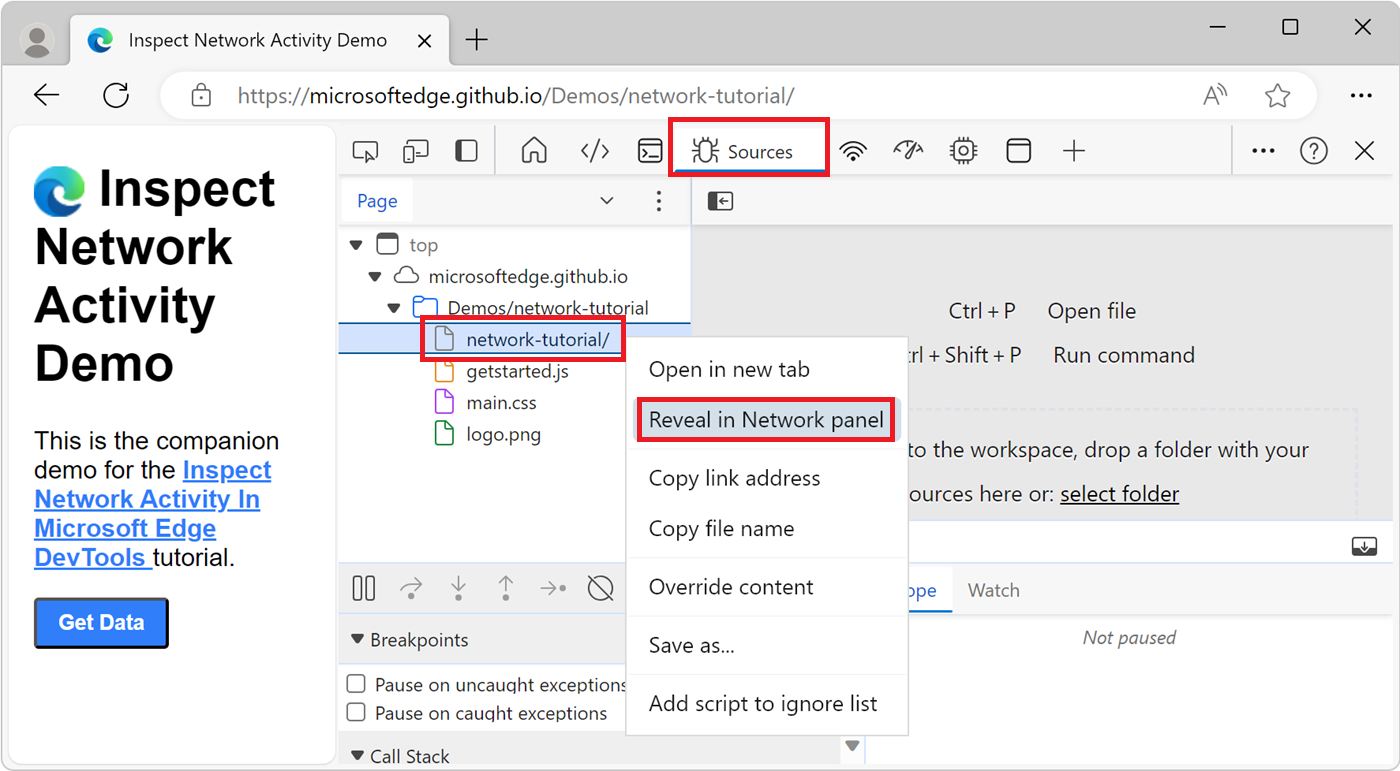
In various tools that list resource files for the webpage, to inspect a resource file in the Network tool, right-click the resource file and then select Reveal in Network panel. You may need to first refresh the webpage while the Network tool is open.
For example, to go from the Page tab's resource list in the Sources tool to the Network tool:
To open DevTools, right-click the webpage, and then select Inspect. Or, press Ctrl+Shift+I (Windows, Linux) or Command+Option+I (macOS). DevTools opens.
In DevTools, on the Activity Bar, select the Network tab. If that tab isn't visible, click the More Tools () button.
Press Ctrl+R to refresh the page. The received resource files that make up the webpage are now added as rows in the Network tab. The network-tutorial/ folder row represents the HTML page - in this case, index.html.
In DevTools, on the Activity Bar, click the Sources tab.
In the Page tab in the upper left, right-click a resource file, and then select Reveal in Network panel:
If the Reveal in Network panel menuitem isn't listed, go to the Network tool, make sure the Record network log button in the upper left is selected (red), and then refresh the page.
Browse resource files by folder in the Page tab of the Sources tool
You can use the Sources tool to view the webpage's resource files organized by directory, as follows:
To open DevTools, right-click the webpage, and then select Inspect. Or, press Ctrl+Shift+I (Windows, Linux) or Command+Option+I (macOS). DevTools opens.
In DevTools, on the Activity Bar, select the Sources tab. If that tab isn't visible, click the More tools () button.
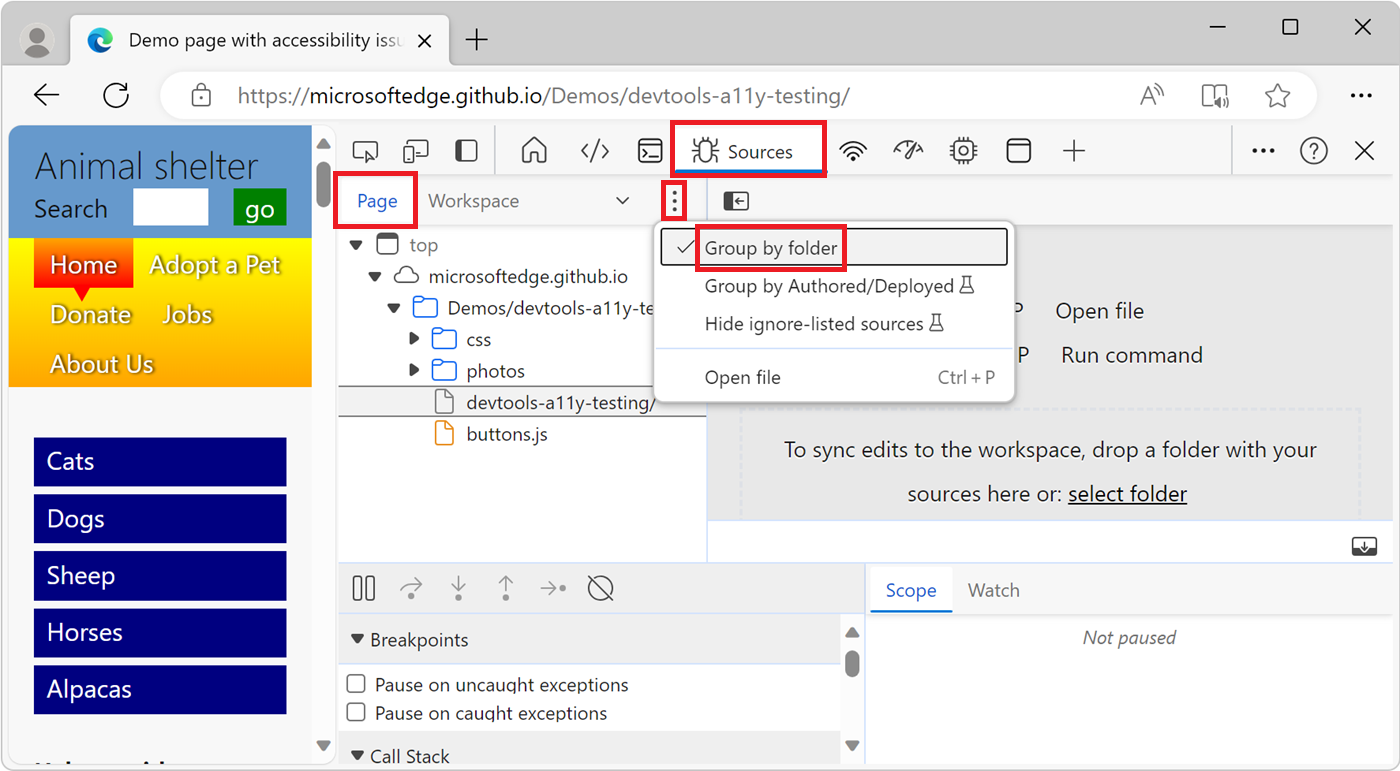
In the Navigator pane in the upper left, select the Page tab.
By default, resource files are grouped by folder. If the resources are all listed alphabetically by file name instead, click the More options () button to the right of the Page tab, and then select Group by folder:
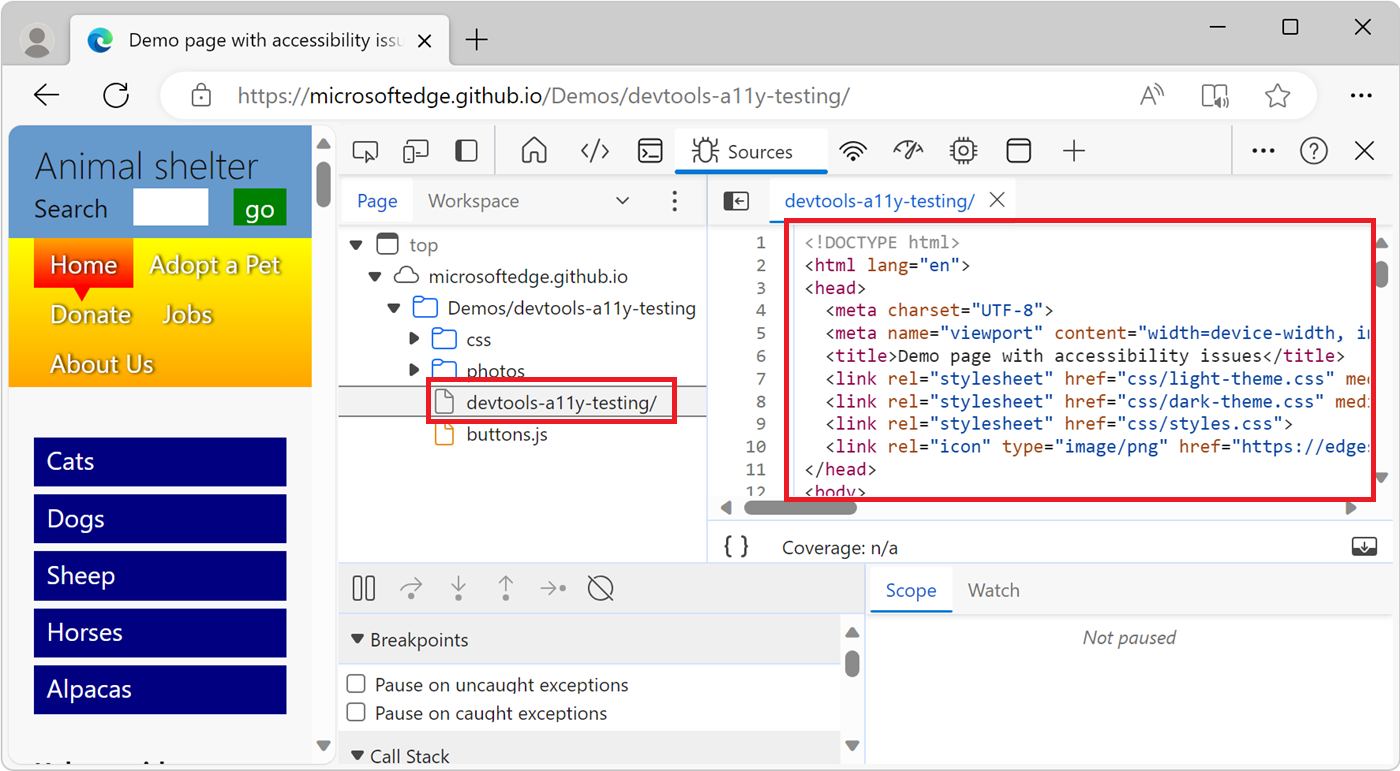
The Page tab contains various node types, including:
Select a resource file to view it in the Editor of the Sources tool:
Browse resource files sorted by file name in the Page tab of the Sources tool
By default, the Page tab in the Sources tool groups resource files by folder. To instead display all the resource files for each domain grouped together in a single alphabetized list:
To open DevTools, right-click the webpage, and then select Inspect. Or, press Ctrl+Shift+I (Windows, Linux) or Command+Option+I (macOS). DevTools opens.
In DevTools, on the Activity Bar, select the Sources tab. If that tab isn't visible, click the More tools () button.
In the Navigator pane in the upper left, select the Page tab.
Click More options () and then clear the Group by folder option:
All the resource files for each domain (such as Top) are grouped together in a single alphabetized list:
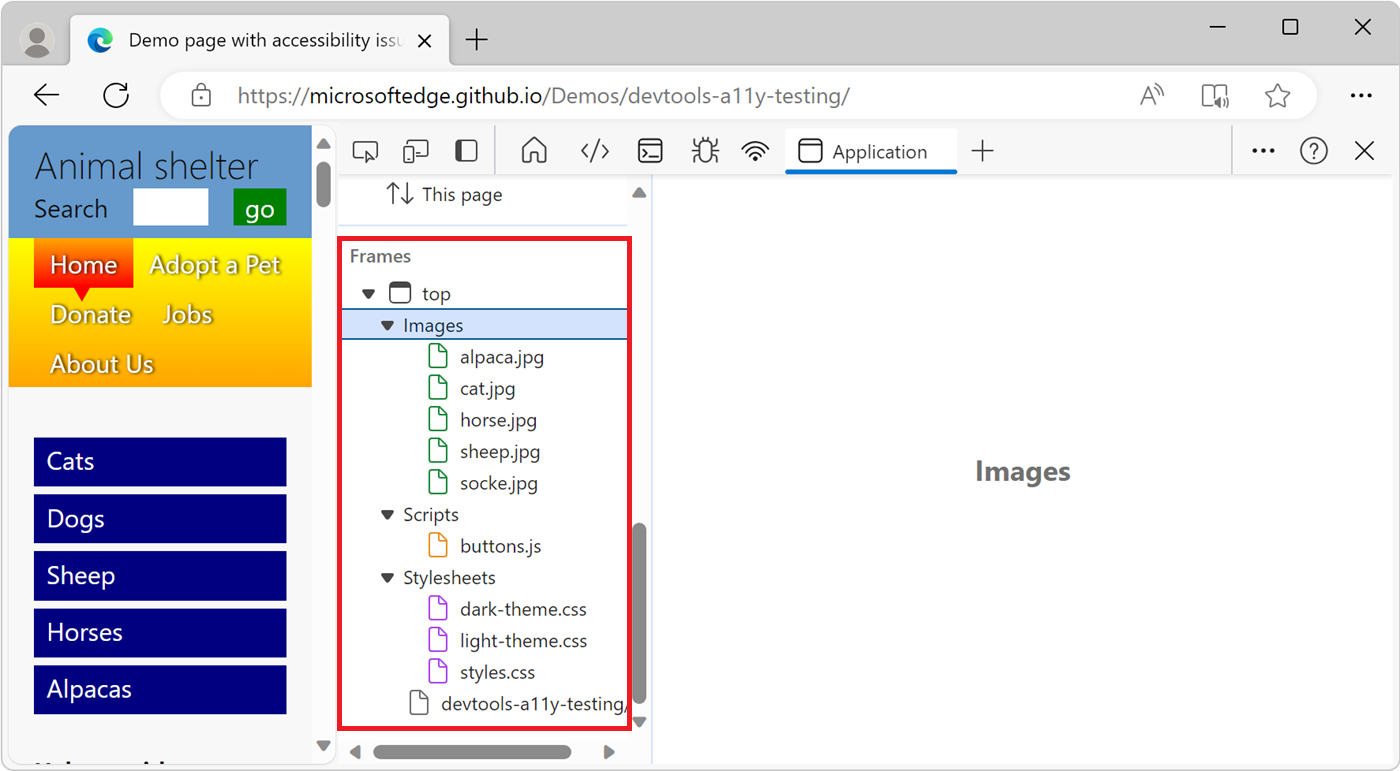
Browse resource files by file type in the Frames tree in the Application tool
One way to view webpage resources grouped by file type is by using the Frames tree in the Application tool:
To open DevTools, right-click the webpage, and then select Inspect. Or, press Ctrl+Shift+I (Windows, Linux) or Command+Option+I (macOS). DevTools opens.
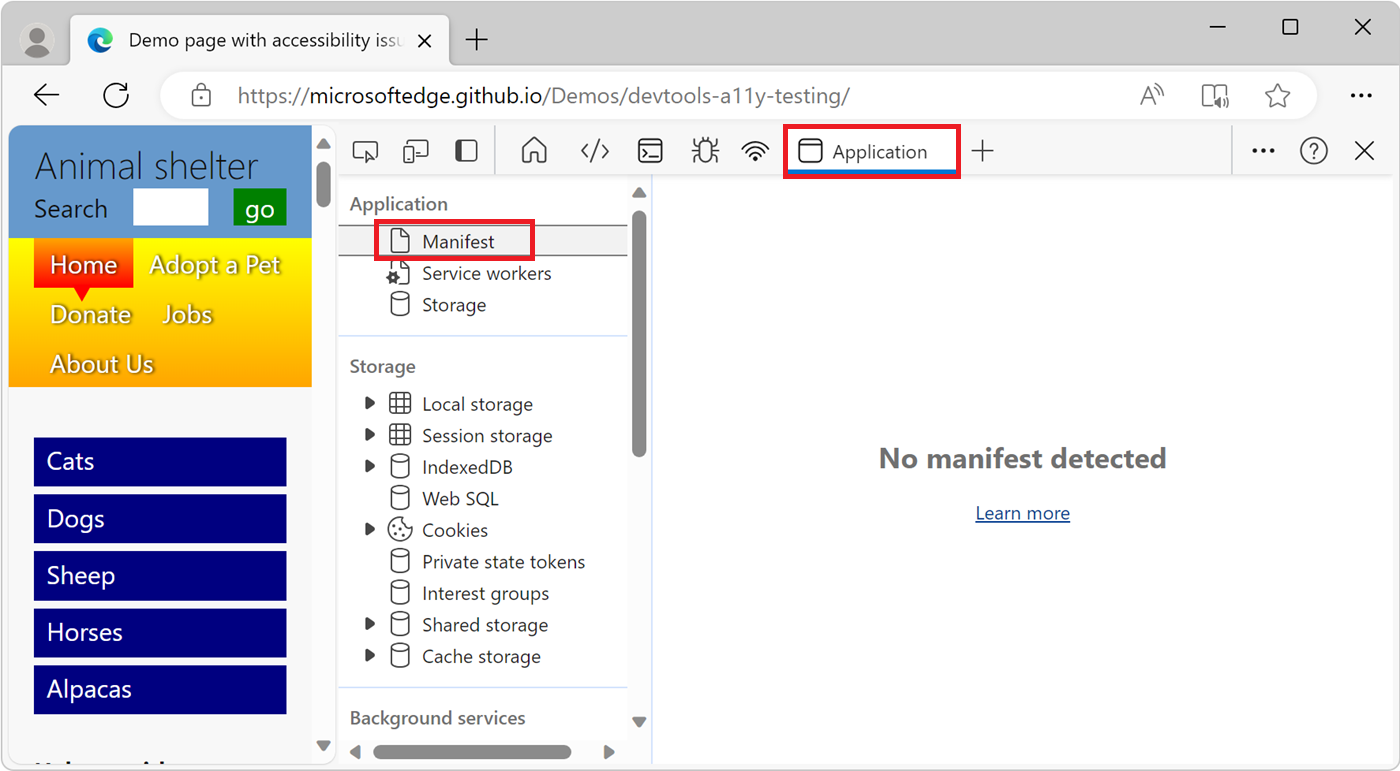
In DevTools, on the Activity Bar, select the Application tab. If that tab isn't visible, click the More Tools () button.
The Application tool opens and by default shows the Manifest pane first:
Scroll down to the Frames pane and then expand the folder that you're interested in:
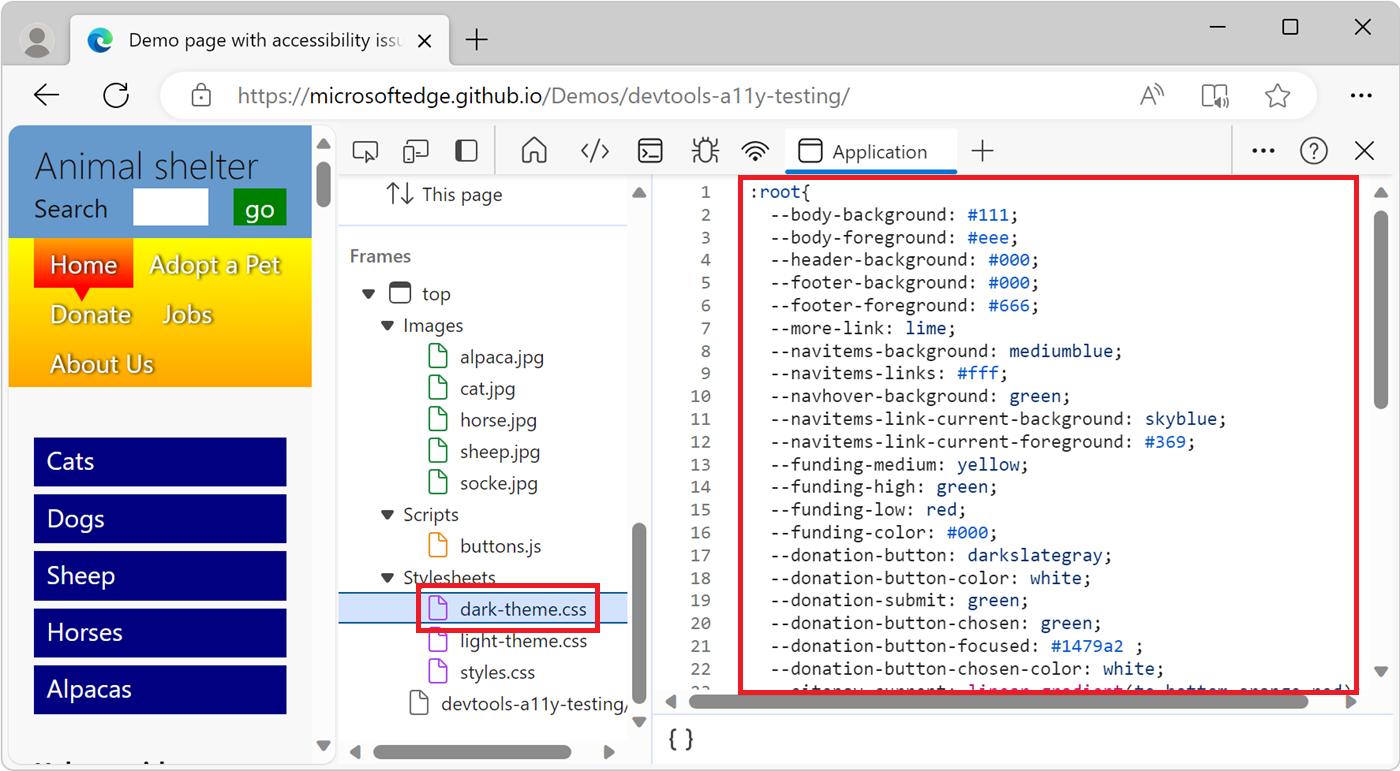
Select a resource to view it in the Application tool:
This module covers various concepts on the topic of accessibility and how to add it to your web applications during web development. You will learn the importance of using HTML tags properly to describe information, and various improvements you can make to your sites.