Training
Learning path
Use advance techniques in canvas apps to perform custom updates and optimization - Training
Use advance techniques in canvas apps to perform custom updates and optimization
This browser is no longer supported.
Upgrade to Microsoft Edge to take advantage of the latest features, security updates, and technical support.
These are the latest features in the Stable release of Microsoft Edge DevTools.
Focus Mode is an experimental interface that allows you to group different tools together based on your own debugging scenarios. The new Activity Bar displayed on the left includes predefined tool groups such as Layout and Debugging. To customize each tool group, close tools with the Close (X) icon or add new tools with the More tools (+) icon.
To turn on the experiment, see Turning an experiment on or off and select the checkboxes next to Focus Mode and DevTools Tooltips and Enable + button tab menus to open more tools. For more information about this feature or to comment with questions and ideas, see DevTools: Focus Mode UI.

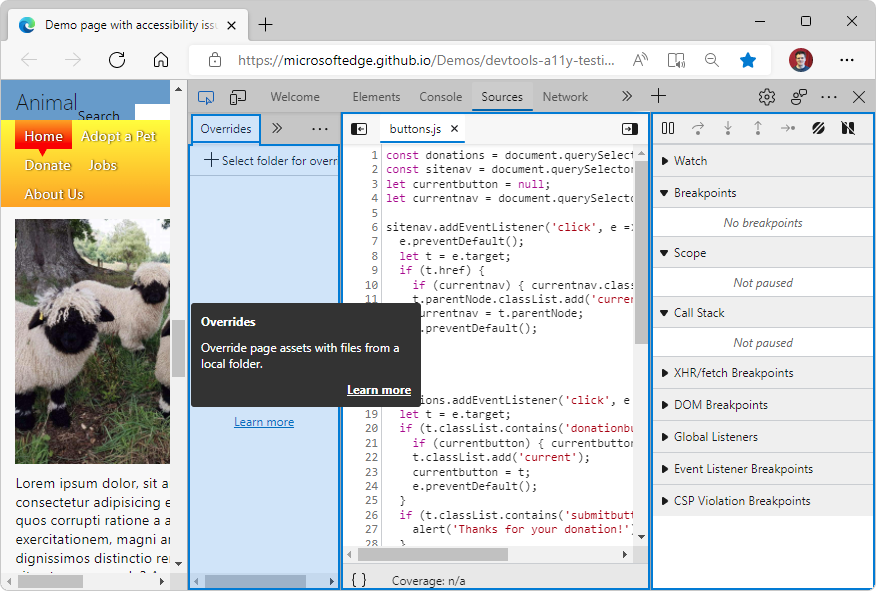
The DevTools Tooltips feature helps you learn about all the different tools and panes. Hover over each outlined region of DevTools to learn more about how to use the tool. To turn on Tooltips, do one of the following:
...) > Help > Toggle the DevTools Tooltips.Then hover over each outlined region of DevTools:
To turn off Tooltips, press Esc.
Update: This feature has been released and is no longer experimental.
Note: As of May 2022, tooltips aren't supported from the Activity Bar.
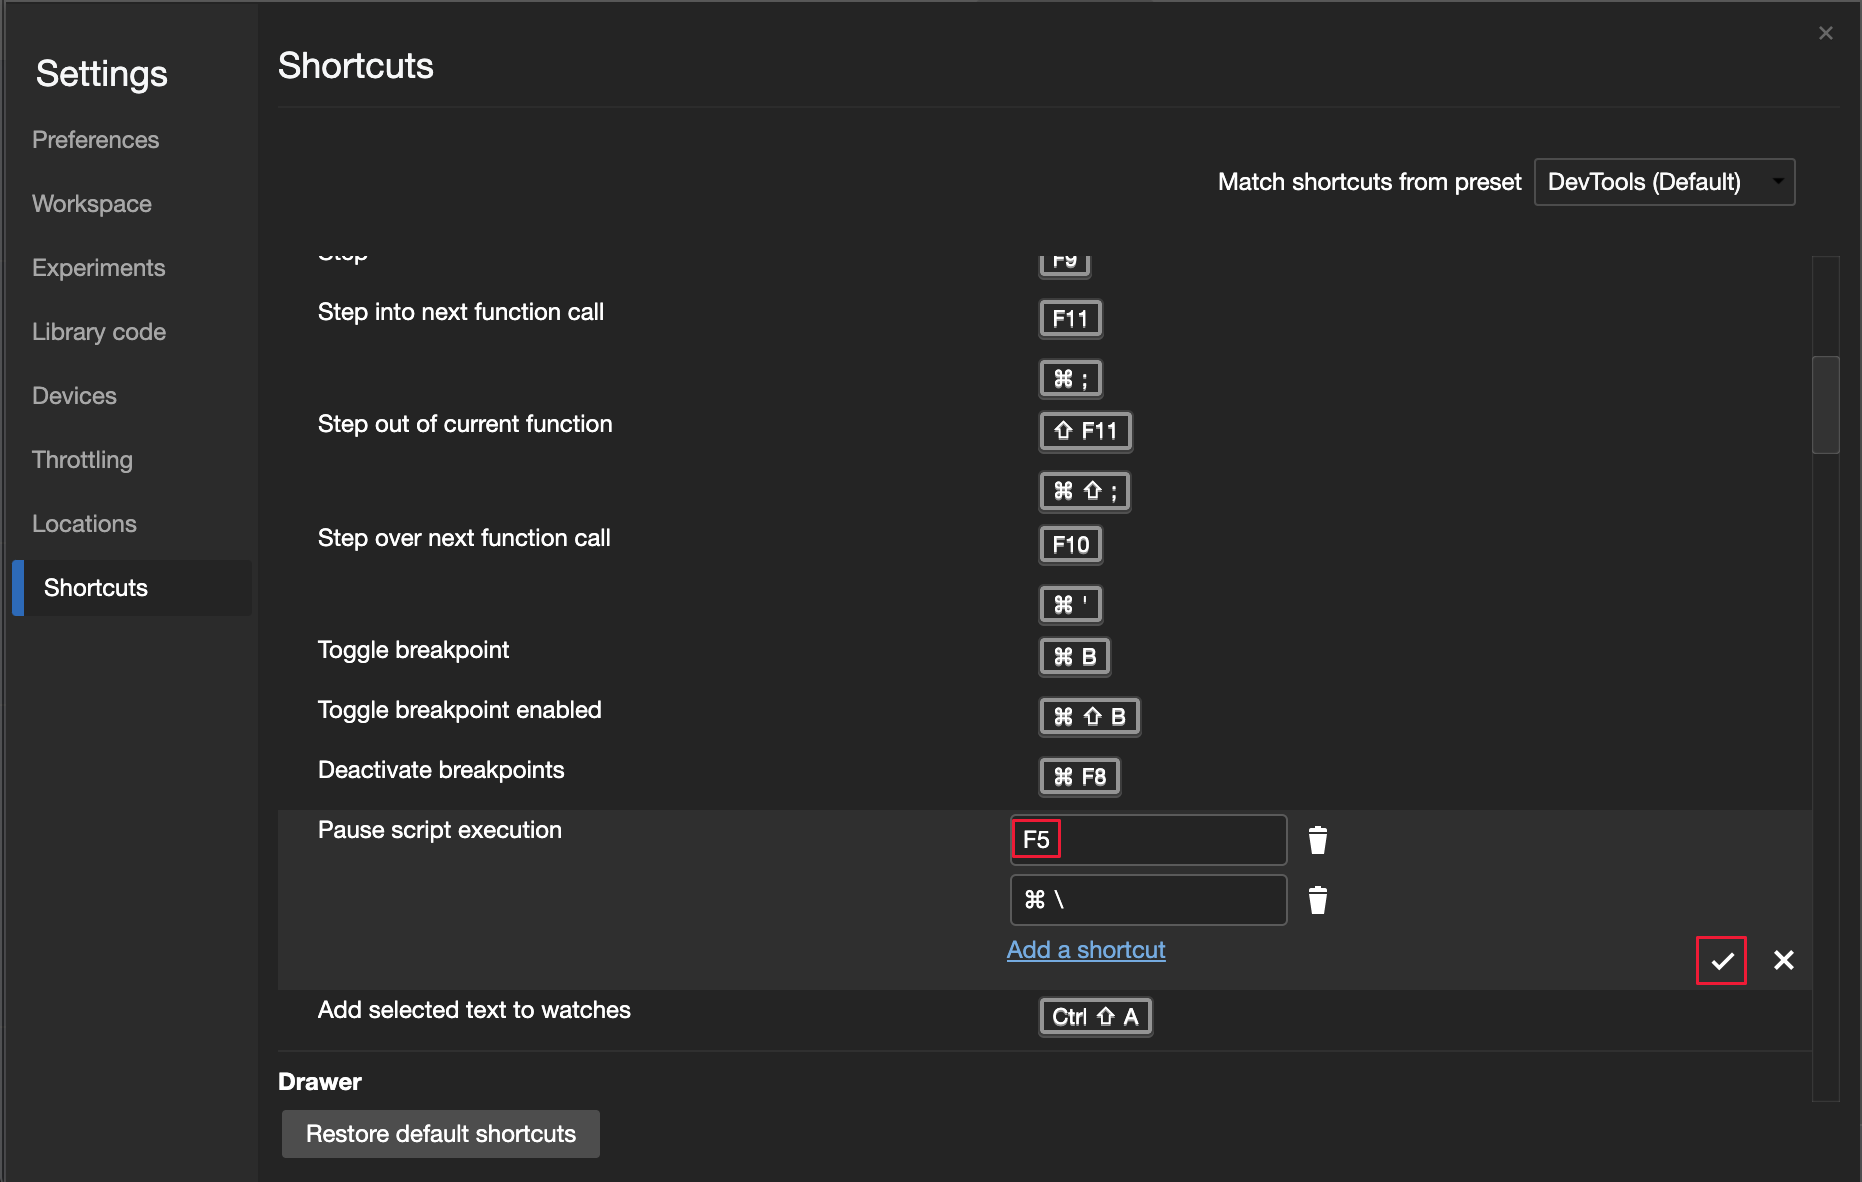
You can now customize the keyboard shortcut for any action in the DevTools.
To edit a keyboard shortcut:
Open DevTools, and then select Settings > Shortcuts.
Select the action you want to customize.
Click the Edit (![]() ) icon.
) icon.
Press the keys you want to bind to the action.
Click the checkmark (![]() ) icon.
) icon.
For more information about customizing and editing shortcuts, see Customize keyboard shortcuts in DevTools. For real-time updates on this feature in the Chromium open-source project, see Issue 174309.
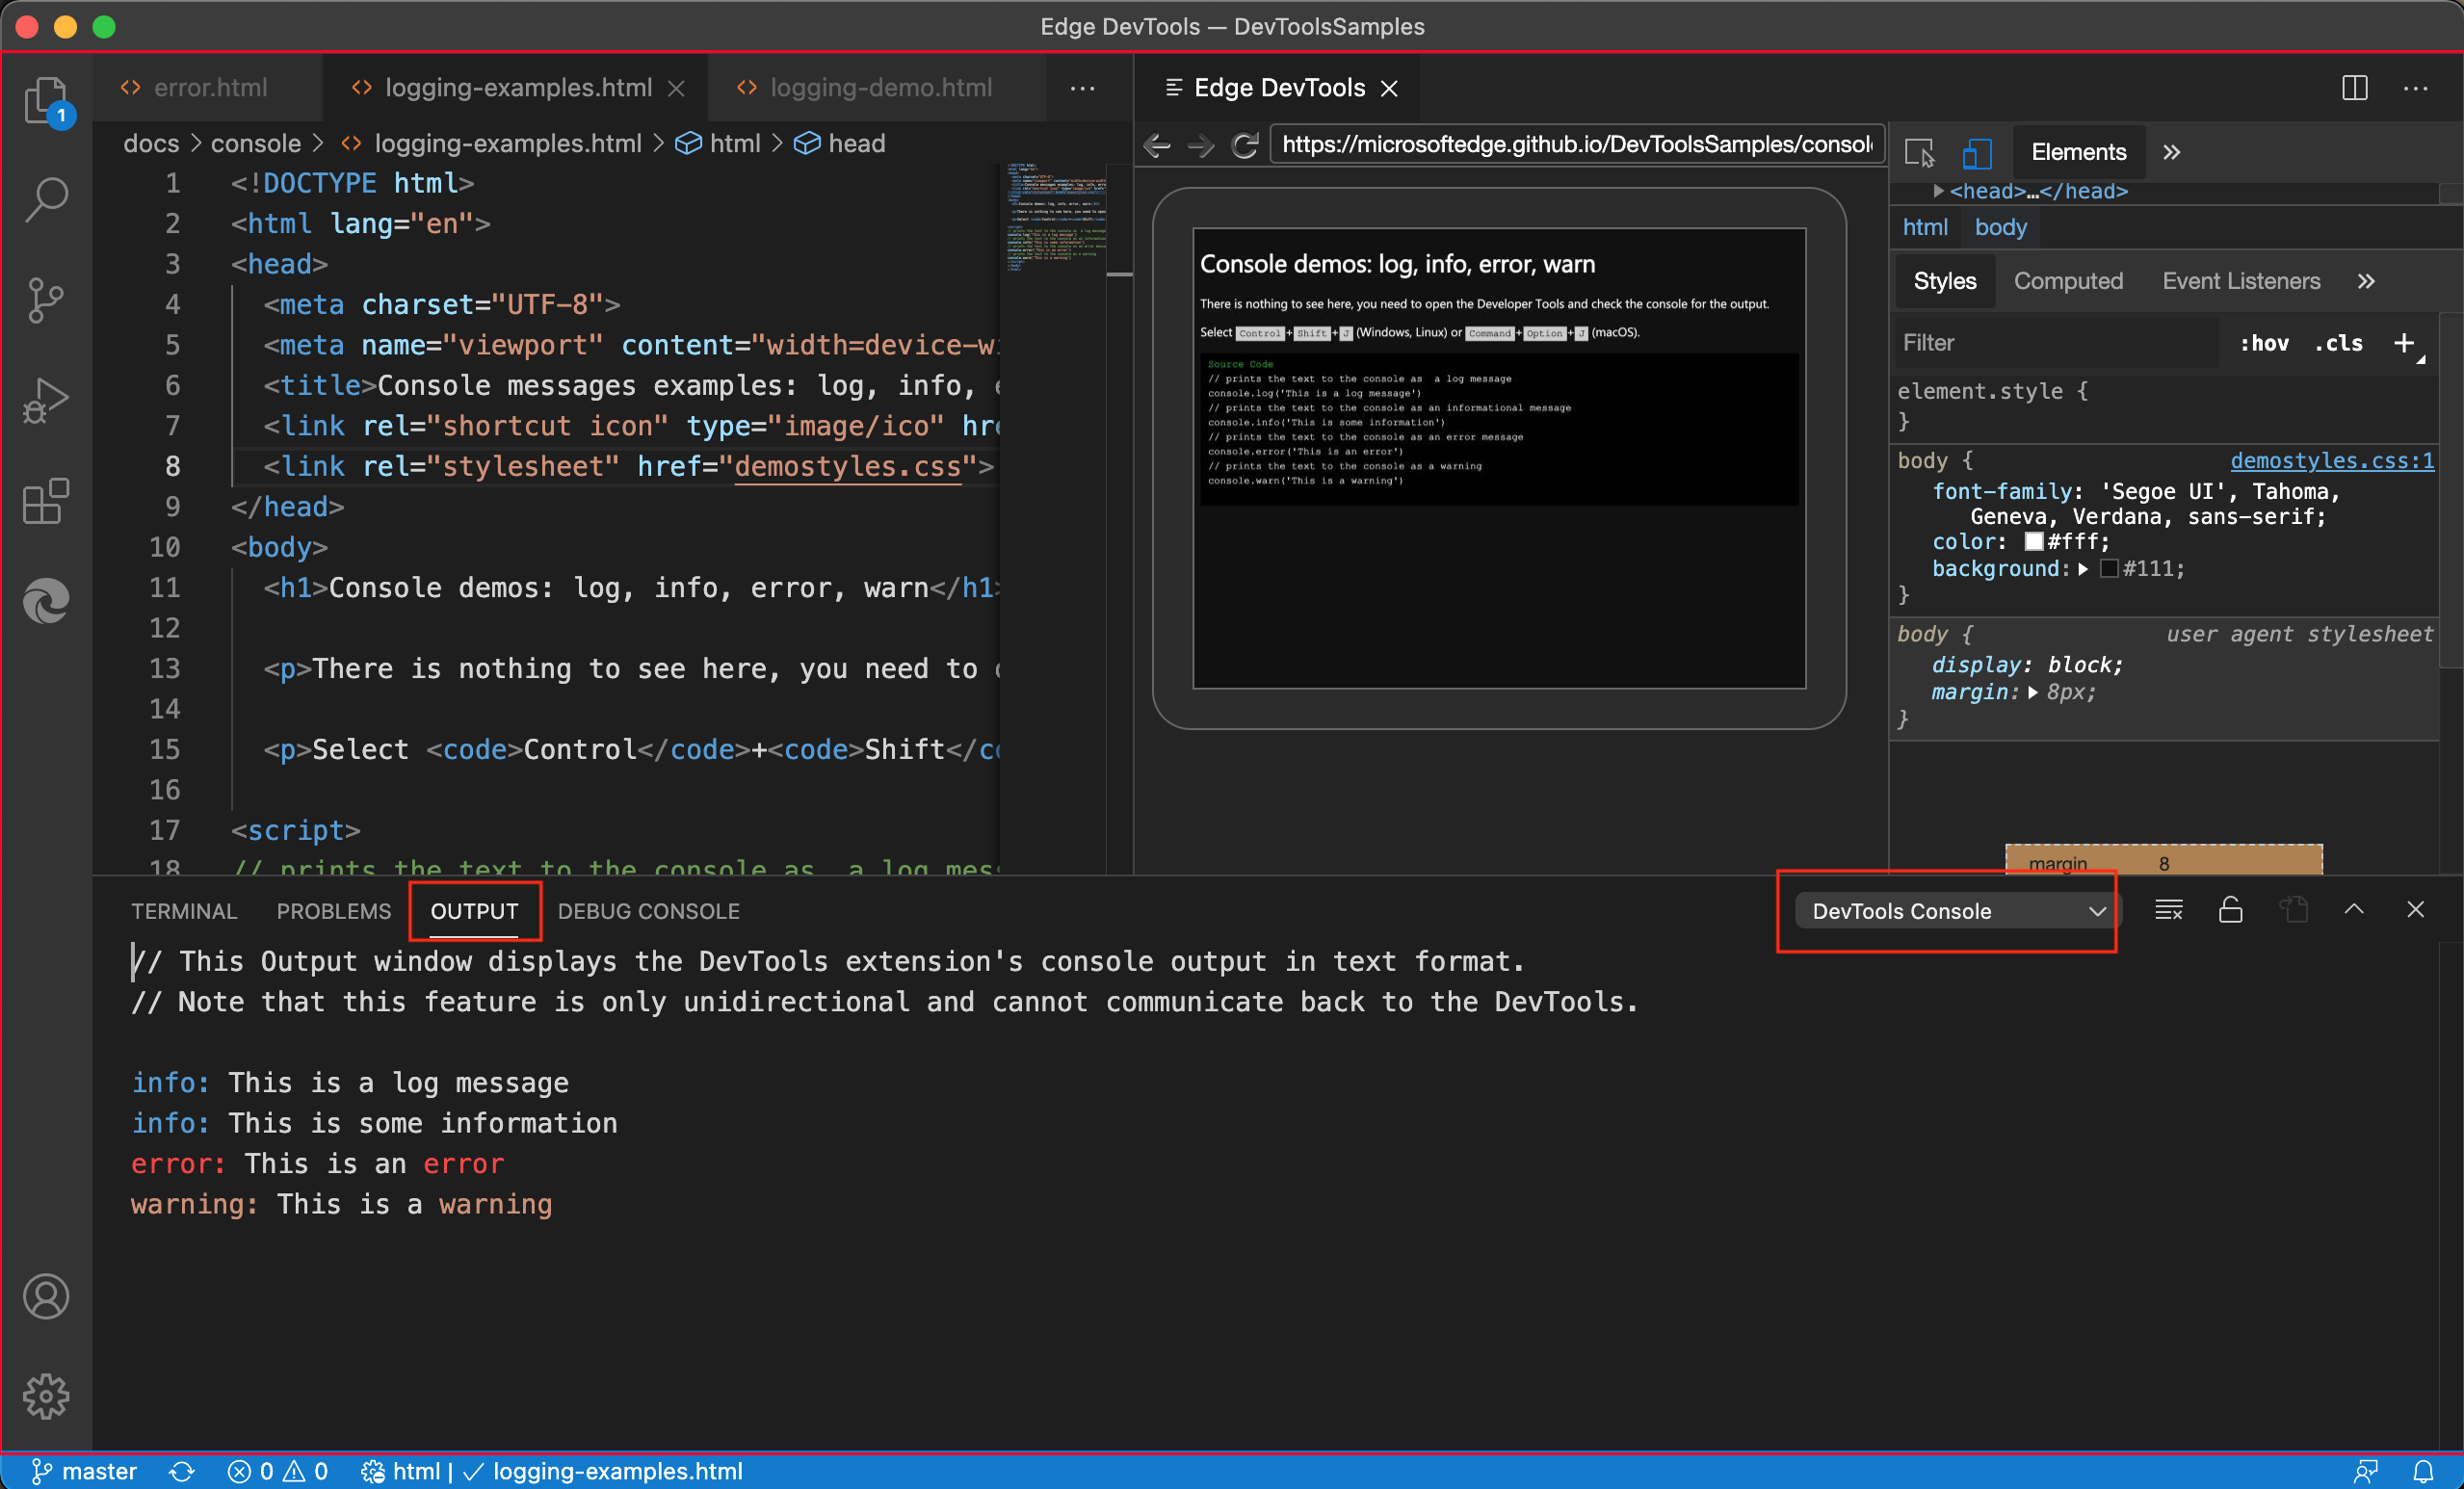
The Microsoft Edge Developer Tools for Visual Studio Code extension version 1.1.4 for Microsoft Visual Studio Code now displays a favicon next to each of the DevTools instances. Console messages from Microsoft Edge now display in the DevTools Console under Output of Microsoft Visual Studio Code. Microsoft Visual Studio Code updates extensions automatically. To manually update to version 1.1.4, see Update an extension manually. You can file issues and contribute to the extension on the vscode-edge-devtools GitHub repo.
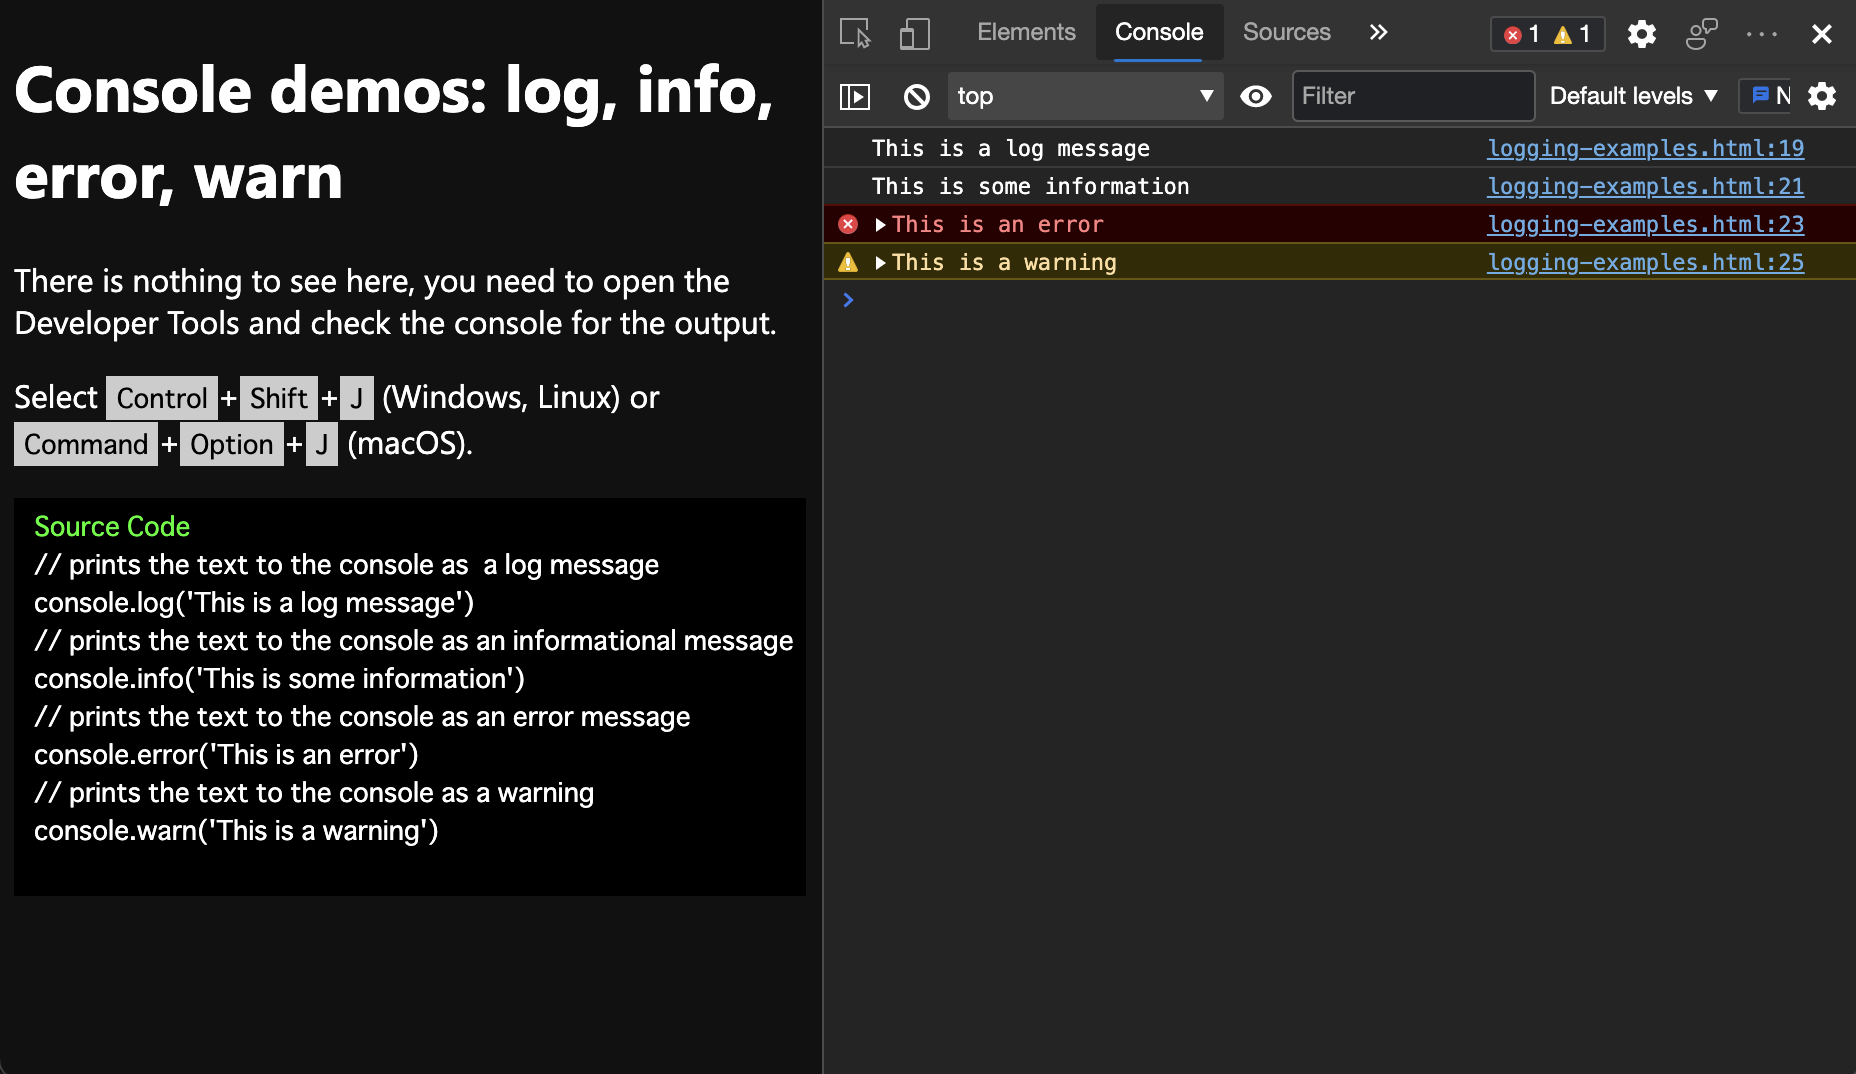
The following figure displays messages from an example webpage logged in the Console tool in Microsoft Edge:
The following figure displays the same messages from the example webpage logged in the DevTools Console under Output of Microsoft Visual Studio Code:
See also:
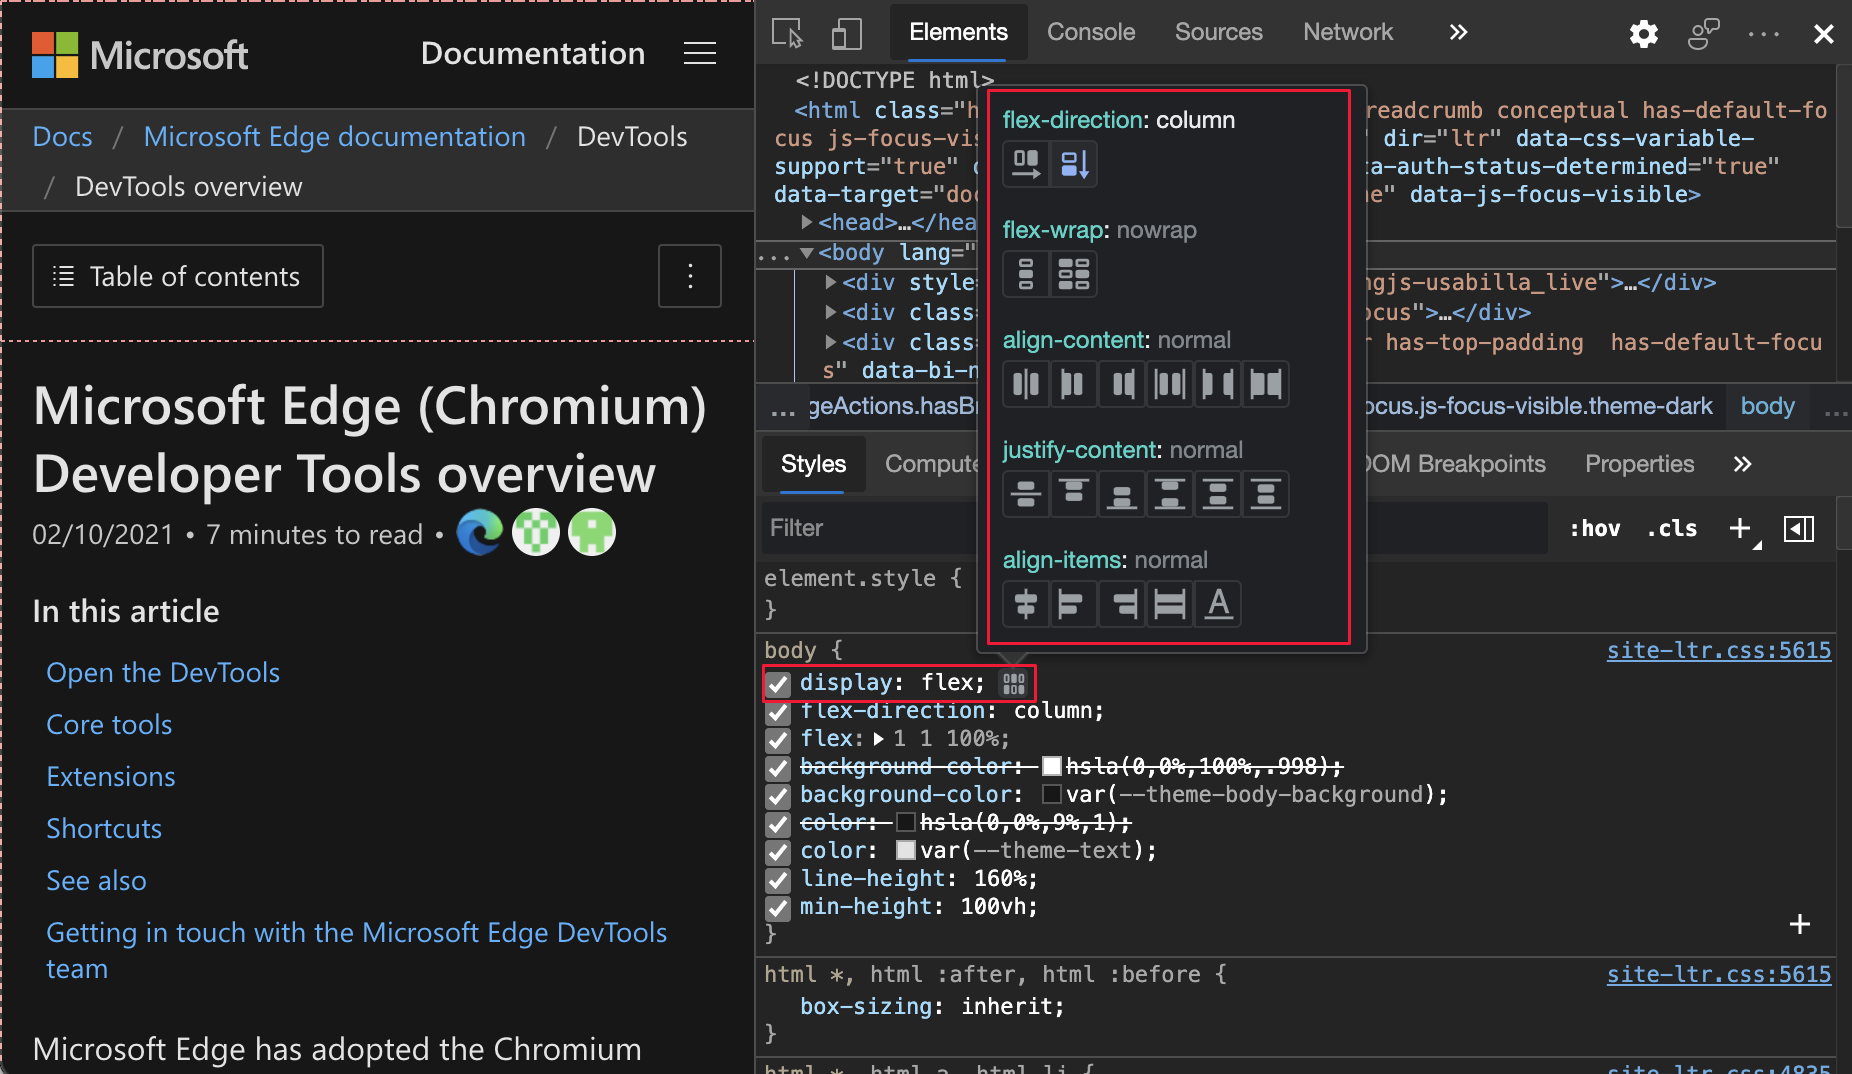
DevTools now has dedicated CSS flexbox debugging tools. If the display: flex or display: inline-flex CSS style is applied to an HTML element, a flex icon appears next to that element in the Elements tool. To display (or hide) a flex overlay on the webpage, click the flex icon.
To open the Flexbox editor, in the Elements tool, go to the Styles tab and then click the new icon next to the display: flex or display: inline-flex style. The Flexbox editor provides a quick way to edit the flexbox properties:
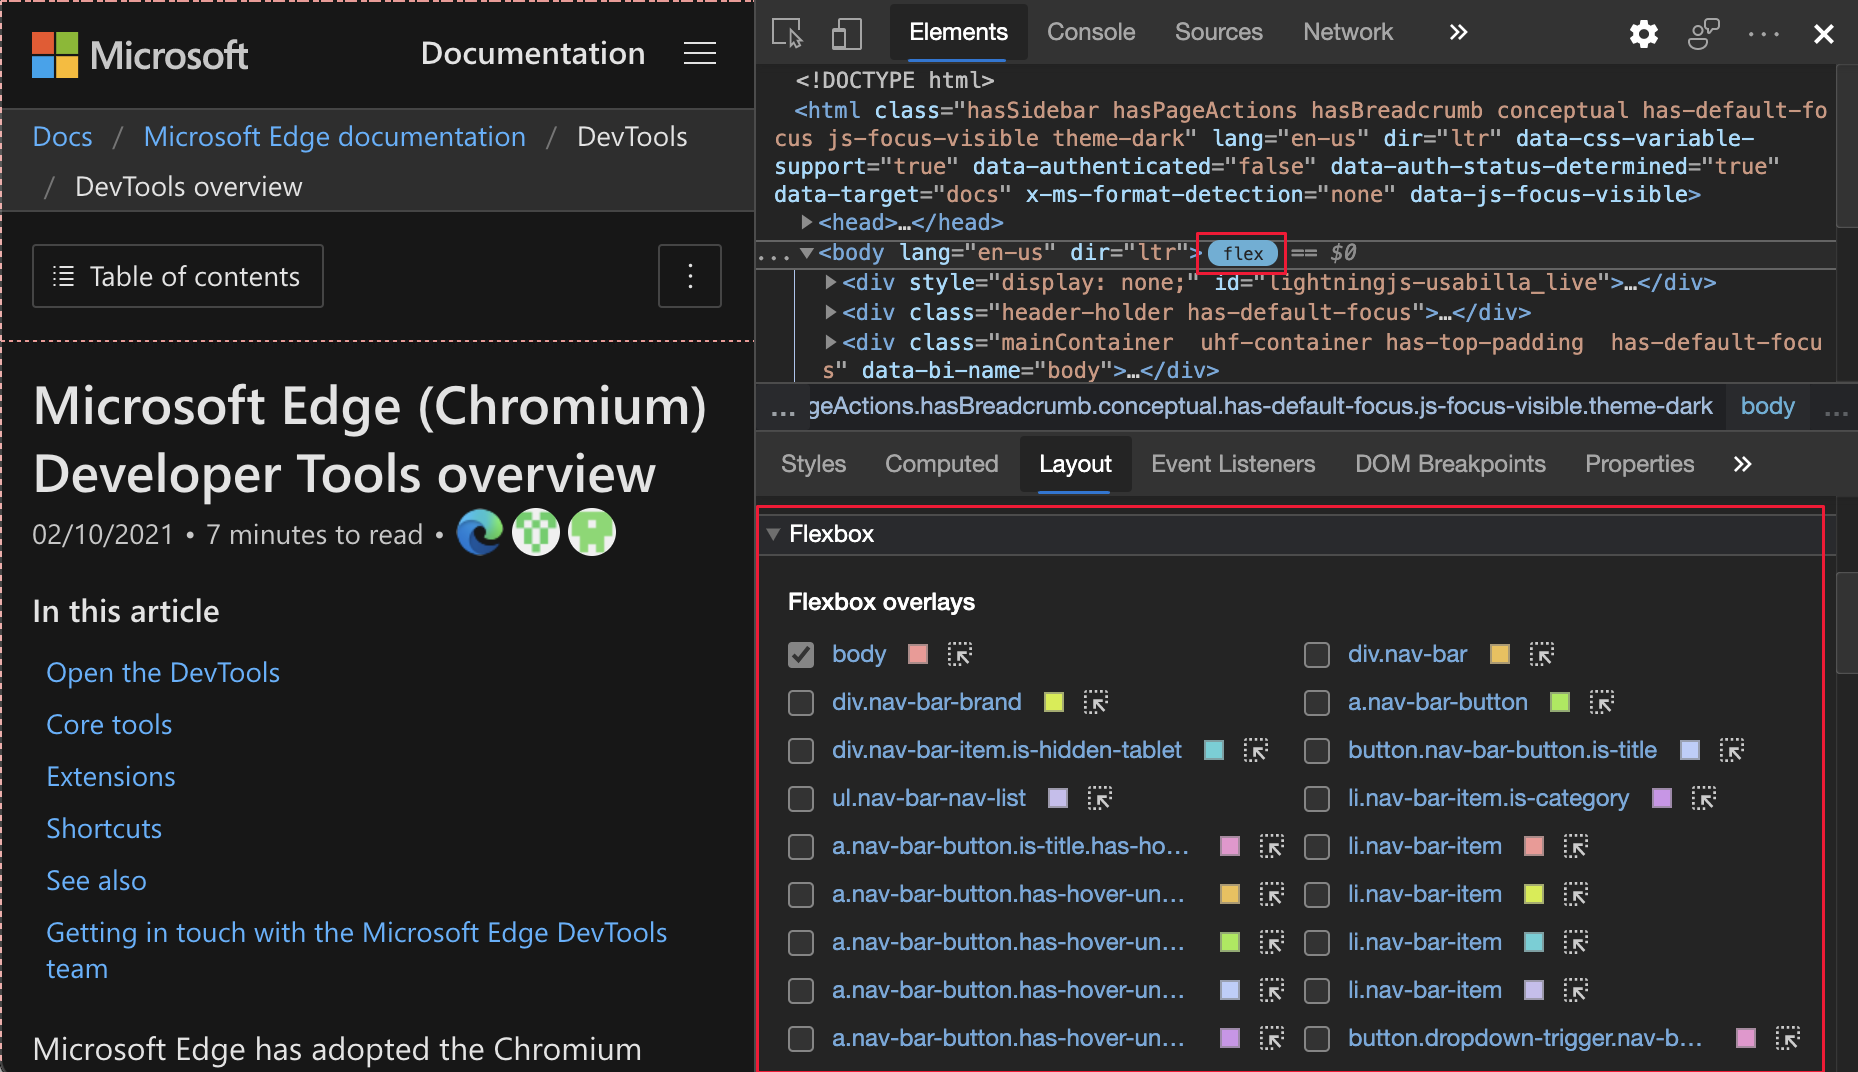
In addition, the Flexbox section in the Layout pane displays all of the flexbox elements on the webpage. You can toggle the overlay of each element:
For the history of this feature in the Chromium open-source project, see Issues 1166710 and 1175699.
See also:
Previously, you were not able to expand or collapse the chain of requests using the arrow keys on the keyboard in the Initiator pane, unlike the DOM in the Elements tool. When a network request is selected in the Network tool, the Initiator pane displays the chain of requests that initiated the currently selected request.
In Microsoft Edge version 90, you can expand or collapse the chain of requests using the arrow keys on the keyboard in the Initiator pane. The focused network request in the chain is also now highlighted.
Click a Network request and then click the Initiator pane:
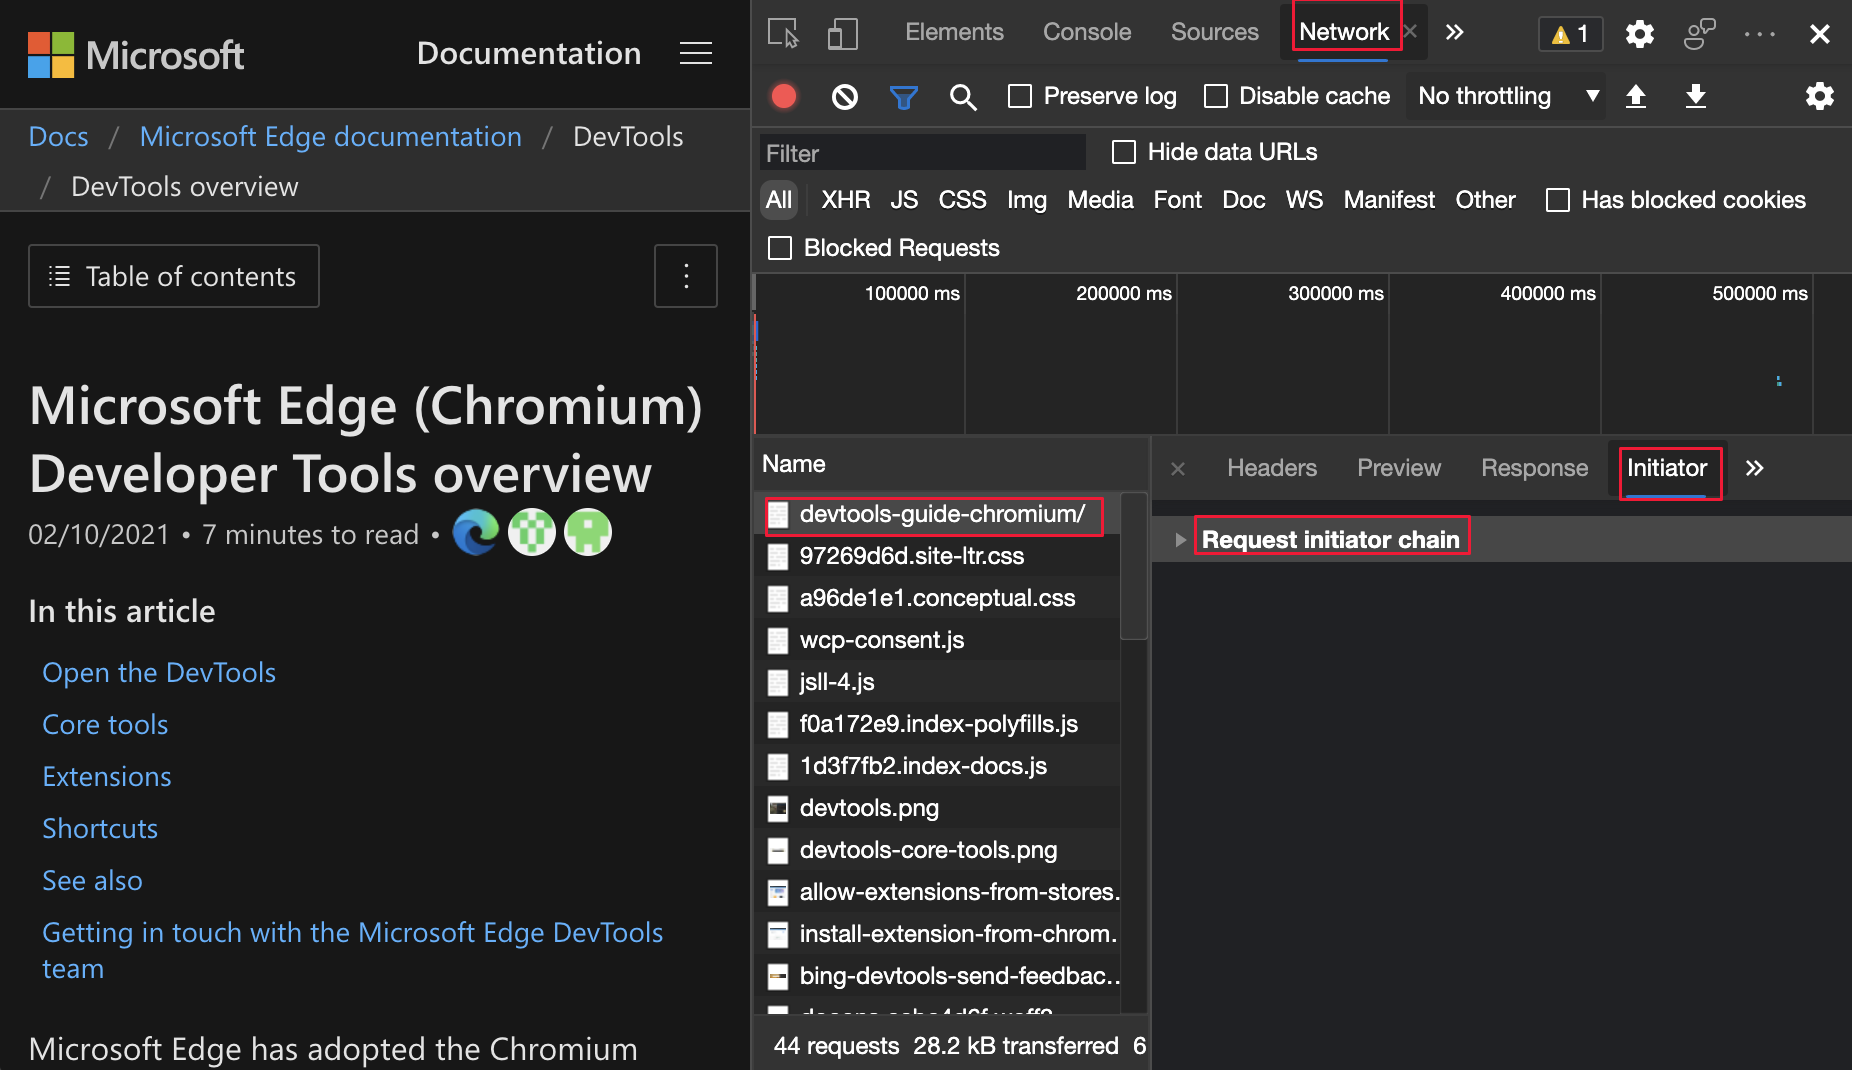
Expand or collapse the request initiator chain and follow the highlighted row:
![]()
To learn more about initiators in the Network tool, see Display initiators and dependencies.
For the history of this feature in the Chromium open-source project, see Issues 1158276 and 1160637.
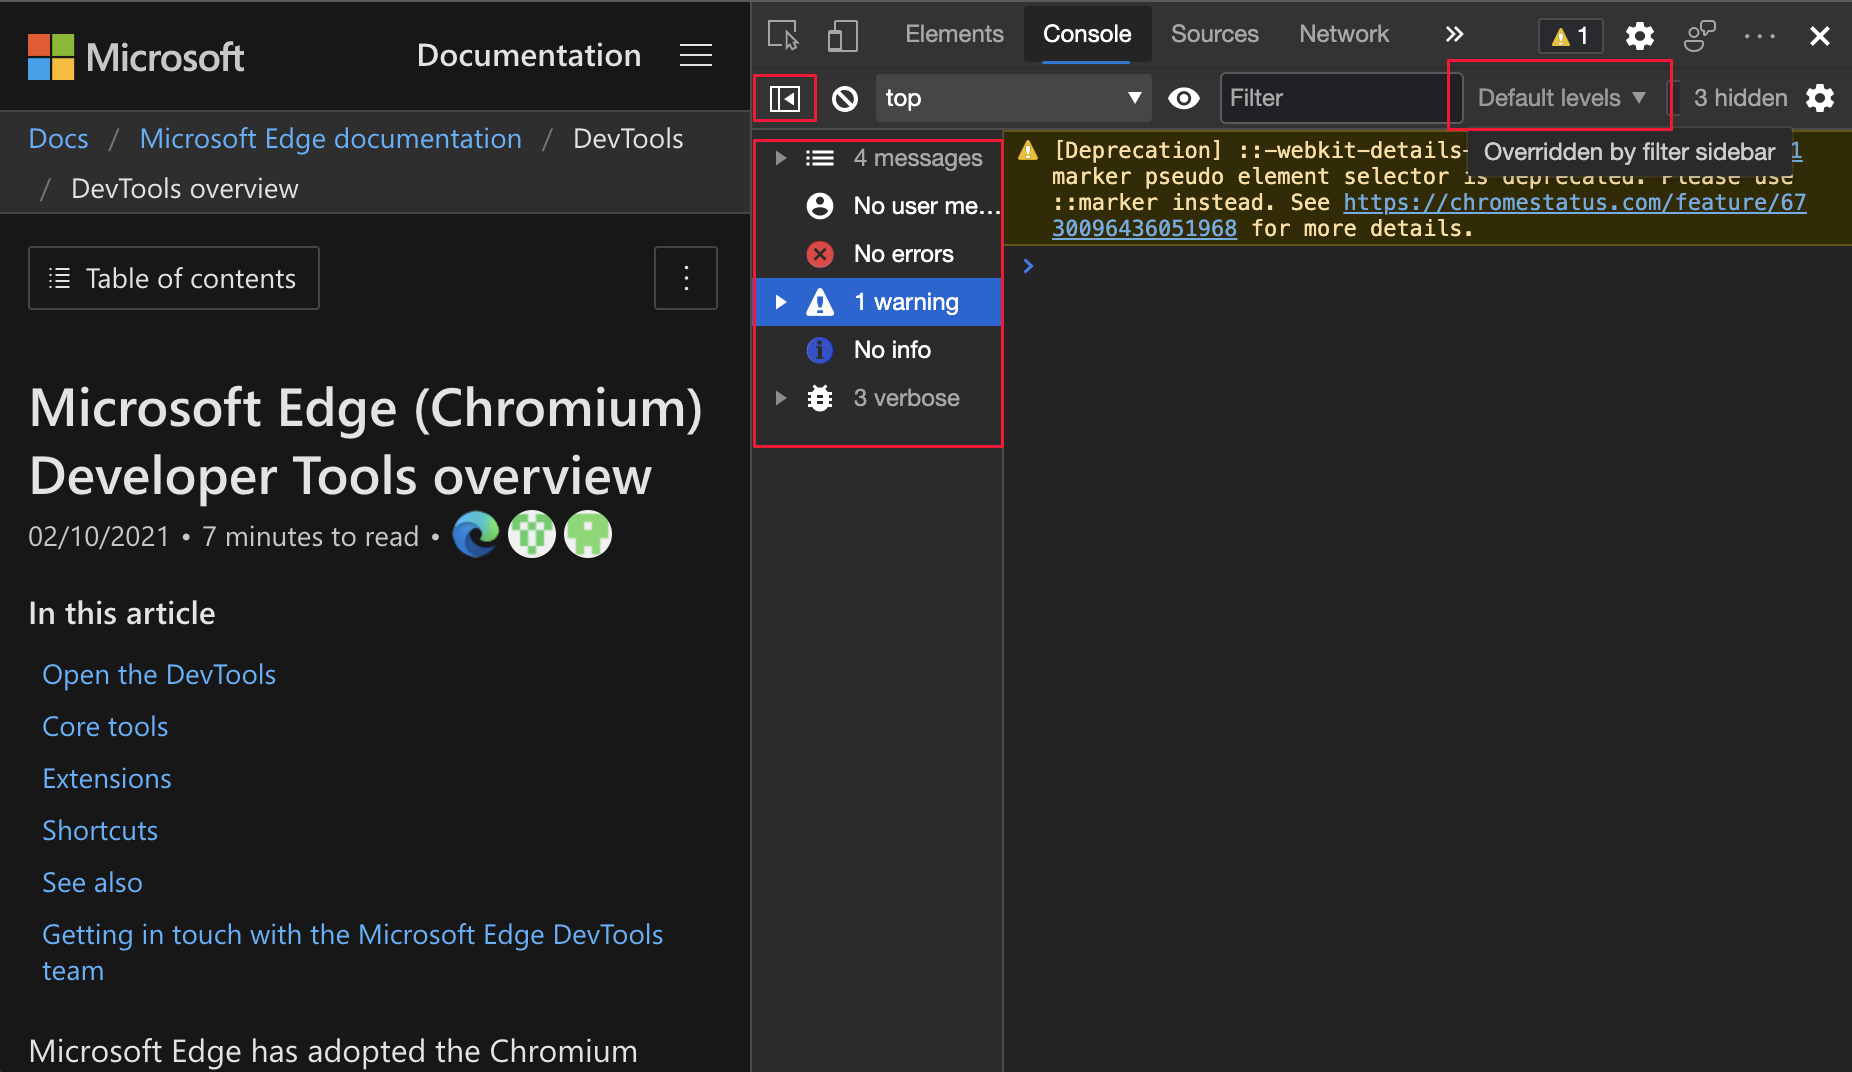
While you filter with the Console Sidebar, the filters in the Log Levels dropdown list aren't available. Previously, the Log Levels dropdown list was highlighted when you hovered over it, even while a filter from the Console Sidebar was selected. In Microsoft Edge version 90, the Log Levels dropdown list is no longer highlighted when you hover over it while a filter from the Console Sidebar is selected.
To learn more about filtering in the Console, see Filter Messages in Console features reference.
Previously, if you open the Console sidebar and hover on Default levels, it was highlighted:
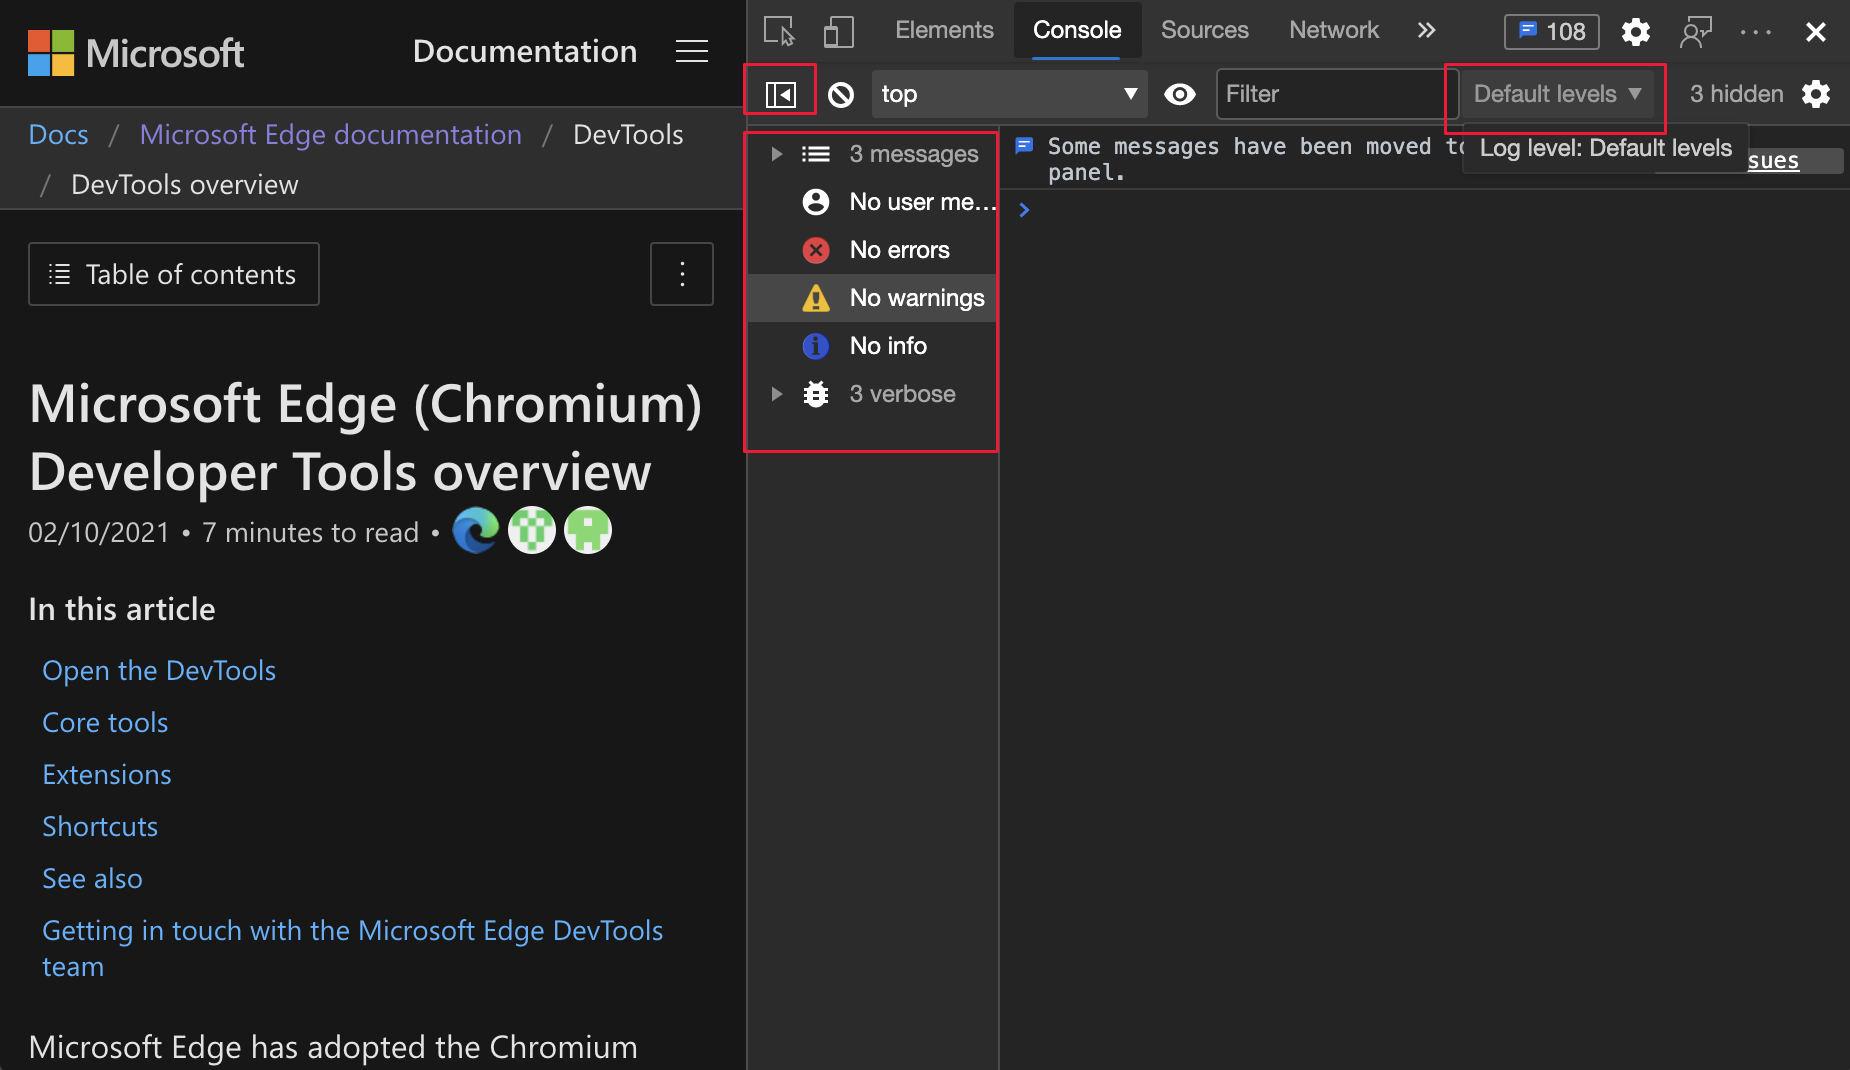
Starting in Microsoft Edge 90, if you click the Console sidebar and hover on Default levels, it doesn't highlight:
The following sections announce additional features available in Microsoft Edge that were contributed to the open-source Chromium project.
Previously, the Console didn't output valid double-quote (") characters in JavaScript strings. Starting in Microsoft Edge version 90, the Console outputs JavaScript strings using escaped double-quote (") characters:
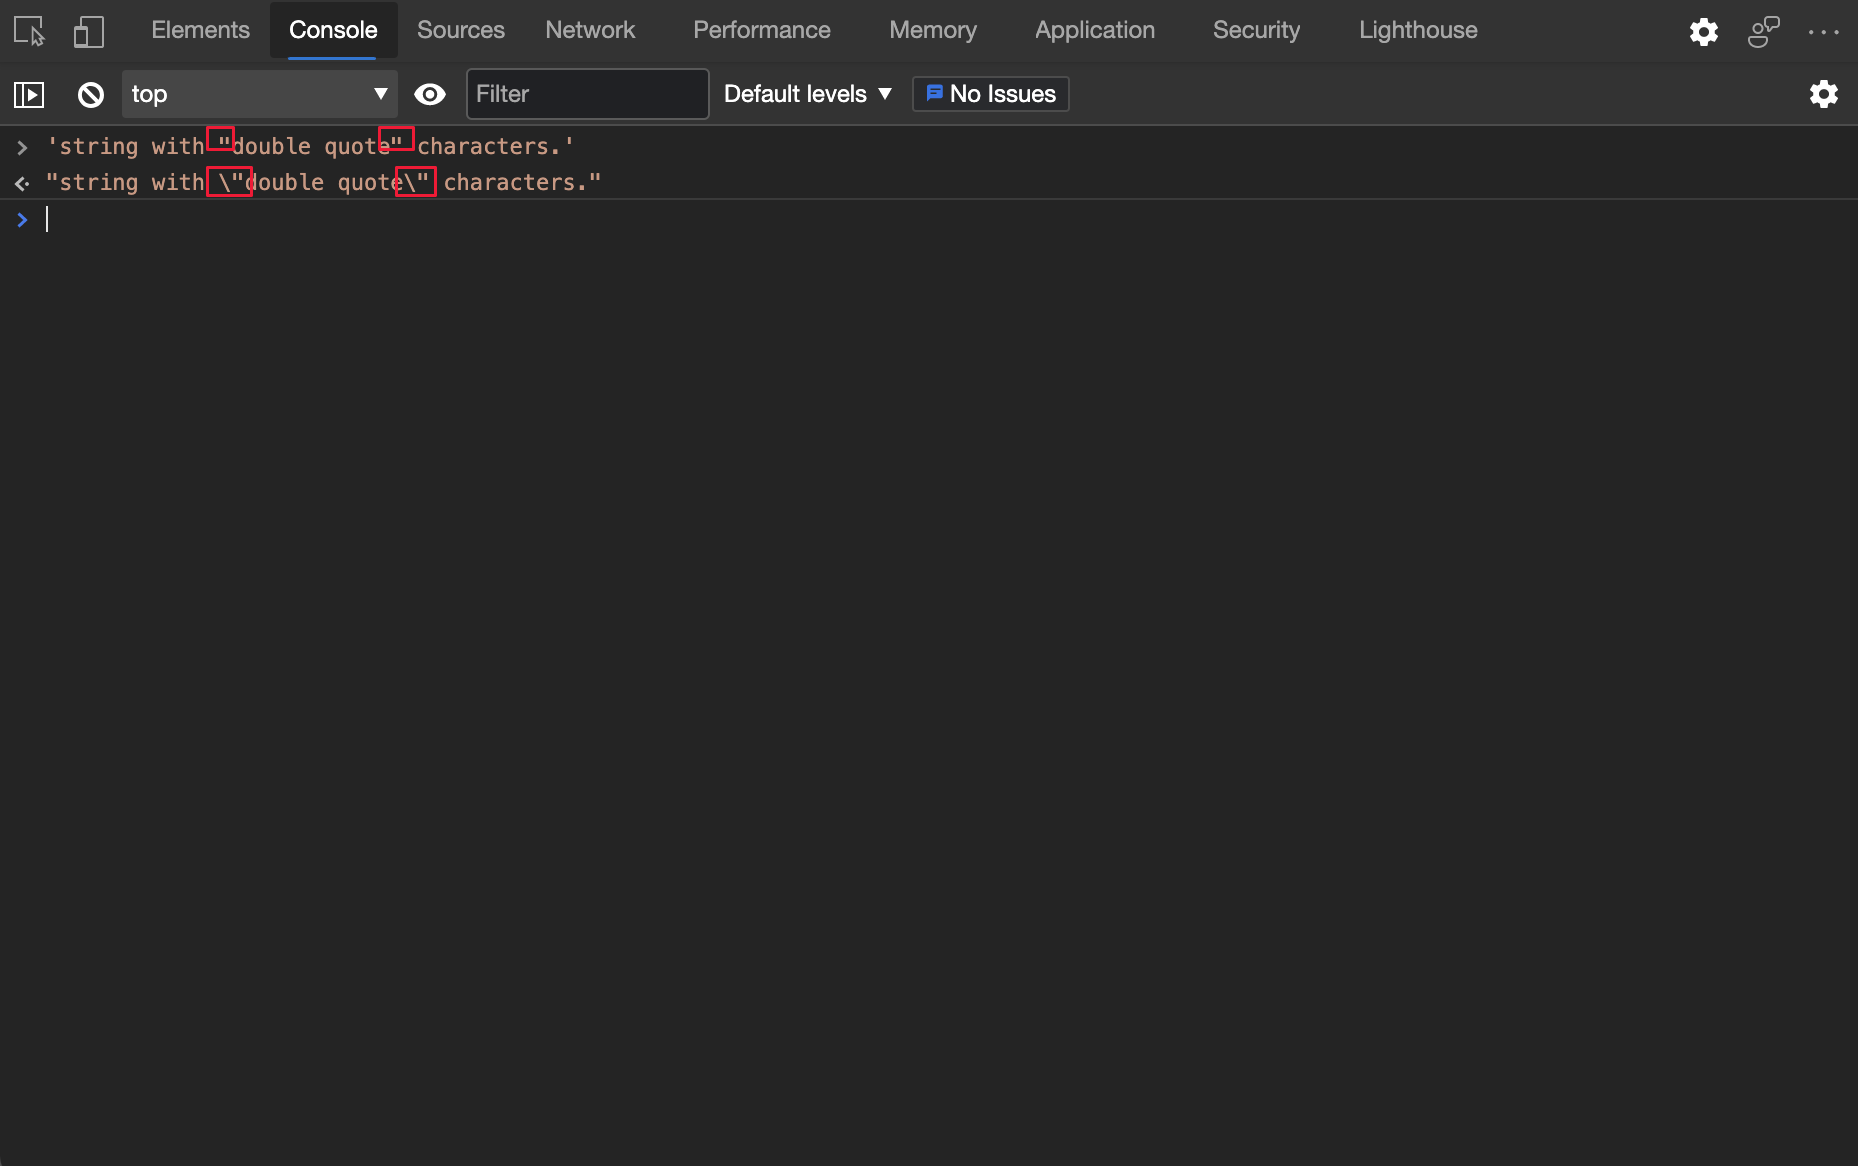
For the history of this feature in the Chromium open-source project, see Issue 1178530.
See also:
The color-gamut media query emulates the approximate range of colors that are supported by the browser and device that you're testing. The dropdown list under Emulate CSS media feature color-gamut contains color spaces that DevTools can emulate. For example, to trigger a color-gamut: p3 media query, select color-gamut: p3 from the dropdown list.
To emulate the CSS color-gamut media feature:

To learn more about the color-gamut feature, see Color Display Quality: the 'color-gamut' feature.
For the history of this feature in the Chromium open-source project, see Issue 1073887.
See also:
The Console now displays a more detailed installability warning message for Progressive Web Apps (PWAs), with a link to Improving Progressive Web App offline support detection.
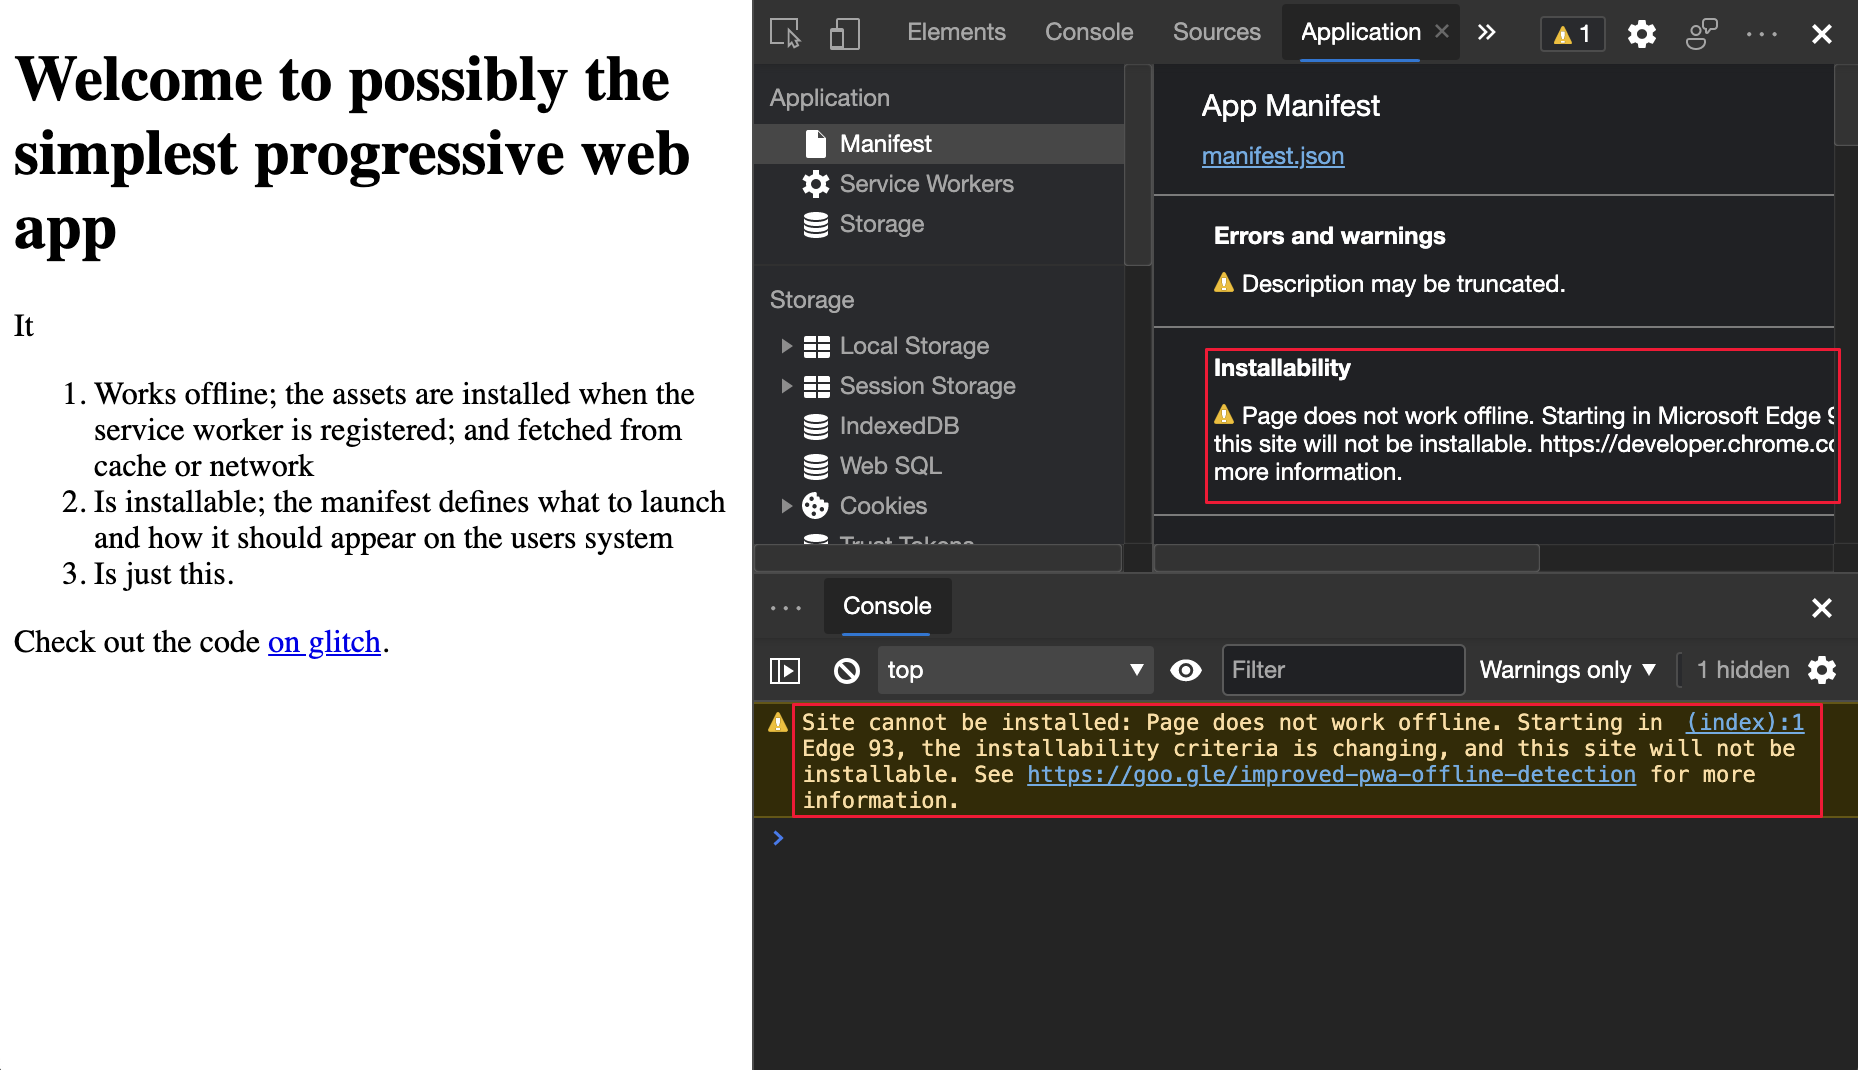
See also:
In the Application tool, the Manifest pane now displays a warning message if the manifest description exceeds 324 characters:
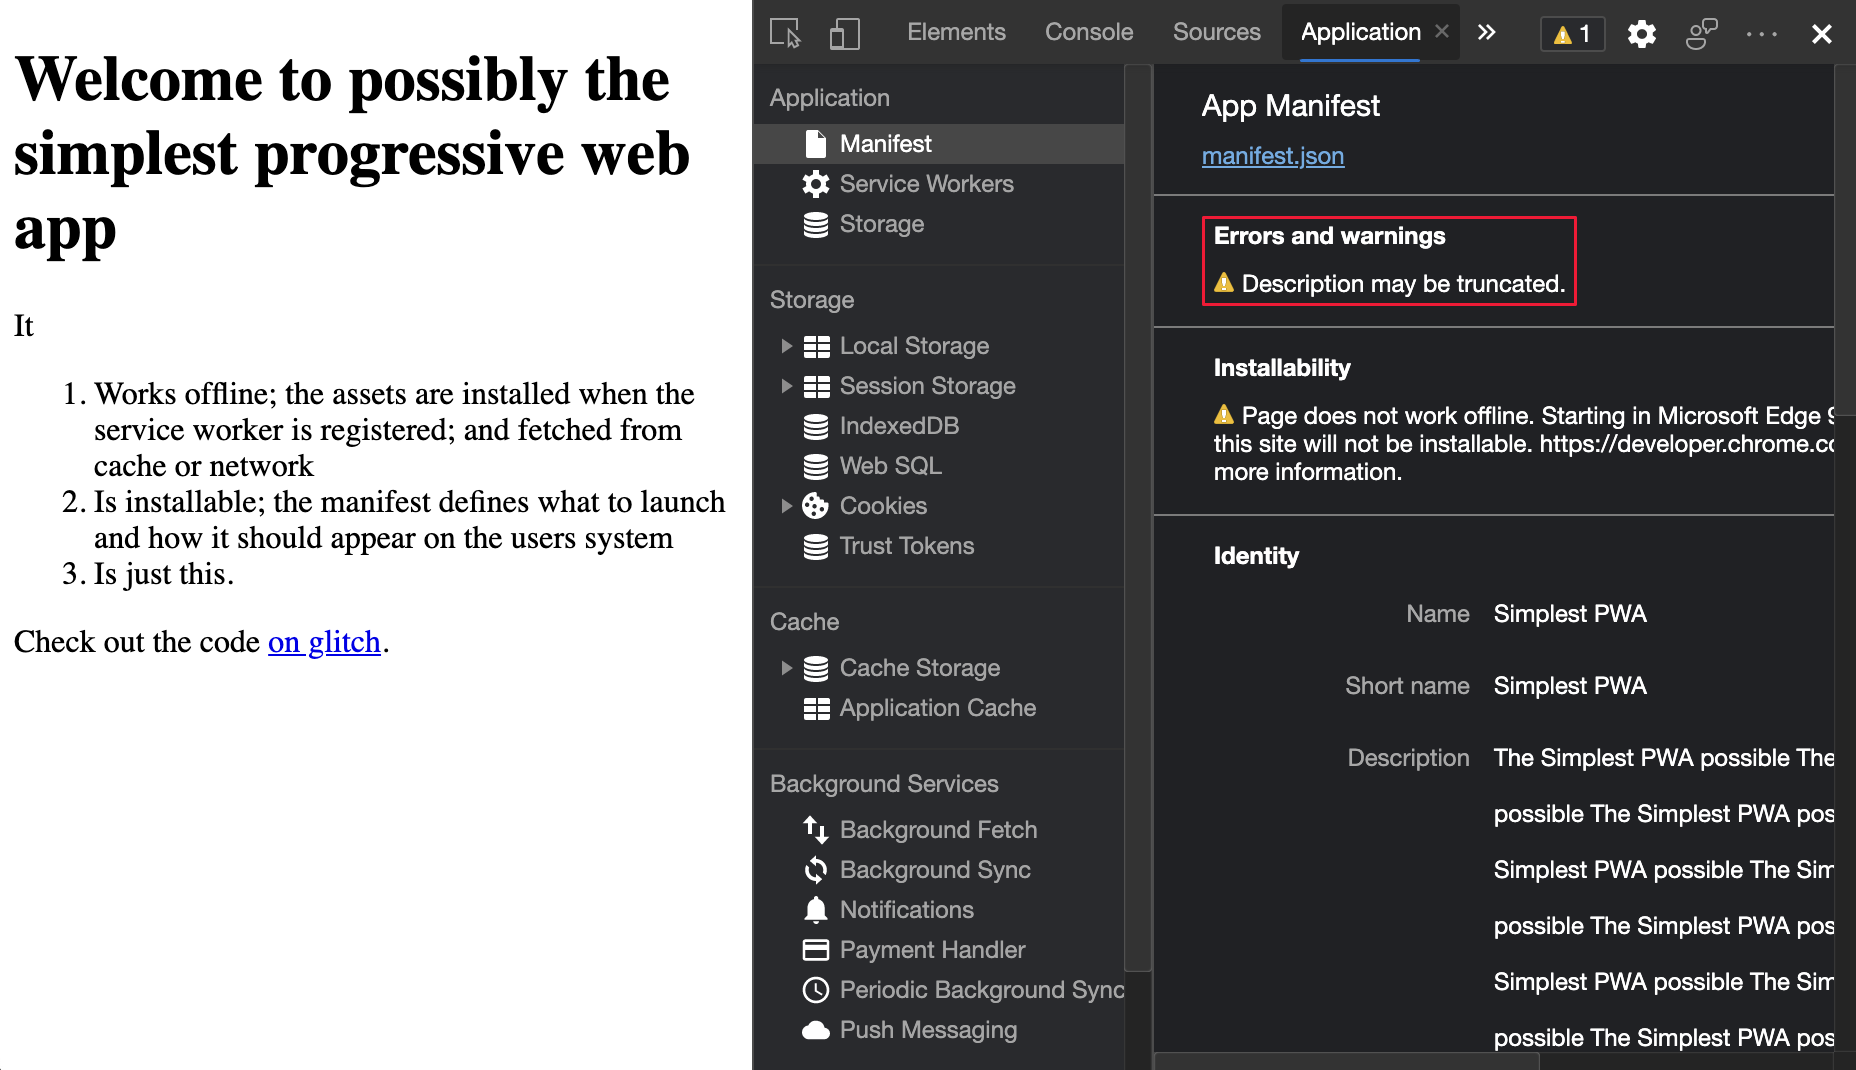
For the history of this feature in the Chromium open-source project, see Issues 965802, 1146450, and 1169689.
See also:
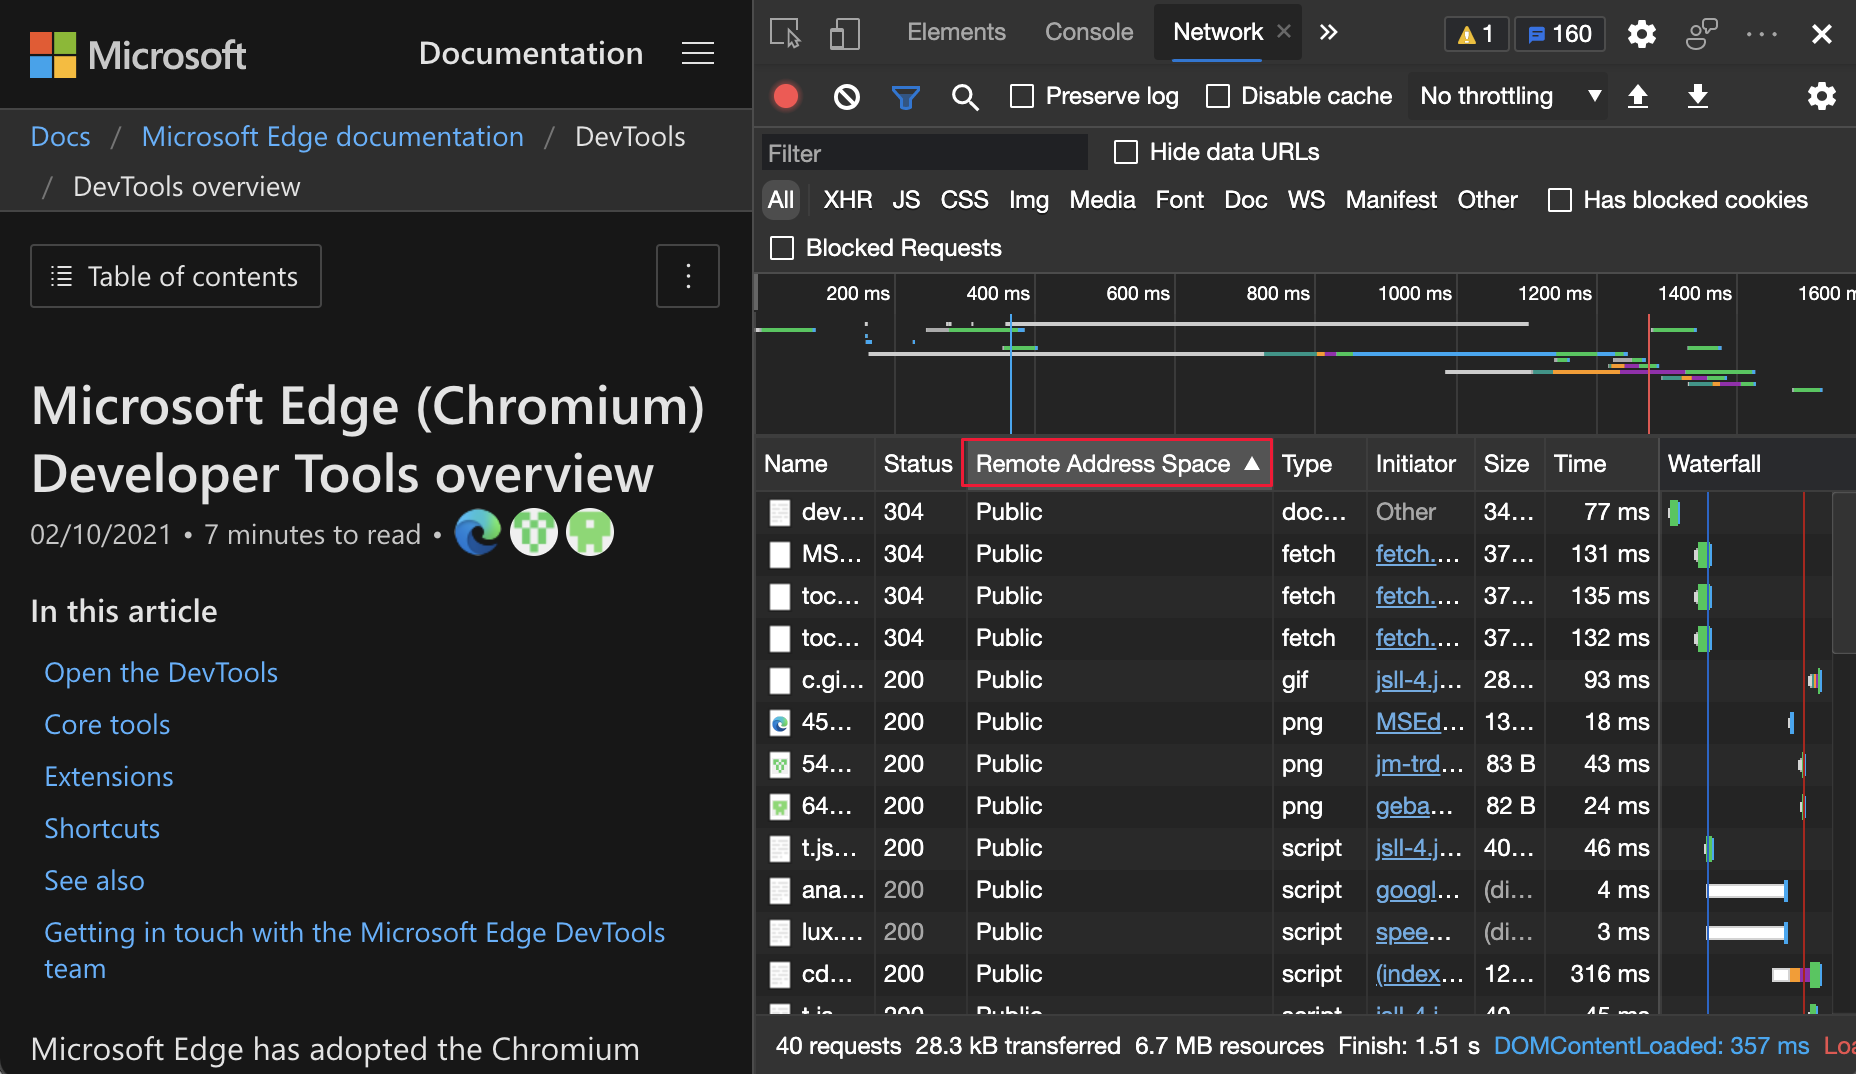
In the Network tool, the new Remote Address Space column displays the network IP address space of each network resource. To display the new Remote Address Space column:
In DevTools, open the Network tool.
In the Requests table (the main, lower part of the Network tool), right-click the header row, and then select Remote Address Space:
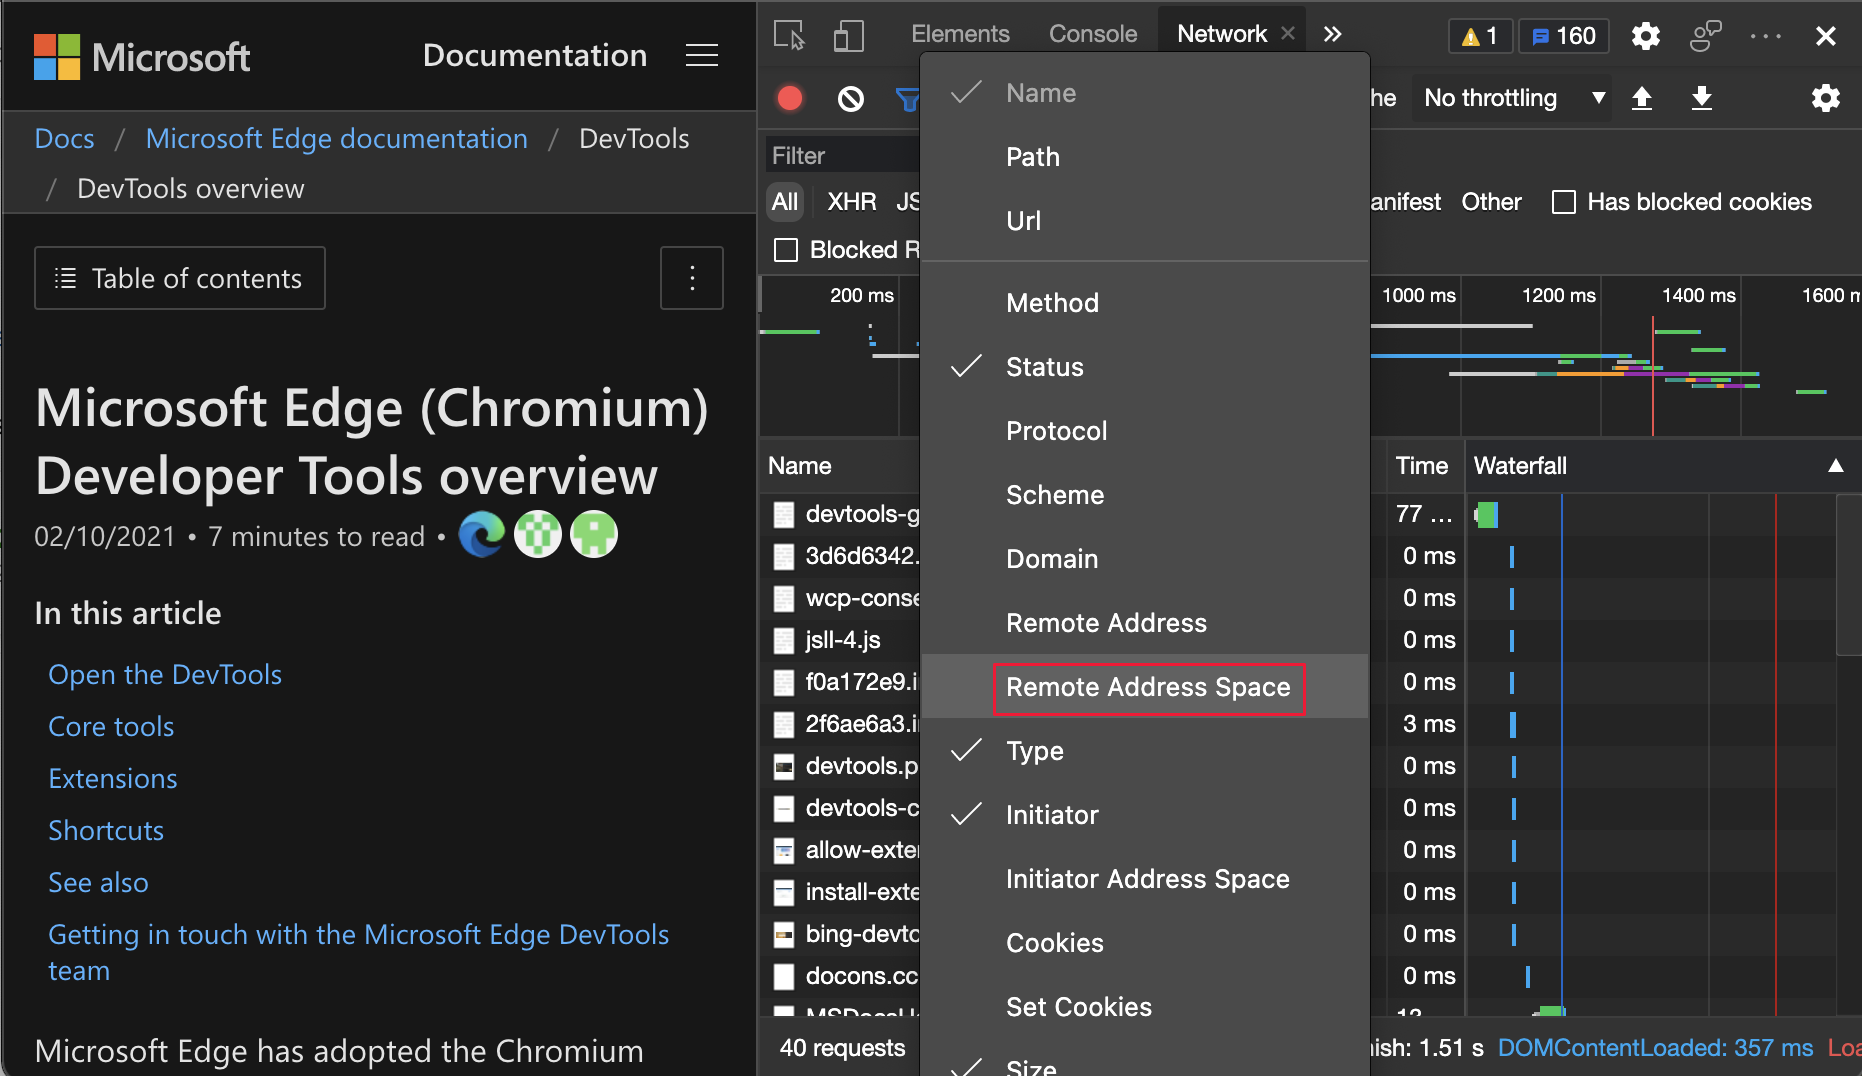
The Requests table now displays the Remote Address Space column:
To view the history of this feature in the Chromium open-source project, see Issue 1128885.
See also:
In the Application tool, the Frames node in the lower left opens the Frame details view. The Frame details view now includes a Permissions Policy section, which displays a list of allowed and disallowed browser features:
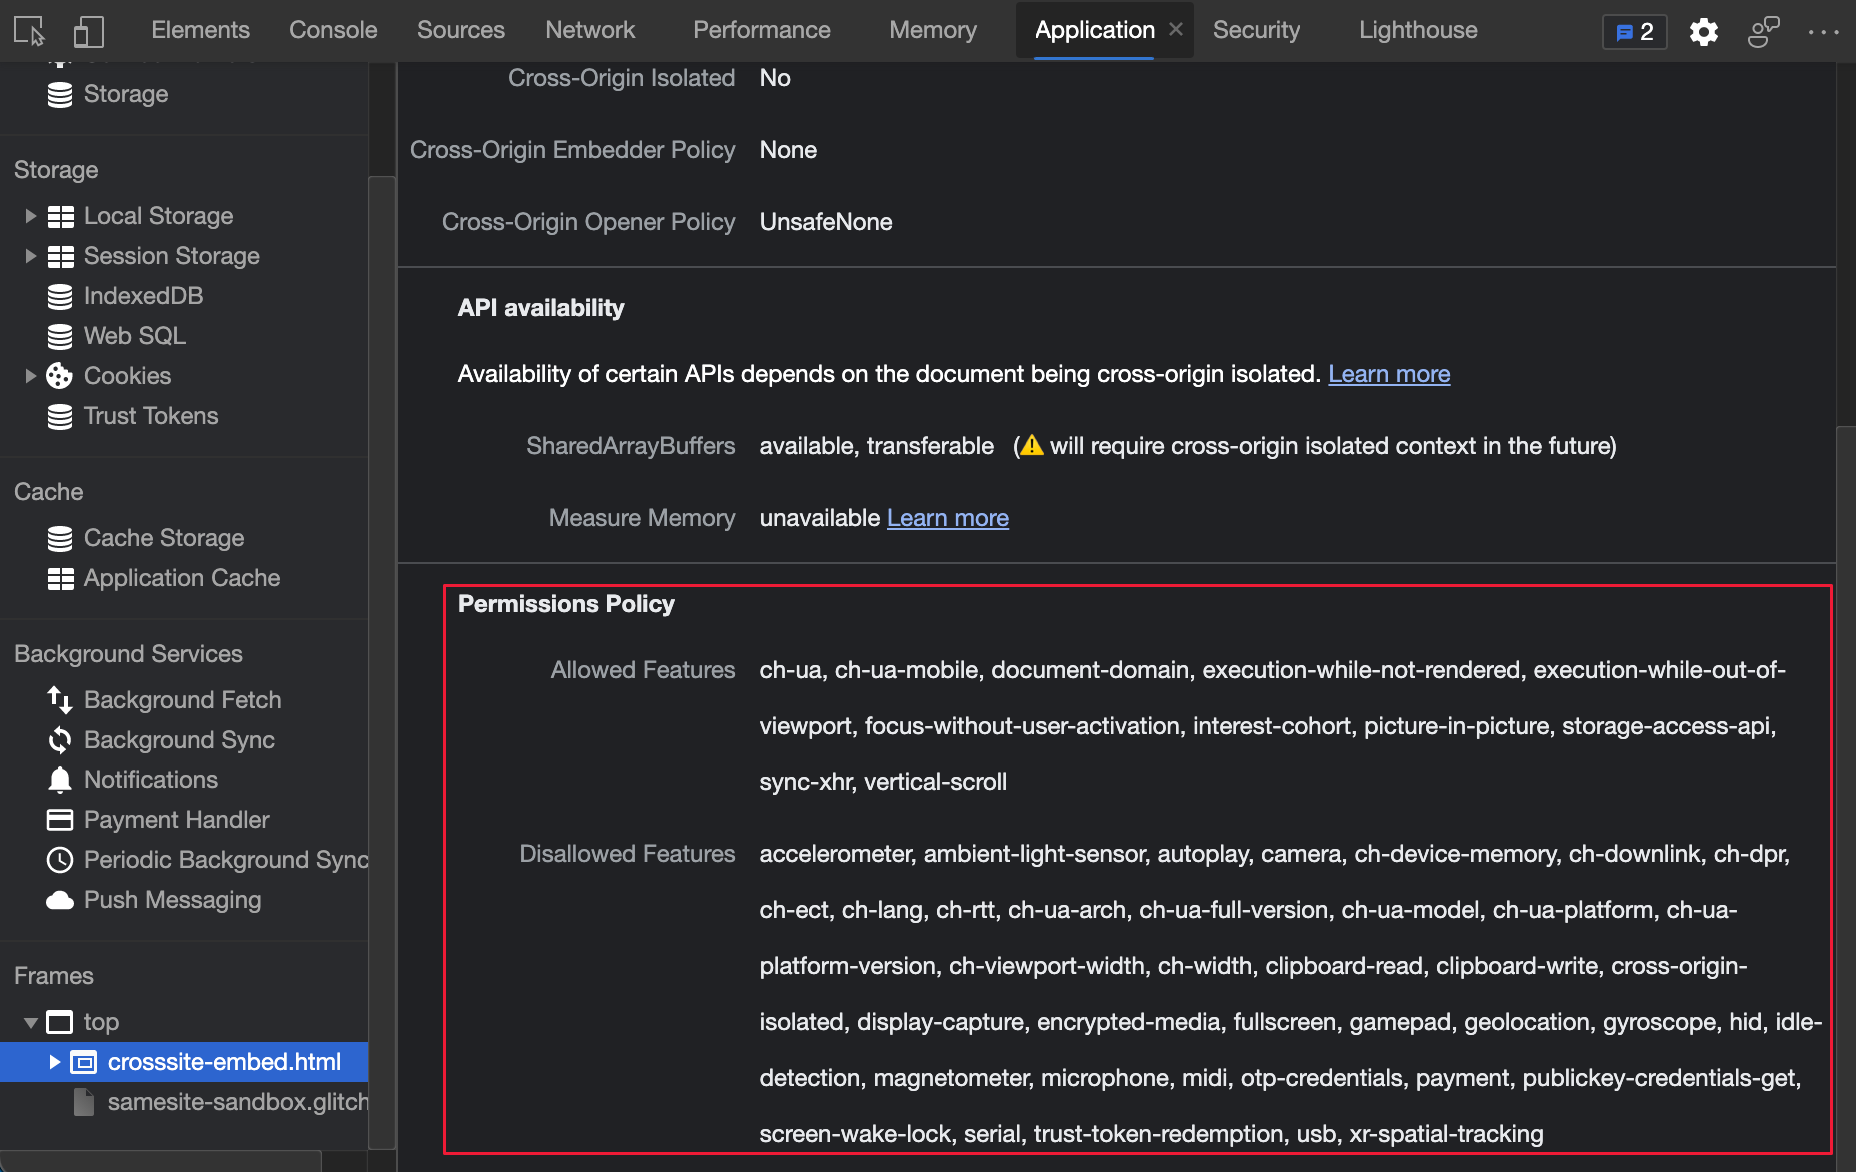
This list is controlled by the Permissions Policy web platform API, which allows a webpage to use, or blocks a webpage from using, specified browser features in an individual frame or in iframes that the frame embeds.
For the history of this feature in the Chromium open-source project, see Issue 1158827.
See also:
The Cookies pane in the Application tool now displays the SameParty attribute for each cookie:
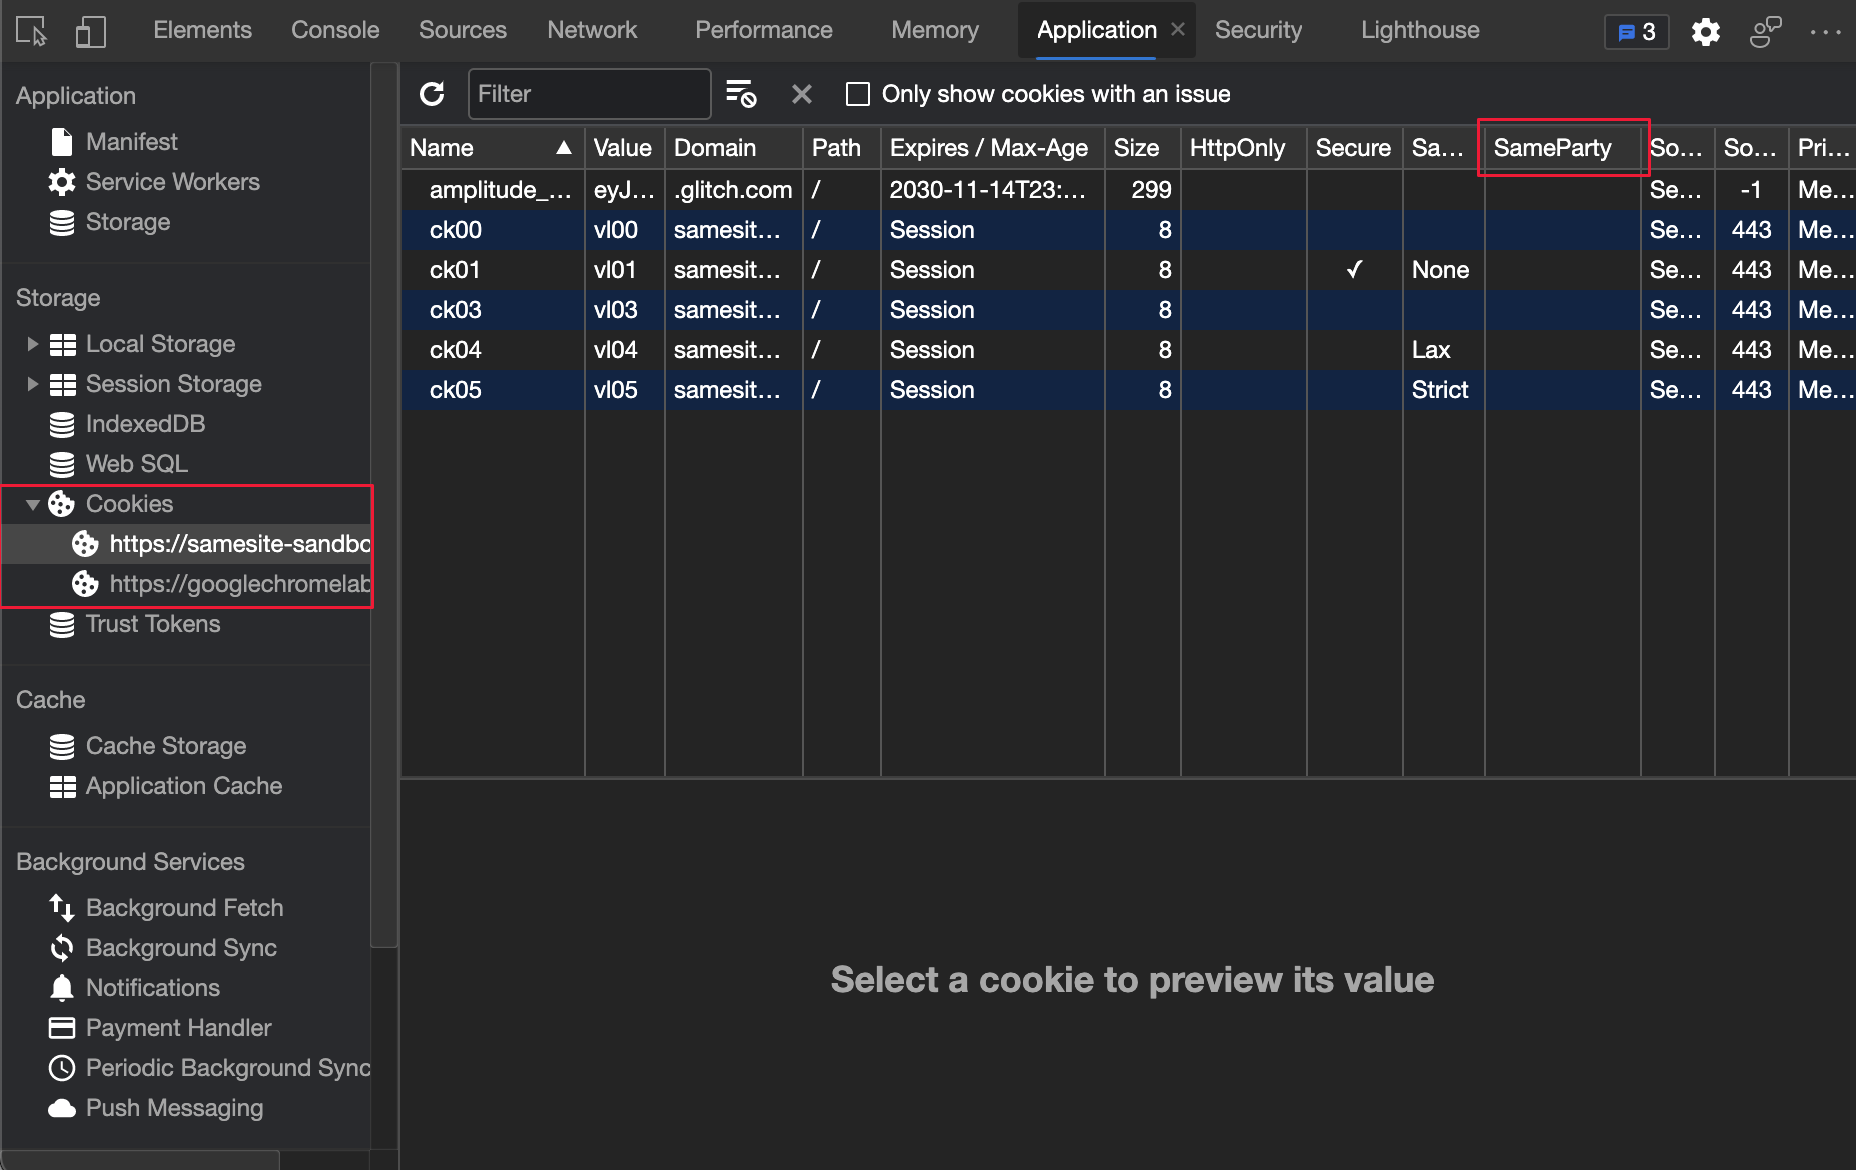
The SameParty attribute is a new boolean attribute to indicate whether a cookie is included in requests to origins of the same First-Party Sets.
For the history of this feature in the Chromium open-source project, see Issue 1161427.
See also:
Previously, the fn.displayName property allowed you to control debug names for functions to display in error.stack and in DevTools stack traces. Starting in Microsoft Edge version 90, the fn.displayName property is now deprecated, and replaced by the fn.name property:
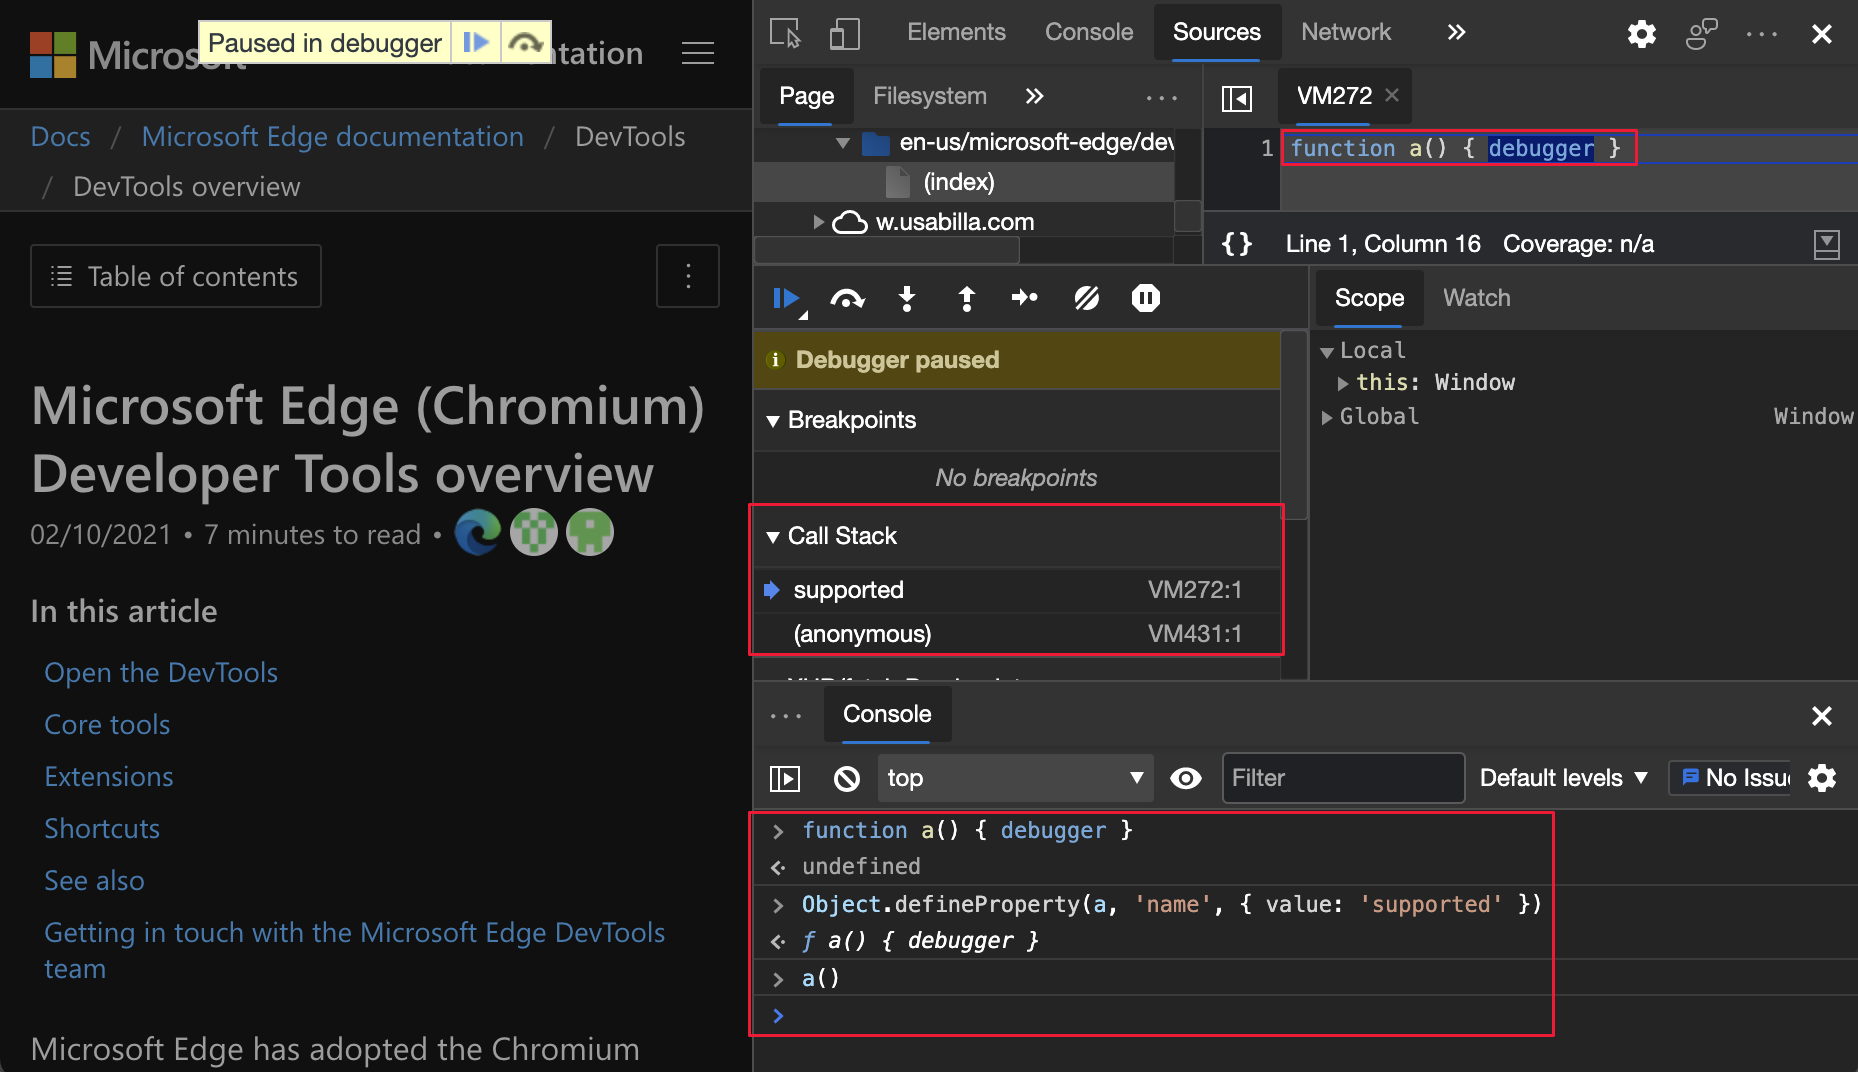
Use the standard Object.defineProperty method to define the fn.name property. To learn more about fn.name, see Function.name.
For the history of this feature in the Chromium open-source project, see Issue 1177685.
See also:

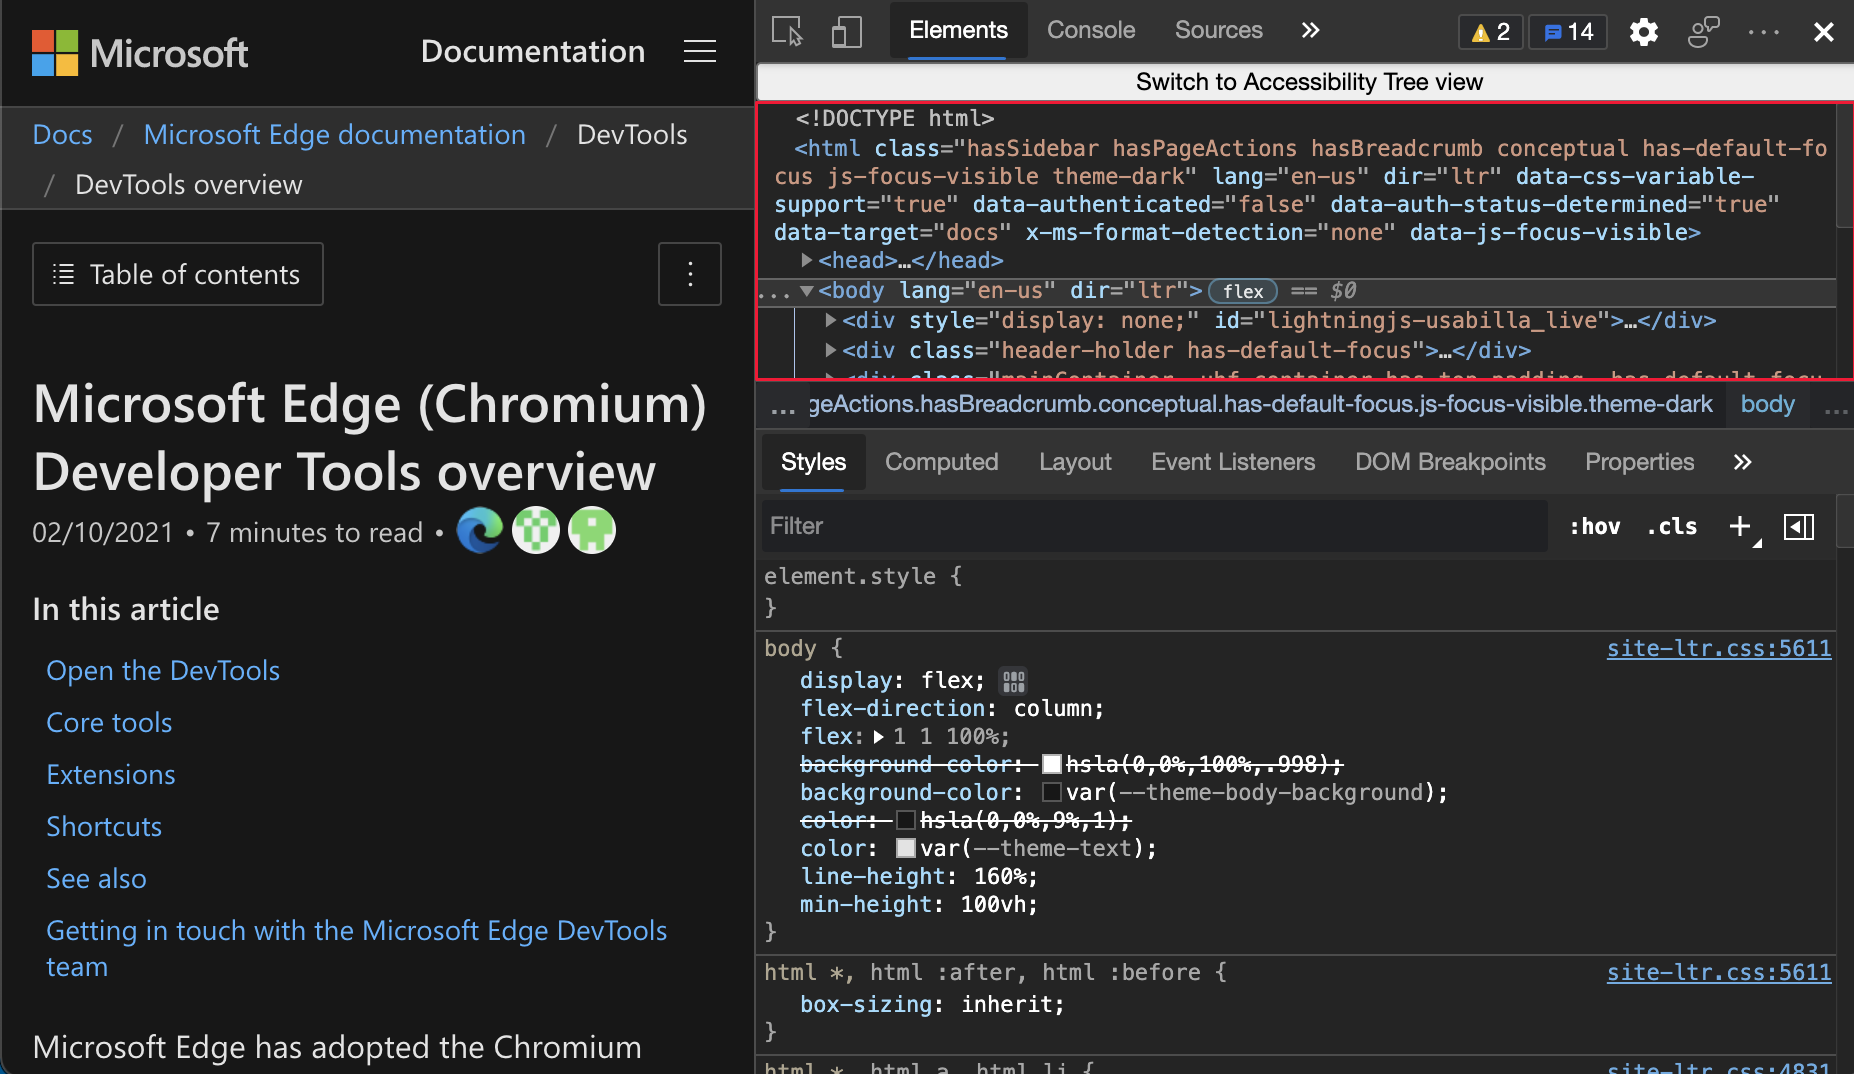
This experiment provides a full accessibility tree view in the Elements tool. The Accessibility tab (grouped with the Styles tab) provides a partial accessibility tree view, that displays the direct ancestor chain from the root node to the inspected node. After you turn on this experiment and reload DevTools, click the button area at the top of the Elements panel to switch the display in the Elements tool for all elements on the webpage.
To display the DOM tree view, click the Switch to DOM Tree view button area at the top:
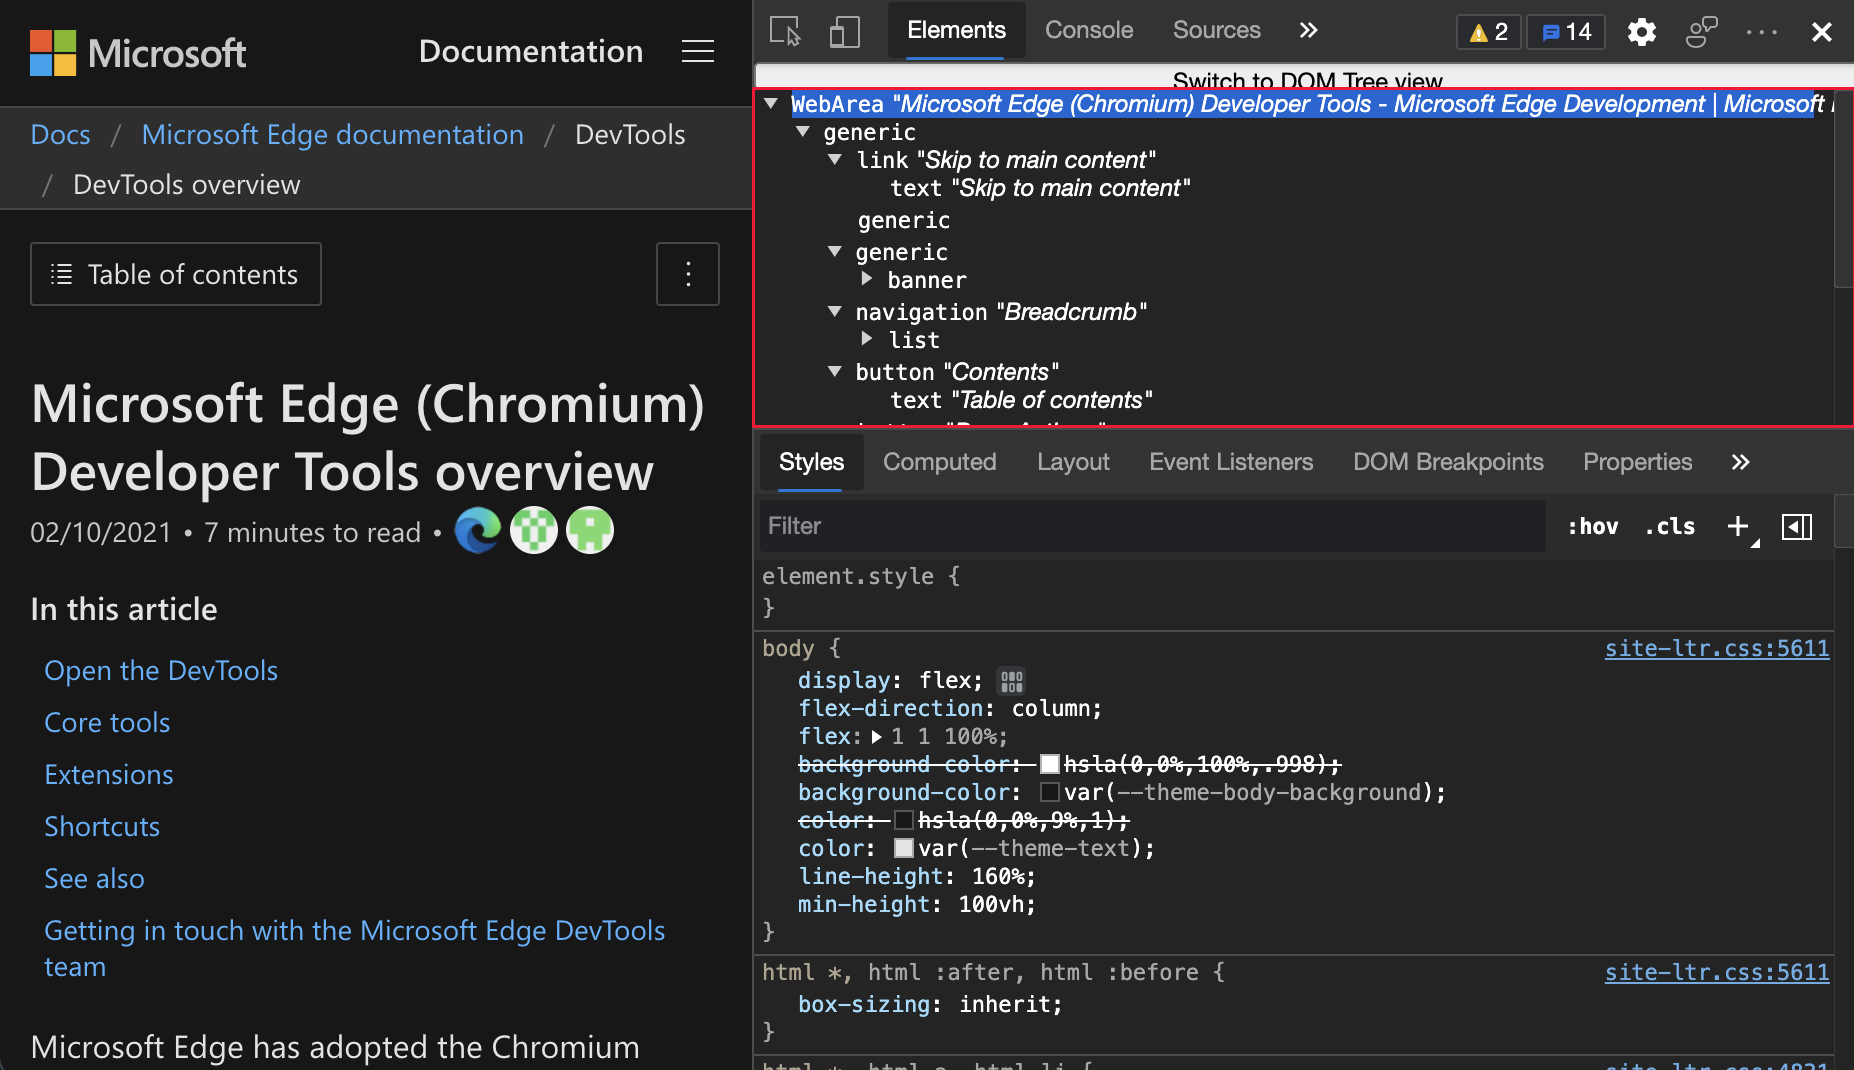
To display the full accessibility tree, click the Switch to Accessibility Tree view button area at the top:
To turn on the experiment, see Turning an experiment on or off and select the checkbox next to Enable full accessibility tree view in the Elements panel.
For the history of this feature in the Chromium open-source project, see Issue 887173.
See also:
Note
Portions of this page are modifications based on work created and shared by Google and used according to terms described in the Creative Commons Attribution 4.0 International License. The original page is found here and is authored by Jecelyn Yeen.
![]() This work is licensed under a Creative Commons Attribution 4.0 International License.
This work is licensed under a Creative Commons Attribution 4.0 International License.
Training
Learning path
Use advance techniques in canvas apps to perform custom updates and optimization - Training
Use advance techniques in canvas apps to perform custom updates and optimization
Documentation
Experimental features in Microsoft Edge DevTools - Microsoft Edge Developer documentation
The latest experimental features in Microsoft Edge DevTools.
What's New in DevTools (Microsoft Edge 88) - Microsoft Edge Developer documentation
Microsoft Edge on Linux, improved webhint tips in the Issues tool, new service worker debugging features, and more.
What's New in DevTools (Microsoft Edge 89) - Microsoft Edge Developer documentation
The What's New tool is now Welcome, Visual Font Editor in the Styles pane, CSS Flexbox debugging tools, and more.