DevTools for Microsoft Teams tabs
When Teams is running in a browser, it's easy to access the browser's DevTools: F12 on Windows or Command-Option-I on macOS. The DevTools gives you access to:
- View console logs.
- View or modify HTML, CSS, and network requests during runtime.
- Add breakpoints to your JavaScript code and perform interactive debugging.
Note
The feature is only available for desktop and Android clients after the Developer Preview has been enabled. For more information, see How do I enable developer preview.
Access DevTools on the desktop
While the web version and the desktop version of Teams are almost the same, there are some differences concerning authentication. Sometimes the only way to figure out what is going on is to use the DevTools. To use DevTools in the desktop client, you must:
- Ensure you have enabled Enable developer preview.
- Open up a tab so you have something to inspect with the DevTools.
- Open the DevTools one of the following ways:
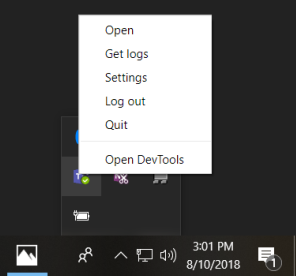
On Windows, you open DevTools via the Microsoft Teams icon in the desktop tray.
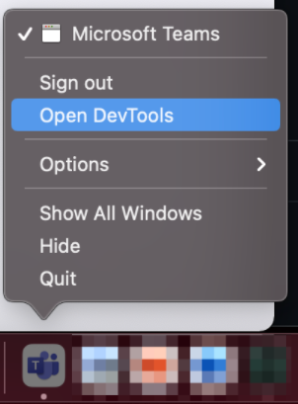
On macOS, select the Microsoft Teams icon in the Dock.
The following example shows DevTools open and inspecting a tab configuration dialog:

Access DevTools from an Android device
You can also enable the DevTools from the Teams Android client. To enable DevTools, you must:
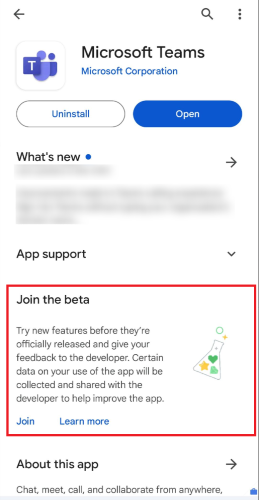
DevTools for Android is available only on the beta version of Teams app. To join the beta version of Teams app, follow the instructions listed in Get beta versions of apps.
Enable the developer preview.
Connect your device to your desktop computer, and set up your Android device for remote debugging.
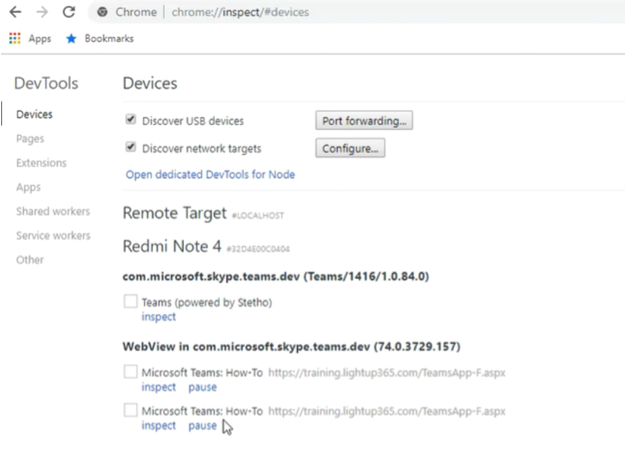
In your Chrome browser, open
chrome://inspect/#devices.Select inspect under the tab you wish to debug, as in the following image:
See also
Platform Docs
Feedback
Coming soon: Throughout 2024 we will be phasing out GitHub Issues as the feedback mechanism for content and replacing it with a new feedback system. For more information see: https://aka.ms/ContentUserFeedback.
Submit and view feedback for