Training
Module
Debug and deploy your extension in Dynamics 365 Business Central - Training
Discover how to debug with Visual Studio Code and deploy your extension using RAD feature in Dynamics 365 Business Central.
This browser is no longer supported.
Upgrade to Microsoft Edge to take advantage of the latest features, security updates, and technical support.
In some environments, a debugger can be attached on an Office Add-in that is already running. This can be useful when you want to debug an add-in that is already in staging or production. If you are still developing and testing the add-in, see Overview of debugging Office Add-ins.
The technique described in this article can be used only when the following conditions are met.
Tip
In recent versions of Office, one way to identify the webview control that Office is using is through the personality menu on any add-in where it's available. (The personality menu isn't supported in Outlook.) Open the menu and select Security Info. In the Security Info dialog on Windows, the Runtime reports Microsoft Edge, Microsoft Edge Legacy, or Internet Explorer. The runtime isn't included on the dialog in older versions of Office.
To launch the debugger, choose the top right corner of the task pane to activate the Personality menu (as shown in the red circle in the following image).
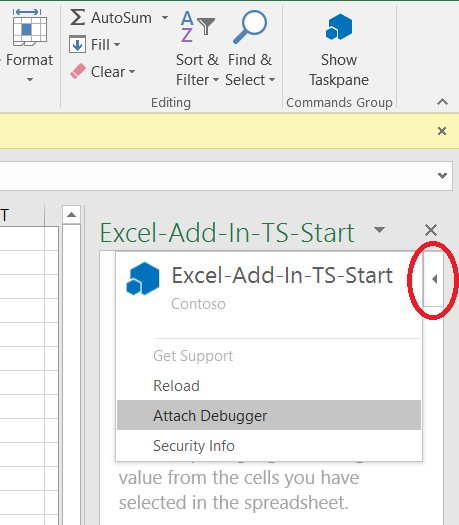
Select Attach Debugger. This launches the Microsoft Edge (Chromium-based) developer tools. Use the tools as described in Debug add-ins using developer tools in Microsoft Edge (Chromium-based).
Office Add-ins feedback
Office Add-ins is an open source project. Select a link to provide feedback:
Training
Module
Debug and deploy your extension in Dynamics 365 Business Central - Training
Discover how to debug with Visual Studio Code and deploy your extension using RAD feature in Dynamics 365 Business Central.